The Consumer Price Index and Inflation
The Consumer Price Index is an index number based on a hypothetical “basket of goods” for US Consumers. The idea is that by understanding how this basket of goods changes in price from year to year, we gain some insight into the economy. The number is expressed as an index, and the data is readily available from the Bureau of Labor Statistics. Our goal in this section is to download and manipulate the appropriate data to improve the plot below from the BLS.gov website.
\(~\)
We want to get two pieces of information from the BLS, the CPI since 1957 and the CPI without Food and Energy. To do so, you can grab the data and copy and paste it into a google sheet or excel file and save it. I’ve done so here, we will load it and display the table.
cpi <- read_excel("bls_cpi.xlsx")
kable(head(cpi))| Year | CPI | CPI_NOE |
|---|---|---|
| 1957 | 28.1 | 28.9 |
| 1958 | 28.9 | 29.6 |
| 1959 | 29.1 | 30.2 |
| 1960 | 29.6 | 30.6 |
| 1961 | 29.9 | 31.0 |
| 1962 | 30.2 | 31.4 |
Now we can plot these two columns. Note the difference in approach here without melting the dataframe. Instead, we can assign the points and lines to the individual columns as follows.
require(ggplot2)
ggplot(cpi) +
    geom_point(aes(x = Year, y = CPI) , color = "lightblue", show.legend = TRUE)+
    geom_line(aes(x = Year, y = CPI) , color = "lightblue")+
    geom_point(aes(x = Year, y = CPI_NOE, color = CPI_NOE), color = "grey", show.legend = TRUE) +
    geom_line(aes(x = Year, y = CPI_NOE, color = CPI_NOE), color = "grey") +
    theme_minimal() +
    labs(title = "CPI and CPI minus Food and Energy for 1957 - 2016")
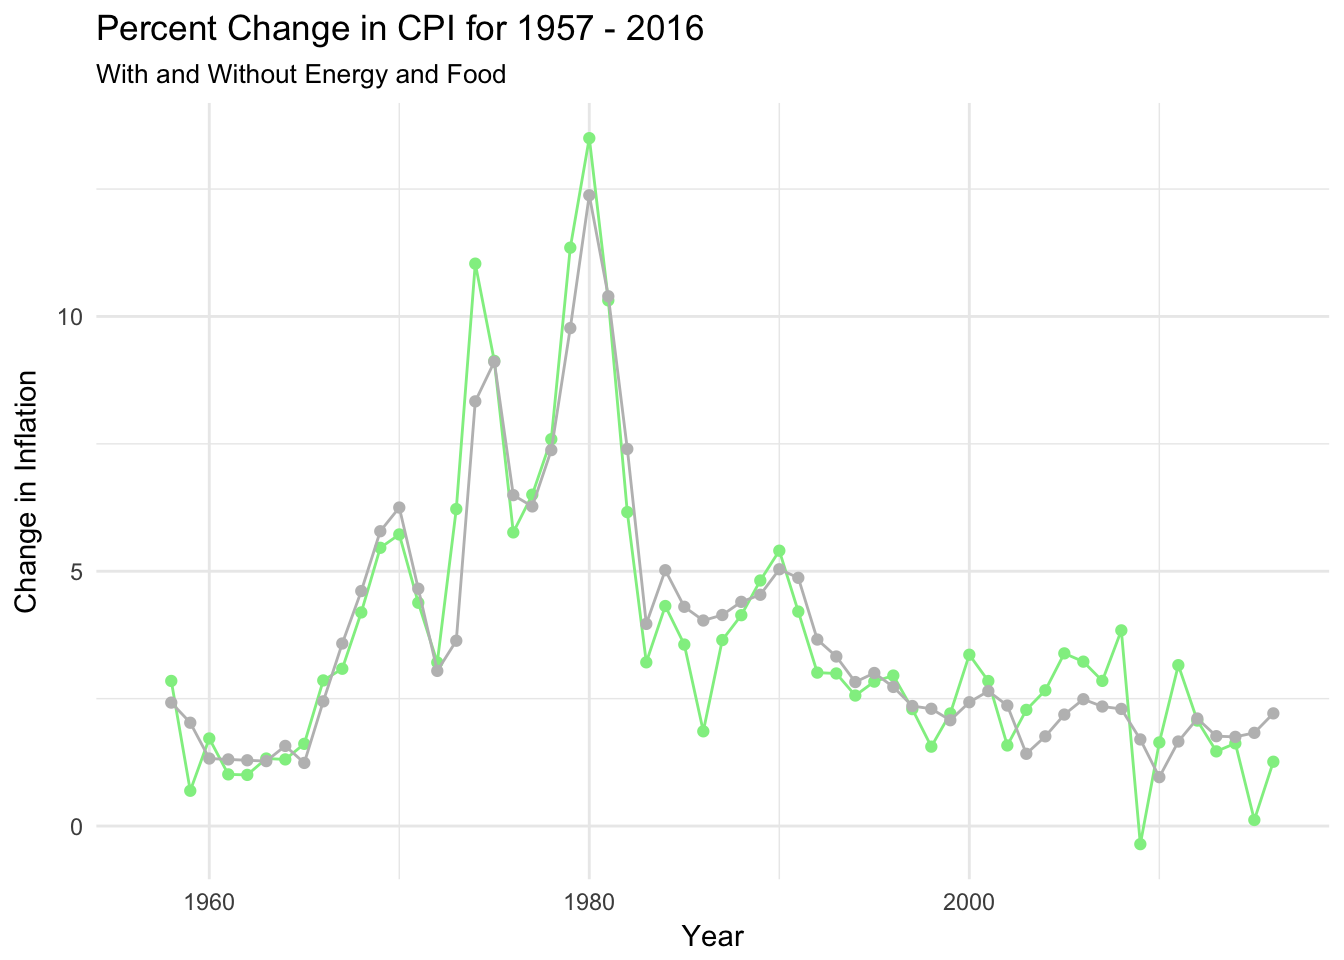
Inflation
Typically, the yearly change in the Consumer Price Index constitutes a measure for the rate of inflation. This means computing the percent change of the columns in the earlier dataframe. I did this in excel, as I’m not certain the easy way to do this in R yet. I simply used excel to add comlumns that computed the percent change.
library(readxl)
library(reshape)
cpi_infl <- read_excel("bls_cpi_infl.xlsx")
kable(head(cpi_infl))| Year | CPI | CPI_NOE | pct_chg_cpi | pct_chg_cpinoe |
|---|---|---|---|---|
| 1957 | 28.1 | 28.9 | NA | NA |
| 1958 | 28.9 | 29.6 | 2.8469751 | 2.422145 |
| 1959 | 29.1 | 30.2 | 0.6920415 | 2.027027 |
| 1960 | 29.6 | 30.6 | 1.7182131 | 1.324503 |
| 1961 | 29.9 | 31.0 | 1.0135135 | 1.307190 |
| 1962 | 30.2 | 31.4 | 1.0033445 | 1.290323 |
require(ggplot2)
ggplot(cpi_infl) +
    geom_point(aes(x = Year, y = pct_chg_cpi) , color = "lightgreen", show.legend = TRUE)+
    geom_line(aes(x = Year, y = pct_chg_cpi) , color = "lightgreen")+
    geom_point(aes(x = Year, y = pct_chg_cpinoe), color = "grey", show.legend = TRUE) +
    geom_line(aes(x = Year, y = pct_chg_cpinoe), color = "grey") +
    theme_minimal() +
    labs(title = "Percent Change in CPI for 1957 - 2016", subtitle = "With and Without Energy and Food", y = "Change in Inflation")
## Warning: Removed 1 rows containing missing values (geom_point).## Warning: Removed 1 rows containing missing values (geom_path).## Warning: Removed 1 rows containing missing values (geom_point).## Warning: Removed 1 rows containing missing values (geom_path).