Powers of 10 and Logarithms
From the film, we have the situation that every one unit we should increase the power of 10 by 1. We can represent this wil our machinery of for loops and with a static function as follows:
\[p(t) = 10^t \quad \text{or} \quad p[i + 1] = p[i] ~ \times ~ 10\]
We can define and plot this relationship using a function. The approach below avoids defining the inputs except for the visualization.
p <- function(t){
          10^t
}
pframe <- data.frame(t = 0)
ggplot(pframe, aes(x = t)) +
  stat_function(fun = p) +
  xlim(-24, 24) +
  theme_minimal() +
  labs(title = "Powers of 10 from -24 to 24", x = "Exponent")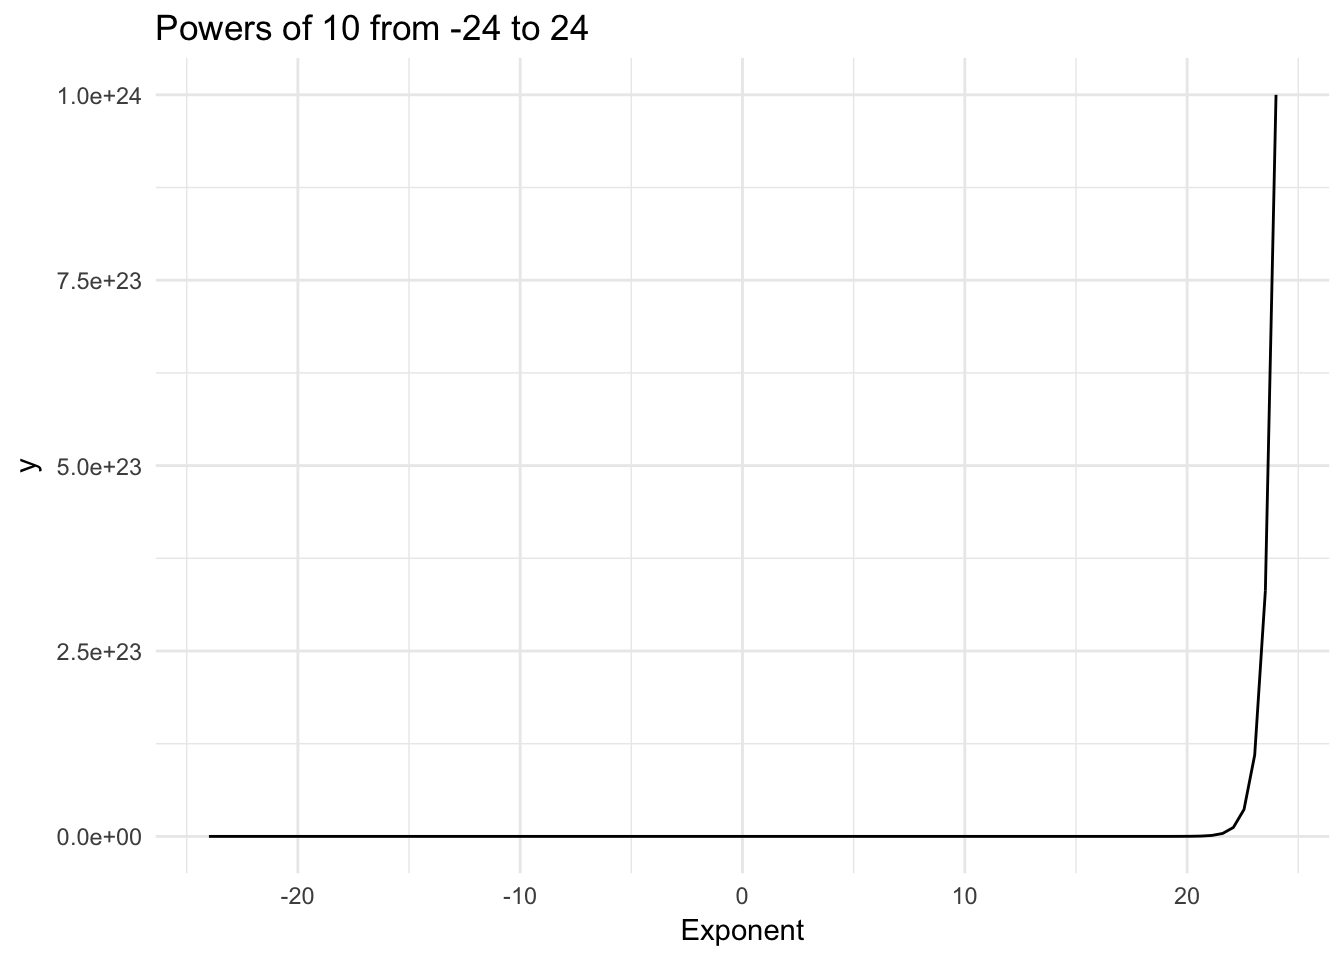
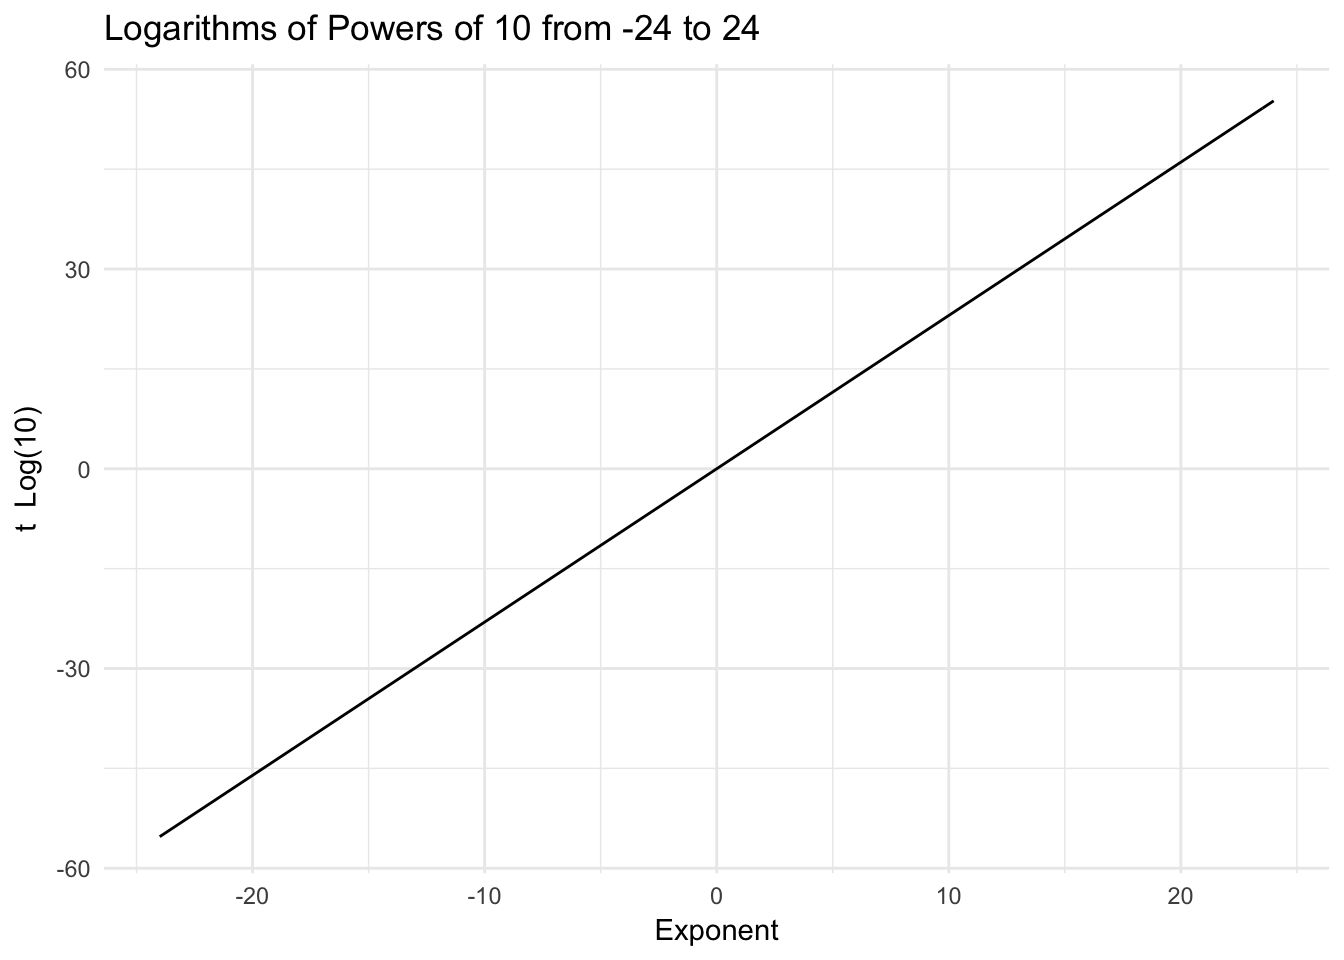
One of the difficulties here is that the range of values from very large to very small are quite large. We can adjust this by plotting by the exponents of the values on the vertical axis instead of the values themselves. This is the key idea behind a logarithm and we will continue to use these to transform exponential behavior in visualizations and in computation.
logp  <- function(t){
    log(10^t)
}
pframe <- data.frame(t = 0)
ggplot(pframe, aes(x = t)) +
  stat_function(fun = logp) +
  xlim(-24, 24) +
  theme_minimal() +
  labs(title = "Logarithms of Powers of 10 from -24 to 24", x = "Exponent", y = "t  Log(10)")