An Old Problem
\(~\)
Representing the Chessboard Problem
We can represent the mathematics of the problem fairly easily. We start with 1, and continue to multiply by two every day for a month. It is important that we recognize two ways of understanding the situation, for which the table below demonstrates.
\(~\)
| Day | Rice Multiplication | Value |
|---|---|---|
| 1 | 1 | 1 or \(2^0\) |
| 2 | \(1 \times 2\) | 2 or \(2^1\) |
| 3 | \(2 \times 2\) | 4 or \(2^2\) |
| 4 | \(2 \times 2 \times 2\) | 8 or \(2^3\) |
| \(\vdots\) | \(\vdots\) | \(\vdots\) |
| 25 | \(2 \times 2 \dots \times 2\) | 16,777,216 \(\quad\) or \(\quad 2^{24}\) |
\(~\)
Rice Multipliciation: This column can be thought of as saying multiply the previous term by 2. We would represent this problem mathematically using recursive notation as follows, where n is the month and rn is the amount of rice in month n.
\[r_n = r_{n-1} \times 2\]
Rice Value: We can see that in each entry of the Value column, the amount of rice can be expressed as 2 to the power of one less than the month. We can represent this with a static equation as follows, where r(n) represents the amount of rice in some month n.
\[r(n) = 2^{n-1}\]
To use R to solve these problems, we will see how to represent both of these situations. The dynamical representation will be solved using a for loop. The static representation will be accomplished using a function. Both are important tools. We will combine our results in a table and plot the results in a single graph and a series of individual plots using the facet_wrap() function in ggplot2.
Lists, Sequences, and Indicies
To begin, we want to explore the seq function a little to understand more about lists and indicies. The code below generates a sequence of the first 10 integers and assigns this sequence to the variable a.
a <-  seq(1:10)
a
## [1] 1 2 3 4 5 6 7 8 9 10We can access individual members of the list based on their index or position in the list. R starts indexing at 1, so a[1] provides the first member of the list.
a[1]## [1] 1Further, we can access a range of selections. Writing a[3:6] provides us with the 3rd through the 6th integers.
a[3:6]## [1] 3 4 5 6We can easily plot a list with the base plotting capabilities of R as follows.
plot(a, main = "A Basic Sequence Plot", xlab = "Index", ylab = "Value")
While this is nice, we will want to use the dataframe to house our values. This will be easier to display the information using kable and to plot the information using ggplot2. Further, we will being importing our own data in this chapter, and the primary format for interacting with this will again be as a dataframe. If we were to plot this with ggplot, we would first create a dataframe from the sequence. We would add another column named index that would accompany the values as an x coordinate in the plot.
library(knitr)
a <-  seq(1:10)
b <- seq(1:10)
df <- data.frame(a, b)
kable(head(df))| a | b |
|---|---|
| 1 | 1 |
| 2 | 2 |
| 3 | 3 |
| 4 | 4 |
| 5 | 5 |
| 6 | 6 |
Now we plot this with ggplot and use the point geometry.
library(ggplot2)
ggplot(df, aes(a, b), color = "cadetblue") +
    geom_point(color = "cadetblue") +
    geom_smooth(color = "cadetblue") +
    theme_minimal() +
    labs(title = "Our Sequence with ggplot2", x = "Index", y = "Term Value")
## `geom_smooth()` using method = 'loess'
For Loops and the Chessboard Problem
To represent the chessboard problem, we need heavier machinery. We will use a for loop, the runs through a process for a finite series that we will determine. For example, the sequence generation from the last section can be generated with the following for loop.
for(i in 1:10){
  print(i)
}
## [1] 1
## [1] 2
## [1] 3
## [1] 4
## [1] 5
## [1] 6
## [1] 7
## [1] 8
## [1] 9
## [1] 10We will use a slightly more complex logic to generate the chessboard sequence. We start by assigning a starting value to a sequence. From here, we use a for loop to repeat a process on the first term, an place this as a subsequent term in the sequence. For example, to add three to 2 four times would be represented as:
a = 2
for(i in 1:4){
  a[i+1] =  a[i] +3
}
For the chessboard example, we want to loop through a multiply by two process, starting with one, for the length of days in the month.
library(knitr)
rice <- 1
for(i in 1:25){
    rice[i+1] <- rice[i]*2
}
days <- seq(length(rice))
df <- data.frame(days, rice)
kable(head(df))| days | rice |
|---|---|
| 1 | 1 |
| 2 | 2 |
| 3 | 4 |
| 4 | 8 |
| 5 | 16 |
| 6 | 32 |
\(~\)
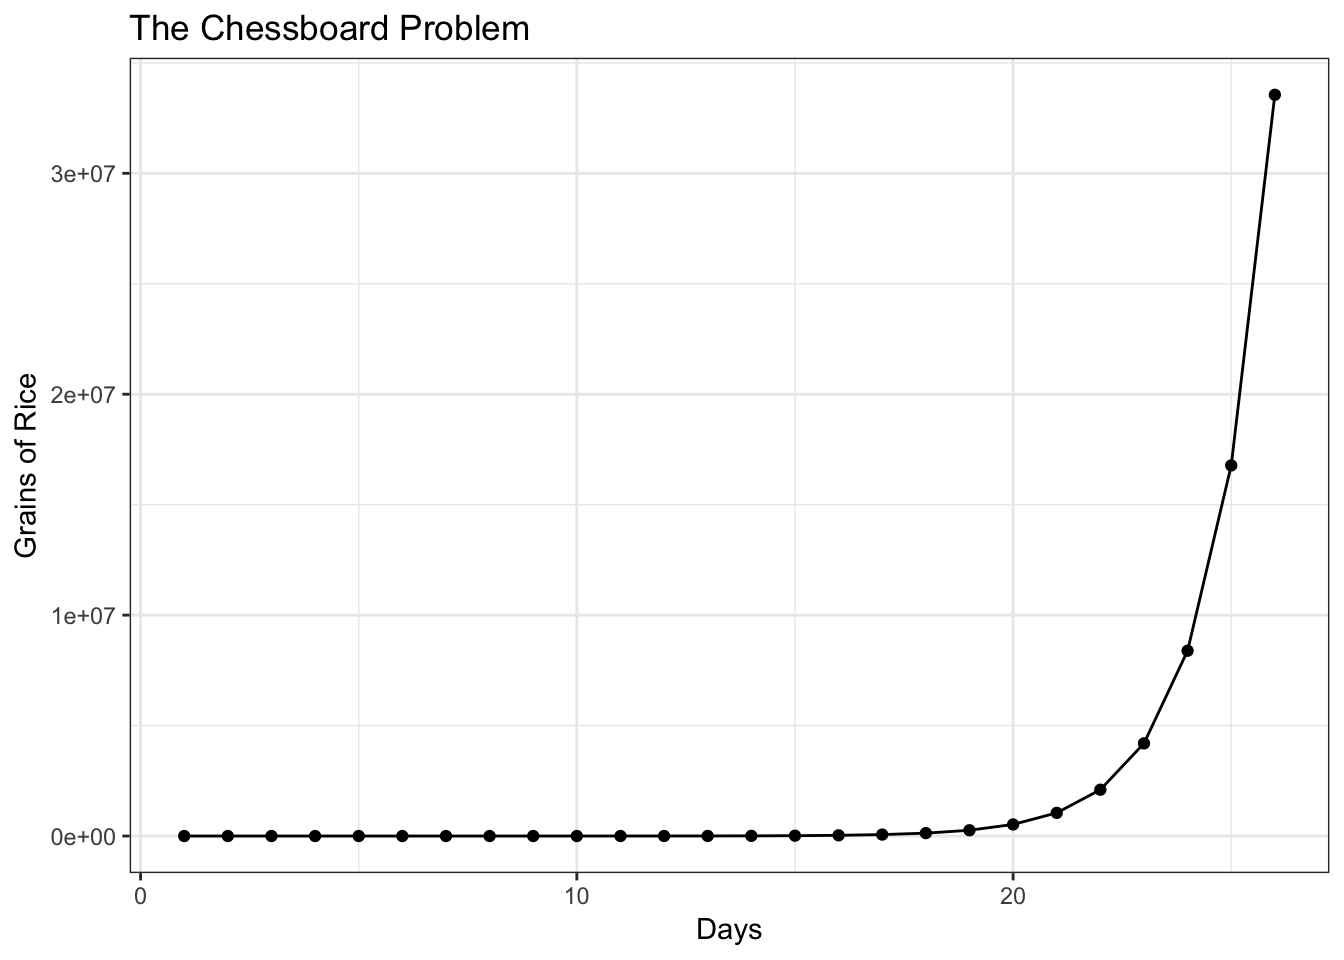
Now we have a nice dataframe that we can easily use ggplot2 to visualize.
\(~\)
ggplot(df, aes(days, rice)) +
    geom_point() +
    geom_line() +
    theme_bw() +
    labs(title = "The Chessboard Problem", x = "Days", y = "Grains of Rice")