4 Validity, Reliability, Generalizability (8/31)

Descriptive Stats Warm Up/Write Up
Validity
Reliability
Generalizability
CITI Training Certificate
Proposal Assignment
Due next week: A&L 73-77 and chapter 4; 2 topic areas of interest (re: proposal assignment).
4.1 Descriptive Stats Write Up
Go back to the “High School Band Practice” example. Email me a descriptive write-up (3-6 sentences) including information on students practice time OR musicianship scores. If you struggle with writing, simply state the mean(s), standard deviation(s), and distribution quality (positive skewed, negative skewed, normally distributed, etc.). What does this information tell you about the scores?
ABOVE AND BEYOND: Present a group level descriptive analysis (i.e., split the variable of interest by groups in the “Group” variable).
4.2 Measurement Validity
As Muijs states, “validity is therefore a multidimensional construct” (p. 60). Here, we will focus on element of measurement validity, which are distinct from issues of validity at the study level (i.e., a balance between internal and external validity). This discussion pertains only to the validity of the items and tests we are using to measure and collect data.
When considering validity, quantitative researchers ask the question “are we measuring what we wanted to measure?” This is necessary as we are consistently dealing with latent variables and proxy manifest variables as measurable representations of constructs and behaviors. Consider the following:
- Which HS band practice variable was latent?
- How might the researcher have conceived of the manifest variable from the latent variable?
The measurements underlying the variable “musicianship” should measure actual facets of musicianship, which may be defined as having the ability to listen/audiate, sing/play, and create/compose. Let’s assume a researcher created a set of tests based off of these abilities, and then added the scores in each area together for a final composite musicianship score.
We might examine the content validity of the test items/tasks. Content validity refers to whether the content of items or questions are appropriate for the intended measurement. Can you think of an example of poor content validity within one of our musicianship abilities? How about an example with good content validity?
The best practice for upholding content validity is to refer to previous research. It is uncommon to create entirely new items/tests for measuring constructs or behaviors, but it is common to find and adapt items that emerged from similar research questions.
4.2.1 Other Types of Measurement Validity
Criterion validity: Are results predictive of expected outcomes, or related/similar to other tests on the same topic? Made up of:
Predictive validity refers to whether the instrument you are using tends to predict the outcomes you would expect (based on your knowledge of the theory in focus). For instance, practice time may predict future enrollment in ensembles.
Concurrent validity relates to whether responses on your survey/instrument are similar to scores on other similar surveys/instruments. For instance, musicianship scores and attitudes towards music study should be associated with practice time.
Construct validity: Are constructs represented aptly and in conjunction with theory? For instance, we know that students are more likely to continue in school music if they feel their psychological needs are satisfied. There is a theory related to this construct of psychological needs—basic psychological needs theory—which states that each student has basic needs for autonomy, competence, and relatedness in their learning environment. If I were to dispense a scale using only autonomy items, or autonomy items and related measures such as interest, then I am not representing the construct well, and thus have low construct validity.
4.3 Reliability
Reliability refers to consistency within and between measurements. More specifically, reliability refers to the extent to which scores are free of measurement error. As no survey is free of measurement error:
Score = true score + systematic error + random error
Where systematic error is the same from one error to the next (e.g., scale that is tarred/calibrated at two pounds rather than zero) and random error is the variability in participant responses due to their mood, the way the question was worded (confusion), or the result of guessing on a question. We can assess the reliability of a survey by repeated measurement, also known as test-retest reliability, by measuring the same thing at different times.
Most often, we will utilize internal consistency by estimating Cronbach’s alpha. Internal consistency is applicable to instruments/questionnaires/surveys that have more than one item with the hope that there will be clear homogeneity between items as demonstrated through correlation. This is the primary reason we use multiple items in a subscale. Have you ever taken a survey and wondered why so many of the items sound the same? This is why.
We will be assessing reliability in later weeks. For now, just remember that subscales on questionnairs demonstrate satisfactory reliability at an alpha level > .70.
4.4 Generalizability
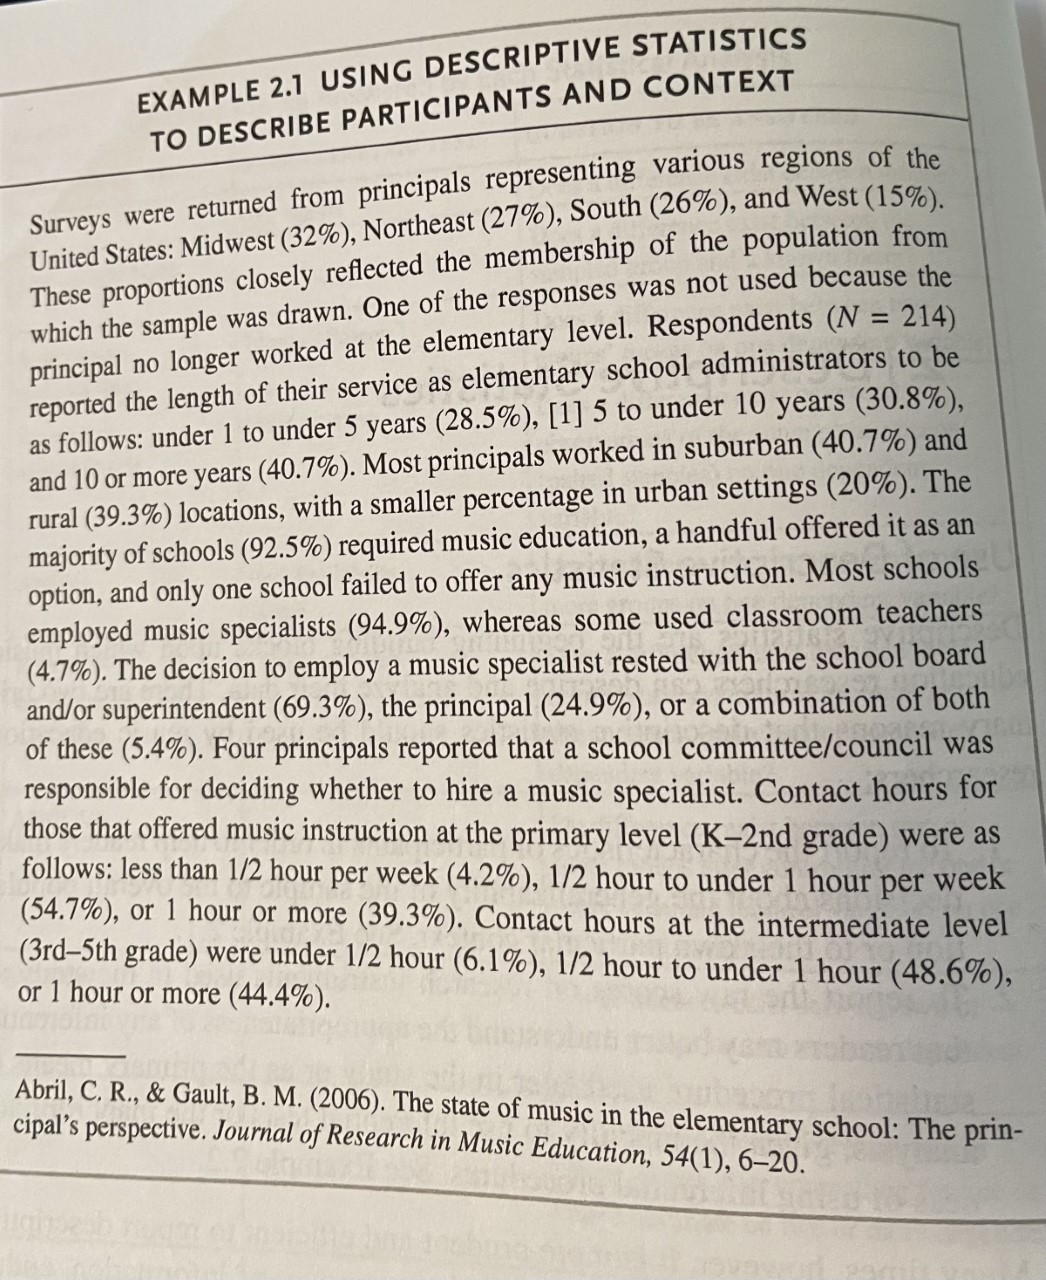
Both validity and reliability play into consideration of whether the results of a study are generalizable to larger populations. For instance, it is common for researchers to represent the entire population of the United States using ~400 individuals who are randomly (everyone has an equal chance) recruited. Other issues related to generalizability are sample representativeness (e.g., ethnicity, SES, geography) in relation to the phenomenon of interest, sample size, measurement validity, reliability, and study level validity (e.g., do conditions in the experiment reflect conditions in real life or are they controlled).
4.4.1 Type I and Type II Errors
Type I and Type II errors represent the generalizability of statistical conclusions.
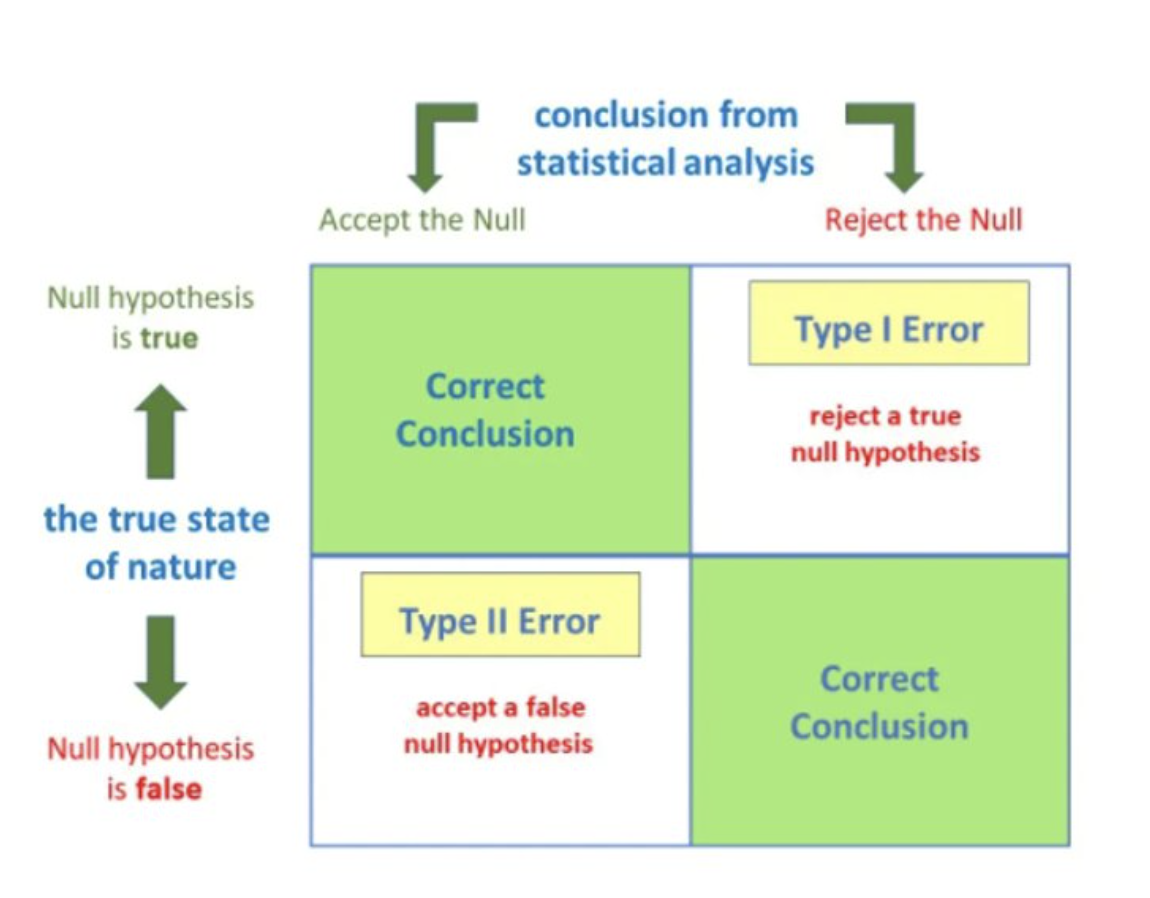
Type I error is the probability that you will wrongly reject the null hypothesis/wrongly accept the alternate hypothesis—this is also known as a false positive. p values (when calculated) or alpha values (when set a priori) represent the chance of committing a type I error. Social scientists tend to use an alpha of .05, but may set it lower to make a more compelling argument for their findings. For instance, if a researcher was to only accept that a finding is significant, and not due to random error or chance, at a alpha value of .01, their argument may be more compelling than if the alpha level were set to .05 or .10. Practically, this means that a finding (e.g., an educational method leads to significantly higher scores) will occur by chance in the general population at most 1/20 times at p < .05, 1/100 times at p < .01, and 1/10 times at p < .10.
As you increase the alpha level (i.e., the point at which a finding becomes statistically significant), you also increase the potential to commit a type II error. A Type II error is the probability that you will wrongly accept the null hypothesis/wrongly reject the alternate hypothesis—a false negative. The upshot is that significant findings are those that have a low likelihood of false positives in a larger population, and non-significant findings have a low likelihood of being found as false negatives in the general population.
To contend with type II errors, researchers use analysis of statistical power, which provides an estimate of the appropriateness of the sample to measure the parameters of a particular statistical test. As such, non-significant findings in underpowered studies are not implicitly evidence for the lack of an effect, and in fact may become significant with a larger sample. Issues with Type I and II errors are also related to the extent to which a researcher was able to deal with issues of sampling, validity, and reliability.