5 Measurement and Sampling (9/7)
Thus far, you have developed a few skills related to descriptive statistical analysis and considerations of reliability and measurement validity. In this class we will discuss:
The relationship between descriptive research and validity.
Surveys as data collection tools.
Probabilistic and non-probabilistic sampling methods.
Sample size considerations.
Potential areas of bias in survey research.
Due next week: Read Russell chapter 3 and turn in descriptive statistics quiz.
5.1 Descriptive Research Discussion

These include a) to understand the prevalence of a behavior, attitude, characteristic, or condition within a specific time period; b) identify trends, or patterns of changes in prevalence over time; c) to explore a phenomenon in depth; and d) to explore a phenomenon in a different population. Consider the following research questions. For which of these does it make sense to only conduct a descriptive study?
How have rates of high school ensemble enrollment changed over time?
Where is the most desirable graduate school to attain a Ph.D. in music education?
Are female-identifying students more likely than male-identifying students to complete music teacher training?
What is the most popular graduate music degree at R1 institutions?
Does consuming a 5-hour energy prior to ensemble auditions increase the quality of audition performance?
Which rationale for conducting a descriptive study applies to each research question? How might you expand descriptive examples to correlational or experimental research questions (based off of your current understanding)?
5.1.1 More on Descriptive Research
Descriptive research often provides the foundational information upon which a researcher can build a comparative study (two or more populations), an explanatory/predictive study of relationships among variables, or a targeted intervention study.
Descriptive researchers mainly focus on measurement reliability and validity (through pilot testing), as well as external validity—how confidently you can generalize findings from a sample to the target population (through sampling procedures). Descriptive researchers cannot really establish internal validity because there is no design element that provides for adequate control and reasonable claims of causality.
While descriptive research is the most common form of quantitative research, it is also the type of research most likely to be executed poorly. Why might this be the case?
5.2 Descriptive Research Data Collection Approaches
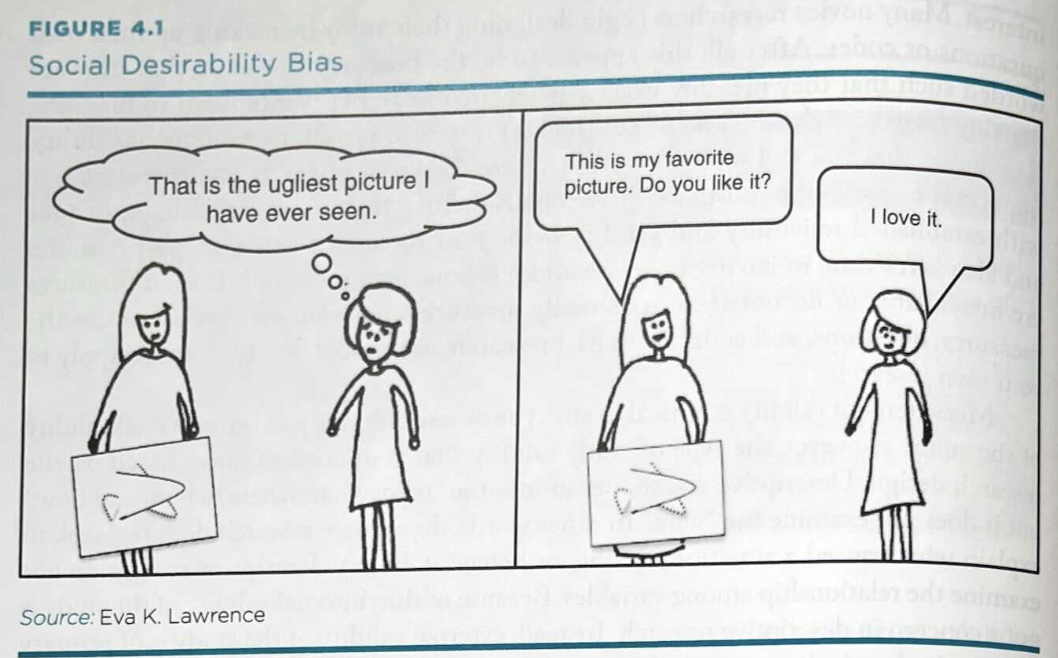
Surveys include self-report data collected through administration of questionnaires in person, through mail, or online. Self-report data are susceptible to social desirability bias. However, you can minimize social desirability bias through neutral item wording and anonymity via questionnaire construction and administration.
Interviews include self-report data collected through individual sessions or focus groups, using in-person, phone, and video formats Interviewer bias is a risk, but this can minimize by maintaining neutral affect, following a structured or semi-structured protocol, and providing confidentiality in lieu of anonymity.
Observations include 3rd party reports of behavior. Observer bias can be minimized by training observers, blinding them to the study purpose, and having them follow an observation protocol or checklist. You can also use two observers to establish inter-rater reliability (whereas high inter-rater reliability indicates a lack of bias).
5.3 Survey Sampling Approaches
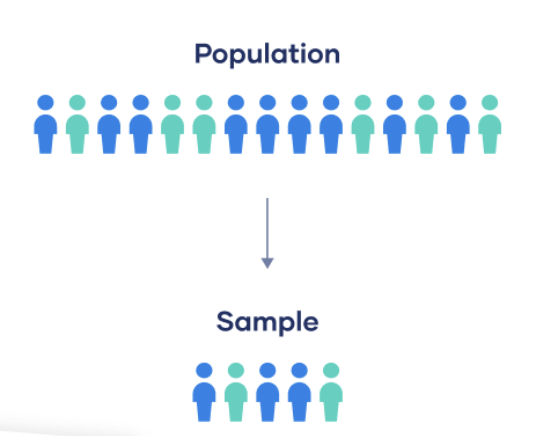
A target population includes all people, events, or objects that are the focus of the study and to which the researcher wishes to generalize the findings. A population frame includes a complete listing of population members. The universe sample includes everyone in the accessible population, or population members that the researcher can access given procedural or logistical restrictions (i.e., participant pool). The sample or population sample is a subgroup of the accessible population that provides representativeness. Sampling bias, however, can threaten the representativeness and generalizability of survey results.
5.3.1 Probabilistic Approaches
The underlying goal of any sampling procedure is to account for as much potential variance observed in a greater population as possible while minimizing measurement error and nonresponse bias.
Nonresponse bias occurs when those members of the sample who choose not to respond differ in some important ways from those who do respond. You can minimize non-response bias through advance notices, reminders, alternative contact formats, and incentives/reciprocity. A researcher can provide evidence of representativeness (lack of response bias) by comparing the respondents and non-respondents (or late respondents) on some important and known demographic variables.
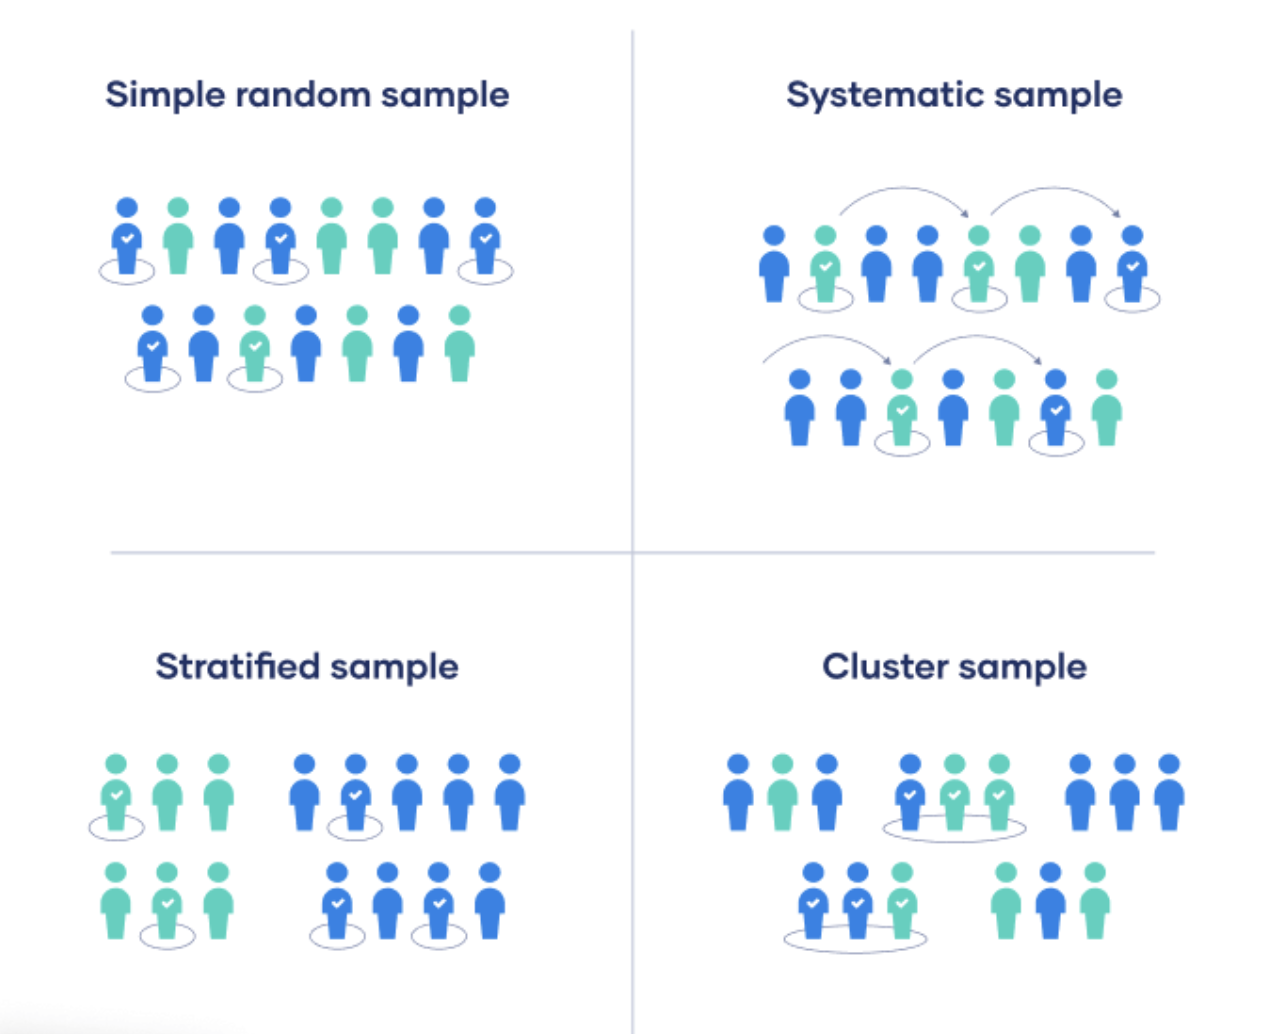
A random (probability) sampling approach requires that each member of the identified population have an equal probably of being selected for the sample. This provides the greatest control over sampling bias as we ensure we are not selecting participants based on other characteristics (e.g., SES).
With a simple random sample procedure:
Every person within the population has an equal likelihood to be chosen for the study’s participant sample
Participants are randomly drawn using a table of random numbers or a random number generator, or using the sample() function in R.
Random selection with replacement is preferred over random selection without replacement because probabilities are consistent throughout the random selection process (i.e., chance of selection does not change due to others being selected).
If a randomly selected individual does not respond, you must select a replacement member by running the original random sample process verbatim.
A systematic sample sample is like a random sample, but instead of randomly drawing participants they are chosen at regular intervals (e.g., every third person).
A stratified random sample approach allows you to stratify the target population based on important variables that may influence major study outcomes. Participants are randomly selected within each strata on a proportional basis (e.g., if 54% of the population are women, so will the sample be).
Cluster sampling relies on “clusters” or groups within the accessible population.The researcher randomly selects sample clusters (e.g., classes that meet at a certain time) and can then include every individual within each cluster, or randomly select individuals within each cluster if that information is known.
Lastly, with double sampling, the researcher follows-up with a participant sample selected for more in-depth data collection.
5.3.2 Non-Probabilistic Approaches
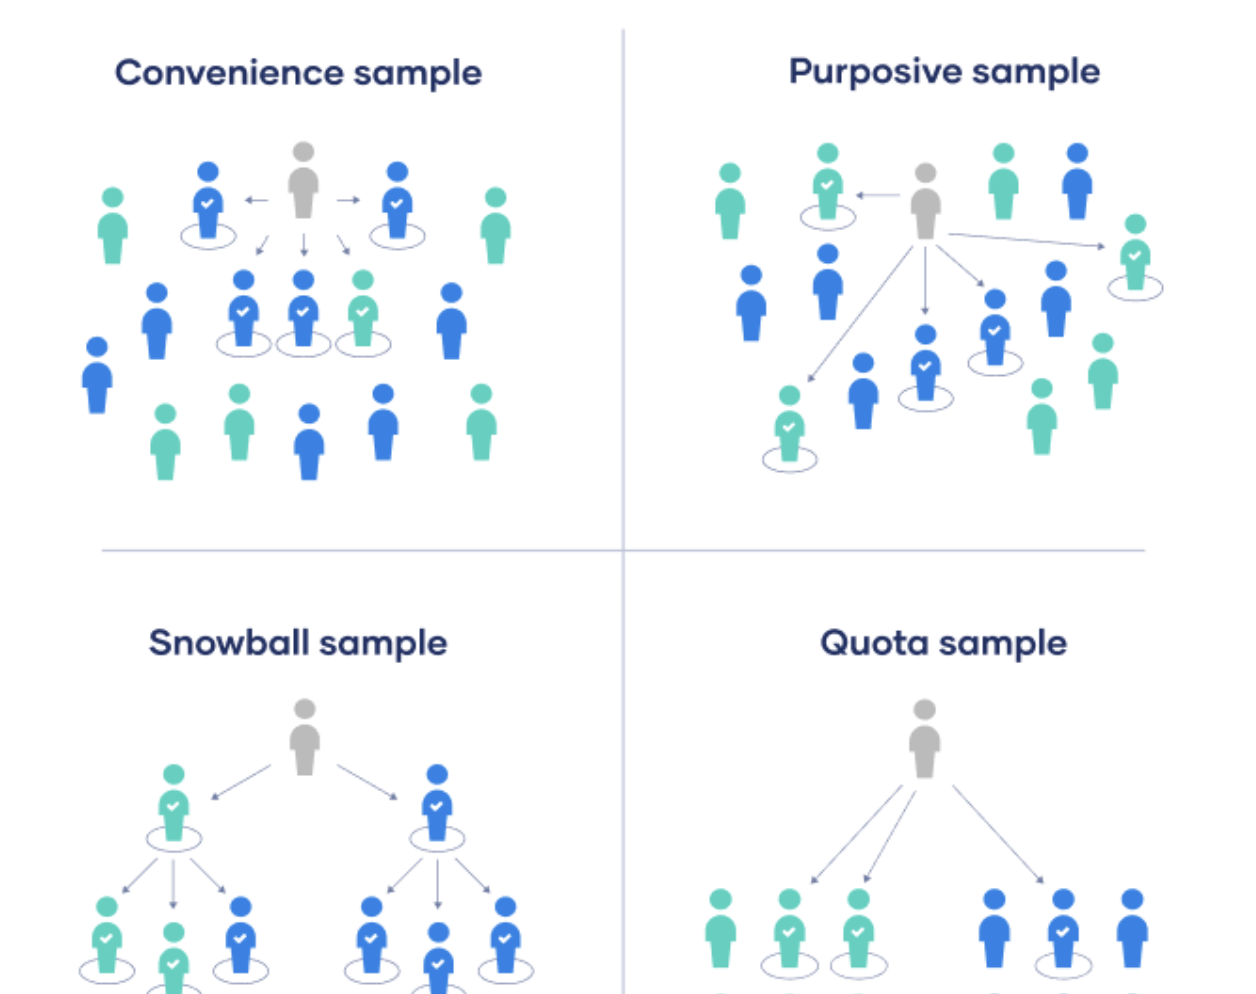
When random procedures are not attainable, it is fine to use non-probabilistic approaches. These include:
Convenience sampling—where a sample is made up of volunteers who are readily available and willing to participate. This invites a high risk of bias because of familiarity with the researcher and/or project purpose. Online surveys or social media polls that do not allow for tests of representativeness or generalizability fit into this category.
Snowball sampling—where the researcher asks participants to share the project/data collection tool with people they know that the researcher may not know.
Purposive/Quota Sampling Delimit the sample up front to a certain subpopulation by virtue of some characteristic that is important for study participants
Sample Size Considerations
Decisions regarding sample size in survey research should be driven by margin of error goal (+/- 5% or less). For smaller populations (< than 250), you should generally include everyone in the sample. That said, there are many other rules of thumb for sample size that depend on the method of analysis (e.g., 10 per predictive relationship in regression, 10 per cell in ANOVA, etc.).
To contend with concerns regarding generalizability, you can compare demographic characteristics of the accessible population and sample participants using Chi-square statistics, which we will cover next week. Think Shapiro-Wilk normality but comparing categorical frequencies to other categorical frequencies.
5.5 Questionnaire Development
After identifying a target population and sampling approach, and before developing your own descriptive data collection instrument, consider whether there are existing measures that have been validated (evidence of adequate reliability and validity), whether such measures may need to be adapted for research in music education, or whether you need to develop measures of our own. With the time we have remaining, follow the steps listed in this workshop: https://docs.google.com/document/d/17ZAPBgp5J26nALU9PPizUyd906B207-y8nKxBiSJ9pI/edit?usp=sharing