12 Multivariate Analysis (10/25-10/27)
See the week 9 for Dr. Austin’s guest lecture power point. See the week 10-11 for the introduction to multivariate analysis powerpoint and workshop.
library(readxl)
library(report)
12.1 Factorial ANOVA
factorial1 <- read_excel('factorialanova1.xlsx')
factorial1$Gender <- as.factor(factorial1$Gender)
factorial1$HighestMEdegree <- as.factor(factorial1$HighestMEdegree)

factorial2 <- read_excel('factorialanova2.xlsx')
factorial2$Instrumentvoice <- as.factor(factorial2$Instrumentvoice)
factorial2$Treatment <- as.factor(factorial2$Treatment)


factorial <- aov(ConductingOutcome ~ Gender*HighestMEdegree, data = factorial1)
summary(factorial)
## Df Sum Sq Mean Sq F value Pr(>F)
## Gender 1 10.8 10.82 16.074 9.39e-05 ***
## HighestMEdegree 3 371.5 123.83 183.921 < 2e-16 ***
## Gender:HighestMEdegree 3 1.3 0.43 0.646 0.587
## Residuals 157 105.7 0.67
## ---
## Signif. codes: 0 '***' 0.001 '**' 0.01 '*' 0.05 '.' 0.1 ' ' 1TukeyHSD(factorial)## Tukey multiple comparisons of means
## 95% family-wise confidence level
##
## Fit: aov(formula = ConductingOutcome ~ Gender * HighestMEdegree, data = factorial1)
##
## $Gender
## diff lwr upr p adj
## 1-0 0.5126582 0.2600895 0.765227 9.39e-05
##
## $HighestMEdegree
## diff lwr upr p adj
## 2-1 2.0657584 1.6054180 2.5260988 0.000000
## 3-1 4.1914916 3.6745023 4.7084810 0.000000
## 4-1 4.2929356 3.5817589 5.0041122 0.000000
## 3-2 2.1257333 1.7181867 2.5332798 0.000000
## 4-2 2.2271772 1.5911045 2.8632498 0.000000
## 4-3 0.1014439 -0.5767545 0.7796424 0.980029
##
## $`Gender:HighestMEdegree`
## diff lwr upr p adj
## 1:1-0:1 0.06862745 -0.8818285 1.0190834 0.9999986
## 0:2-0:1 2.25751634 1.5398655 2.9751672 0.0000000
## 1:2-0:1 1.93799682 1.1993793 2.6766144 0.0000000
## 0:3-0:1 4.30196078 3.4089577 5.1949639 0.0000000
## 1:3-0:1 4.35067873 3.5644097 5.1369477 0.0000000
## 0:4-0:1 4.73529412 2.8508407 6.6197475 0.0000000
## 1:4-0:1 4.50802139 3.5325686 5.4834742 0.0000000
## 0:2-1:1 2.18888889 1.3698800 3.0078978 0.0000000
## 1:2-1:1 1.86936937 1.0319276 2.7068111 0.0000000
## 0:3-1:1 4.23333333 3.2570099 5.2096567 0.0000000
## 1:3-1:1 4.28205128 3.4022946 5.1618079 0.0000000
## 0:4-1:1 4.66666667 2.7413310 6.5920024 0.0000000
## 1:4-1:1 4.43939394 3.3871292 5.4916587 0.0000000
## 1:2-0:2 -0.31951952 -0.8789522 0.2399132 0.6513757
## 0:3-0:2 2.04444444 1.2928704 2.7960185 0.0000000
## 1:3-0:2 2.09316239 1.4721728 2.7141520 0.0000000
## 0:4-0:2 2.47777778 0.6560825 4.2994731 0.0012354
## 1:4-0:2 2.25050505 1.4026151 3.0983950 0.0000000
## 0:3-1:2 2.36396396 1.5923444 3.1355836 0.0000000
## 1:3-1:2 2.41268191 1.7675763 3.0577875 0.0000000
## 0:4-1:2 2.79729730 0.9672408 4.6273538 0.0001530
## 1:4-1:2 2.57002457 1.7043165 3.4357327 0.0000000
## 1:3-0:3 0.04871795 -0.7686313 0.8660672 0.9999996
## 0:4-0:3 0.43333333 -1.4642982 2.3309649 0.9968508
## 1:4-0:3 0.20606061 -0.7946137 1.2067350 0.9983662
## 0:4-1:3 0.38461538 -1.4651873 2.2344181 0.9982618
## 1:4-1:3 0.15734266 -0.7493621 1.0640474 0.9994626
## 1:4-0:4 -0.22727273 -2.1650703 1.7105248 0.9999611report(factorial)## The ANOVA (formula: ConductingOutcome ~ Gender * HighestMEdegree) suggests that:
##
## - The main effect of Gender is statistically significant and medium (F(1, 157)
## = 16.07, p < .001; Eta2 (partial) = 0.09, 95% CI [0.03, 1.00])
## - The main effect of HighestMEdegree is statistically significant and large
## (F(3, 157) = 183.92, p < .001; Eta2 (partial) = 0.78, 95% CI [0.73, 1.00])
## - The interaction between Gender and HighestMEdegree is statistically not
## significant and small (F(3, 157) = 0.65, p = 0.587; Eta2 (partial) = 0.01, 95%
## CI [0.00, 1.00])
##
## Effect sizes were labelled following Field's (2013) recommendations.12.2 MANOVA
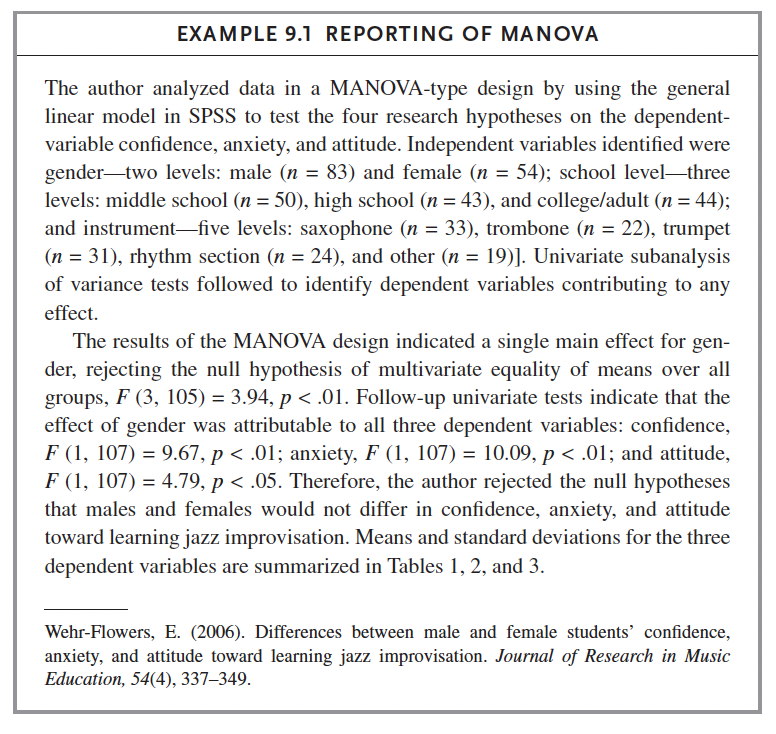
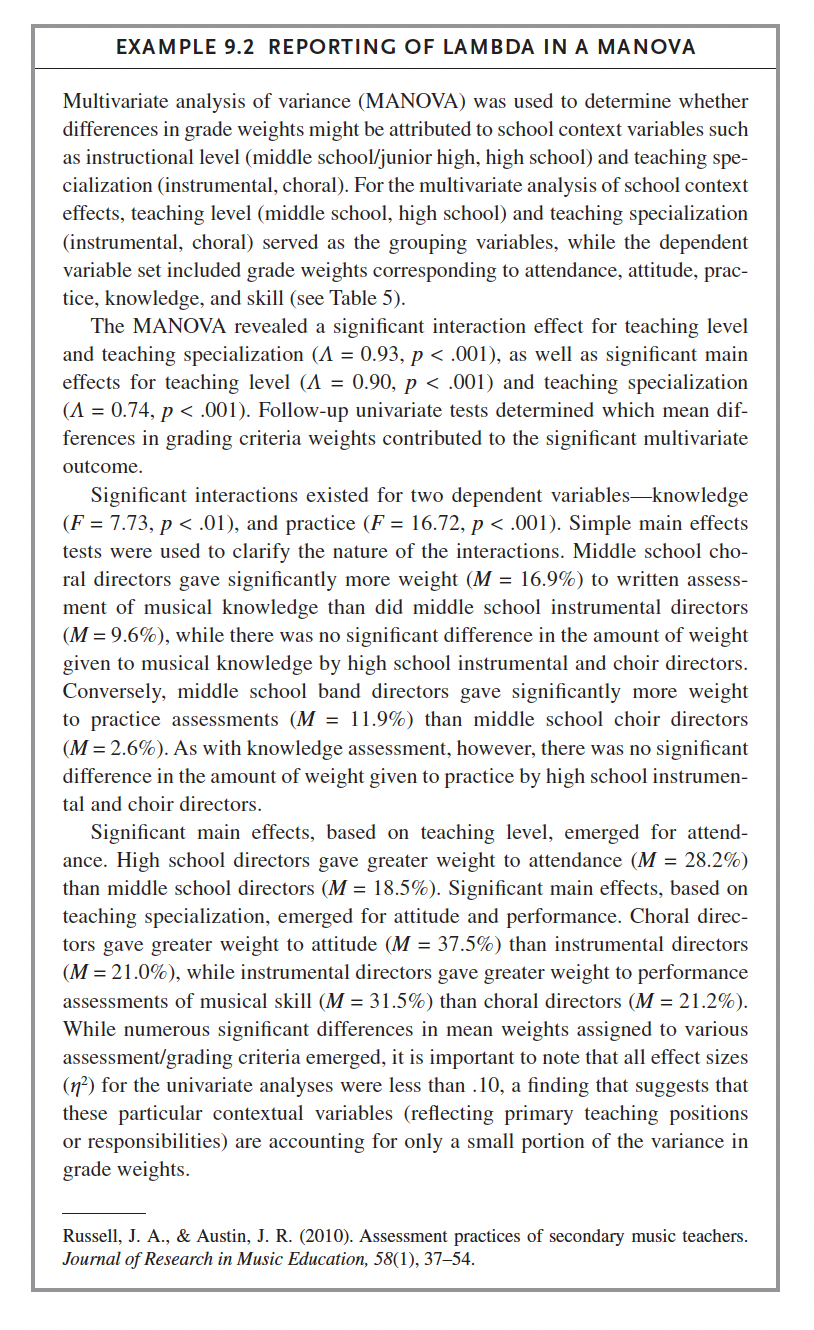
manova1 <- read_excel('manova1.xlsx')
dependentvariables <- cbind(manova1$enjoyment, manova1$audition)

manova <- manova(dependentvariables ~ musicclass, data = manova1)
summary(manova)
## Df Pillai approx F num Df den Df Pr(>F)
## musicclass 1 0.74919 144.88 2 97 < 2.2e-16 ***
## Residuals 98
## ---
## Signif. codes: 0 '***' 0.001 '**' 0.01 '*' 0.05 '.' 0.1 ' ' 1library(effectsize)##
## Attaching package: 'effectsize'## The following objects are masked from 'package:rstatix':
##
## cohens_d, eta_squared## The following object is masked from 'package:psych':
##
## phieta_squared(manova)## # Effect Size for ANOVA (Type I)
##
## Parameter | Eta2 (partial) | 95% CI
## ------------------------------------------
## musicclass | 0.75 | [0.68, 1.00]
##
## - One-sided CIs: upper bound fixed at [1.00].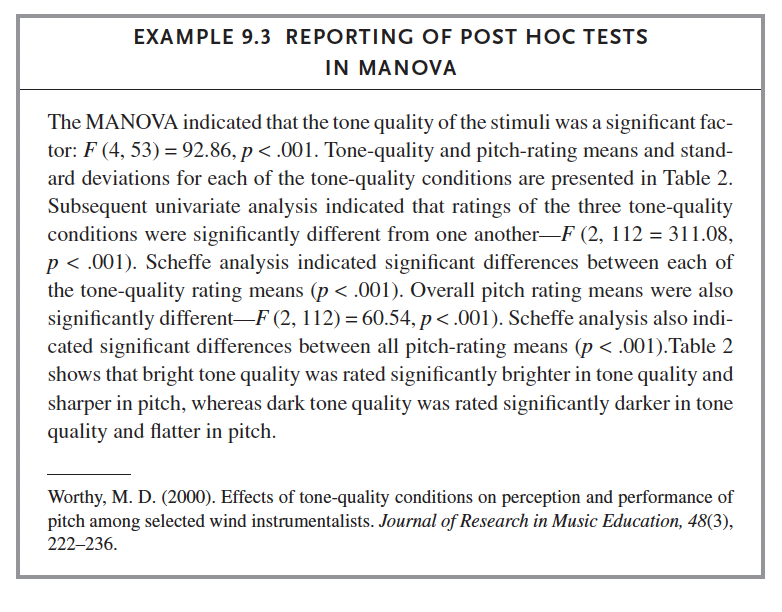
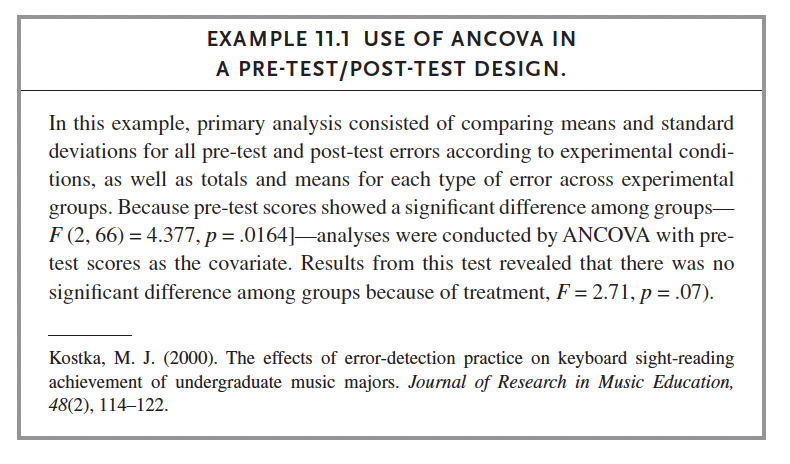
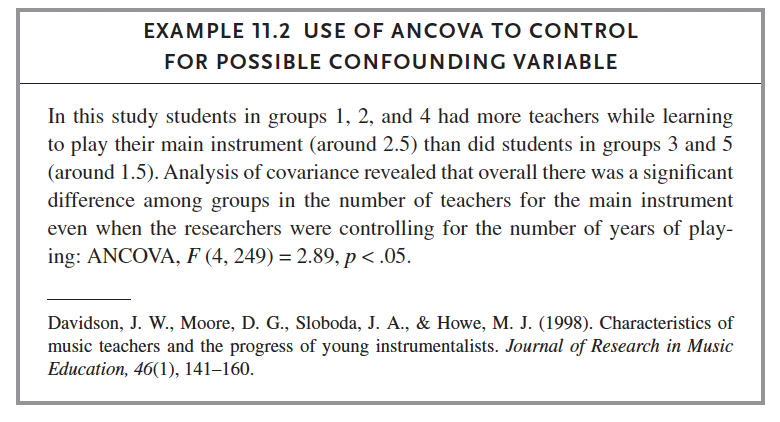
12.3 ANCOVA
ancova1 <- read_excel("ancova1.xlsx")
ancova1$Group <- as.factor(ancova1$Group)

ancovamodel <- aov(Discomfort ~ Group + PhysicalActive, data = ancova1)
summary(ancovamodel, type="III")
## Df Sum Sq Mean Sq F value Pr(>F)
## Group 3 207.80 69.27 126.366 <2e-16 ***
## PhysicalActive 1 0.75 0.75 1.371 0.243
## Residuals 158 86.61 0.55
## ---
## Signif. codes: 0 '***' 0.001 '**' 0.01 '*' 0.05 '.' 0.1 ' ' 1TukeyHSD(ancovamodel, which = 'Group')## Warning in replications(paste("~", xx), data = mf): non-factors ignored:
## PhysicalActive## Tukey multiple comparisons of means
## 95% family-wise confidence level
##
## Fit: aov(formula = Discomfort ~ Group + PhysicalActive, data = ancova1)
##
## $Group
## diff lwr upr p adj
## 2-1 -0.2000000 -0.6247243 0.2247243 0.6133831
## 3-1 -1.0648649 -1.5033646 -0.6263651 0.0000000
## 4-1 -2.7909091 -3.2108983 -2.3709198 0.0000000
## 3-2 -0.8648649 -1.2983188 -0.4314110 0.0000040
## 4-2 -2.5909091 -3.0056273 -2.1761909 0.0000000
## 4-3 -1.7260442 -2.1548594 -1.2972290 0.0000000eta_squared(ancovamodel)## # Effect Size for ANOVA (Type I)
##
## Parameter | Eta2 (partial) | 95% CI
## ----------------------------------------------
## Group | 0.71 | [0.65, 1.00]
## PhysicalActive | 8.61e-03 | [0.00, 1.00]
##
## - One-sided CIs: upper bound fixed at [1.00].