1 Day 1 (January 17)
1.1 Welcome and preliminaries
Teaching Assistant
-
- How I will use Canvas
- Grades and assignment submissions only
- How I will use Canvas
-
- Required and Recomended material
- Statistical programming languages
- Reproducibility requirement (data analysis and computing can be successfully repeated)
- Academic Honesty: working in groups, sharing code, etc.
- Grades
- Topics
Who is in this class?
- Group work and collaboration
url <- "https://www.dropbox.com/s/w09lq70ex377ell/students_STAT_768_A.csv?dl=1"
df <- read.csv(url)

par(mar=c(13,2,2,2))
plot(rev(sort(table(df$degreeProgram))),las=2,xlab="",ylab="Number of students",ylim=c(0,8))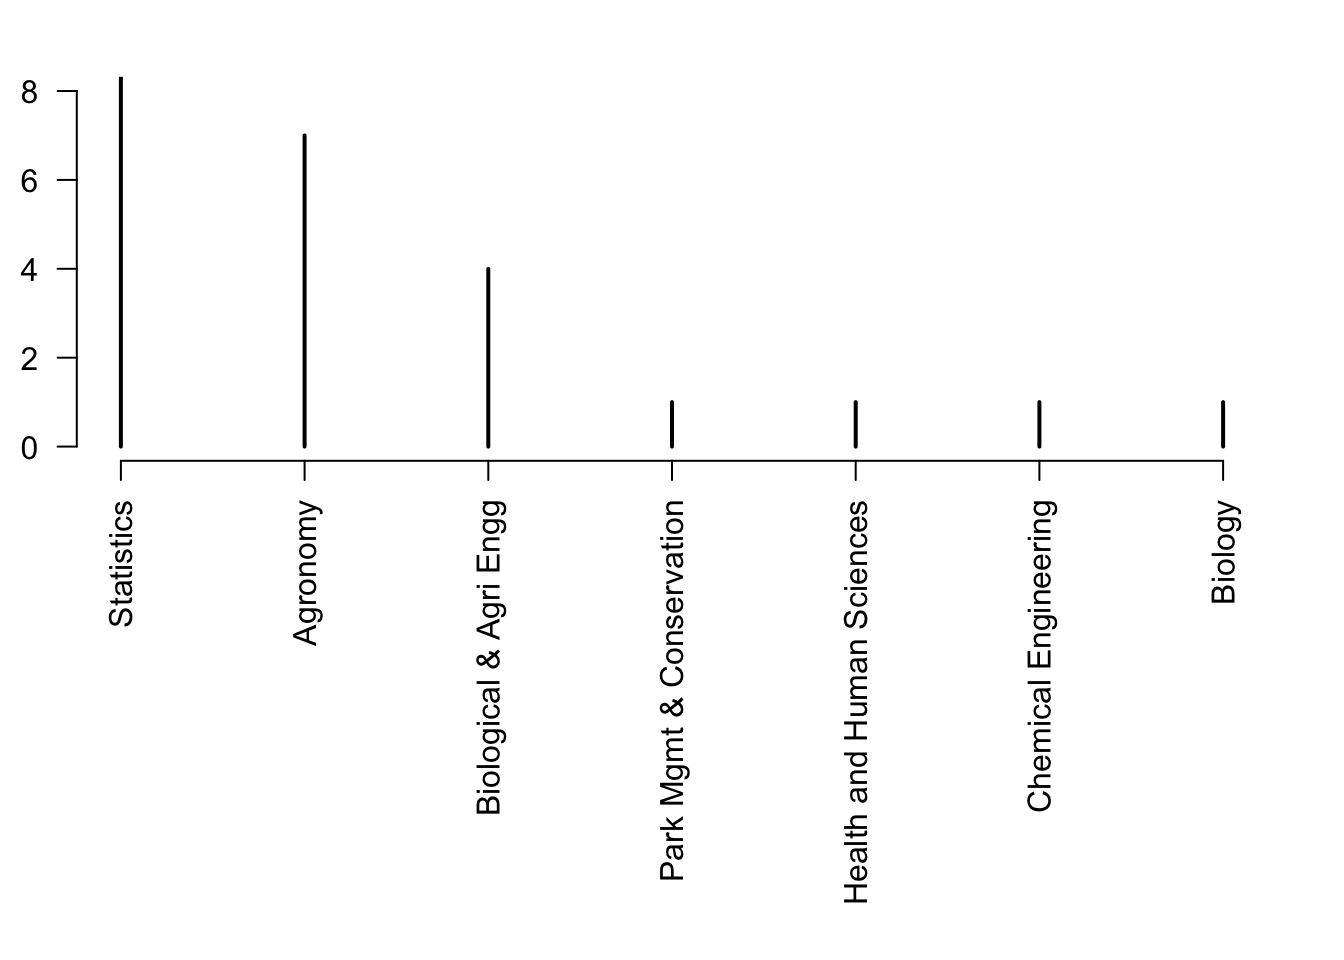
par(mar=c(13,2,2,2))
plot(rev(sort(table(df$classLevel))),las=2,xlab="",ylab="Number of students",ylim=c(0,15))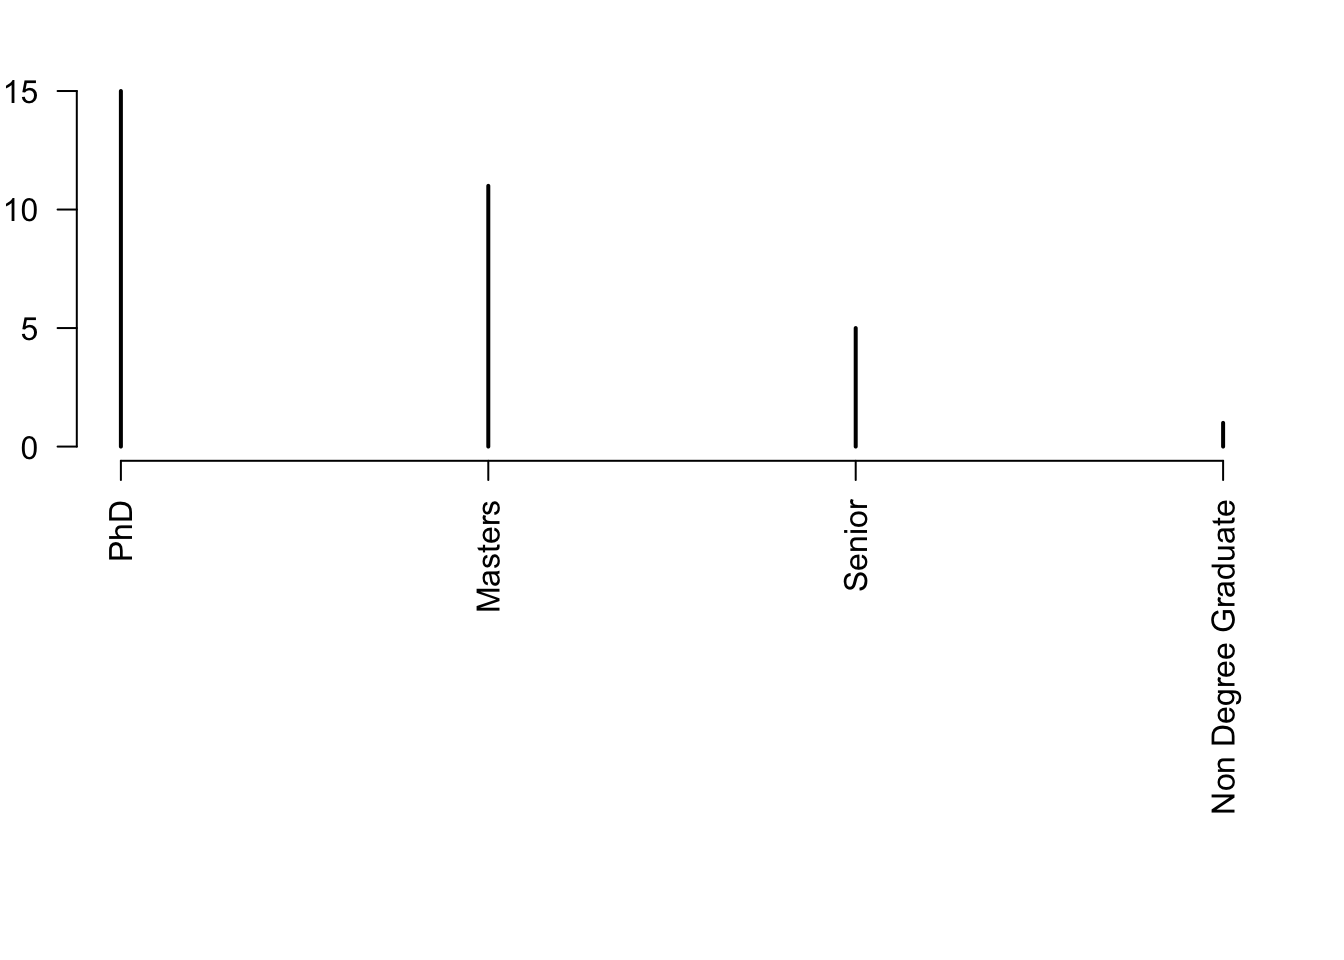
1.3 Intro to Bayesian statistical modelling
Example: my retirement
- Personal information
- Obviously this isn’t my actual information, but it isn’t too far off!
- Since I am a millennial I don’t think social security will be around when I retire (i.e., assume social security contributes $0 to my retirement)
- As of 1/1/23 I have $100,000 in 401k retirement in accounts
- All of money is invested into an S&P 500 index fund (VOO to be exact)
- I am 35 as of 1/1/23
- I want to know how much pre-tax money I will have at a given retirement age (e.g., 65, 70, etc)
- Example using a mathematical model
- Whiteboard demonstration
- What are the model assumptions?
- In program R
# The value of my 401k retirement account as of 1/1/23
y_2023 <- 100000


# How much money will I add to my 401k each year
q <- 20000


# Rate of return for S&P 500 index fund
r <- 0.12


# How much $ will I have in 2024
y_2024 <- y_2023*(1+r)+q
y_2024
## [1] 132000# How much $ will I have in 2025 y_2025 <- y_2024*(1+r)+q y_2025## [1] 167840# How much $ will I have in 2026 y_2026 <- y_2025*(1+r)+q y_2026## [1] 207980.8# Using a for loop to calculate how much $ will I have year <- seq(2023,2023+30,by=1) y <- matrix(,length(year),1) rownames(y) <- year y[1,1] <- 100000 for(t in 1:30){ y[t+1,1] <- y[t,1]*(1+r)+q } plot(year,y/10^6,typ="b",pch=20,col="deepskyblue",xlab="Year",ylab="Pretax retirement amount ($ millions)")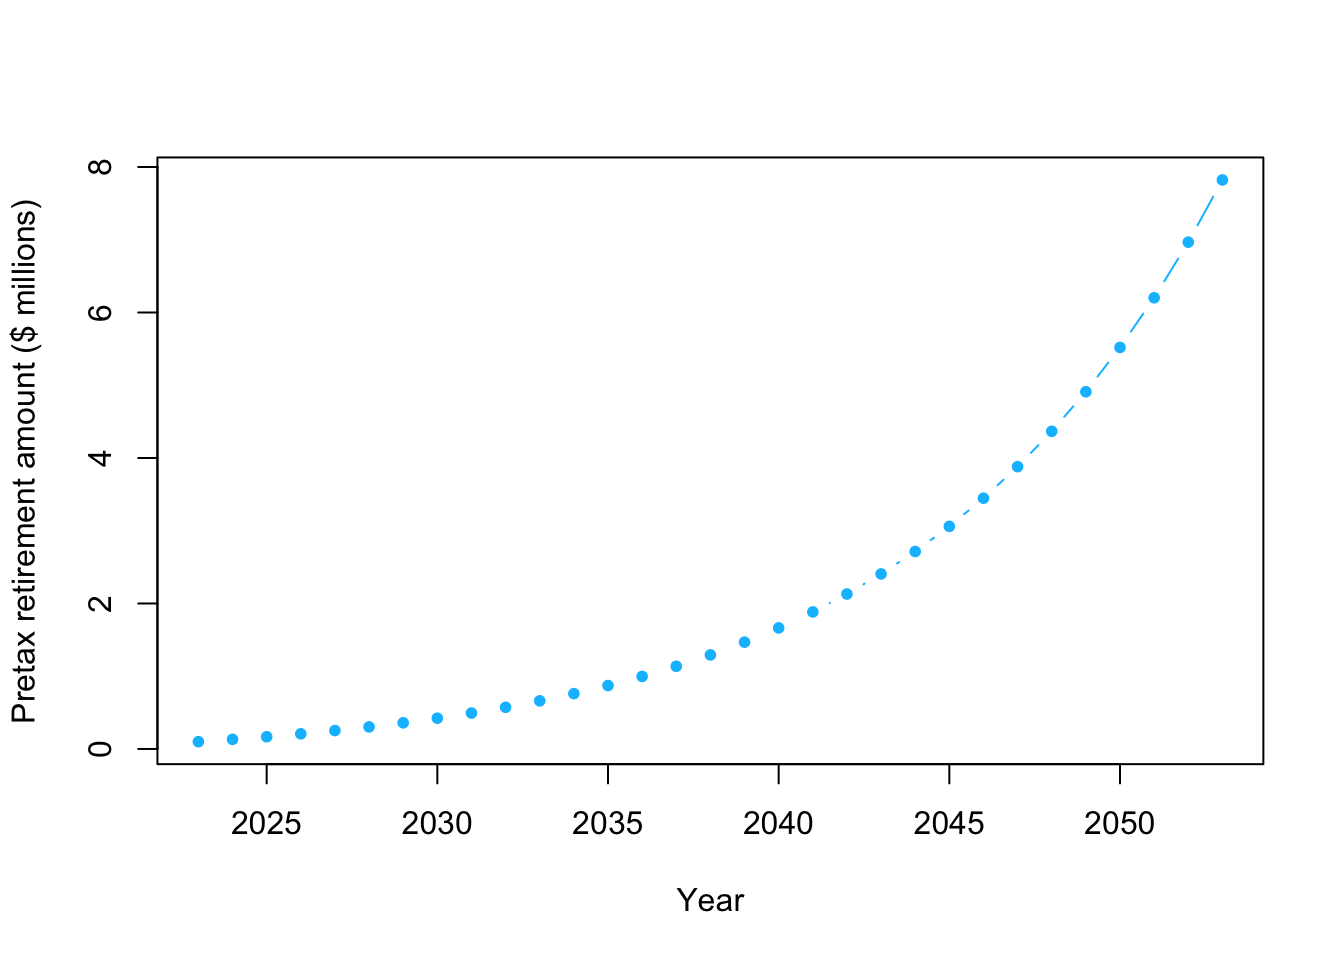
# How much $ will I have when I am 65?
# Note that units are millions of $
retirement.year <- 2023+30
y[which(year==retirement.year)]/10^6
## [1] 7.822646- Personal information