Data Visualization for Conservation
7 - 20 July 2021
Session 1 Welcome
Welcome to the Data Visualization for Conservation course!
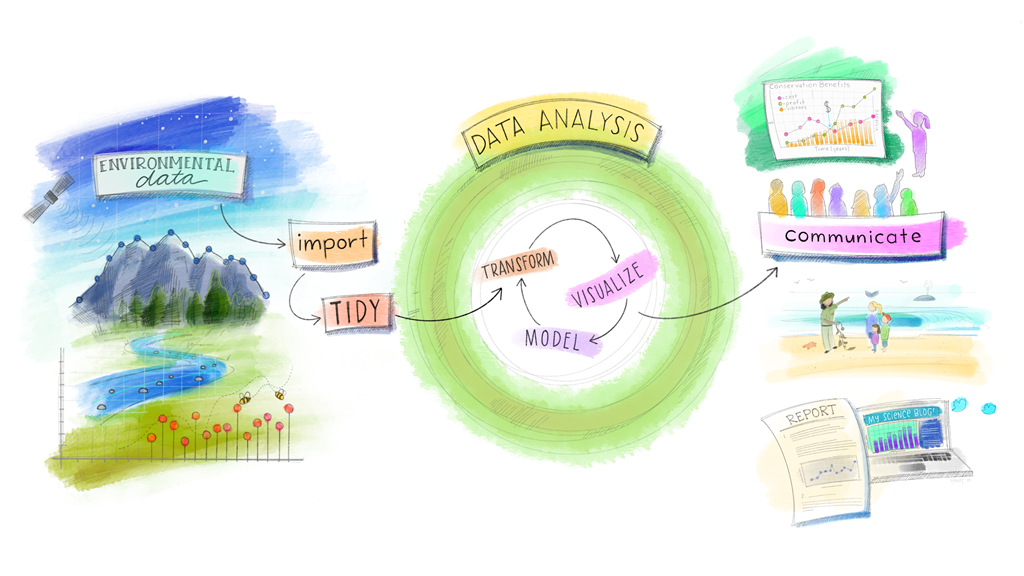
(Artwork by Allison Horst)
In this course we are going to be talking about data visualisation or ‘dataviz.’ We will spend time talking about the importance of data visualisation, learning how to produce custom visualisations using the ggplot2 package, as well as an important theory of data management and storage.
The path of learning is never-ending, and we do not want you to imagine that this course can teach you everything you might want to know. The purpose of this course is to give conservation practitioners and researchers a solid foundation in one of the most important communication tools around.
This is not a series of lectures - the course is meant to be interactive! If you have questions, please ask us. You can ask any questions in the Zoom chat, but the best method of ensuring follow-up is to ask them via the “DVfC” Discord server. The Discord server is a permanent record of our discussions regarding the course, and you can refer back to it at any time.
If you have technological issues that are preventing you from joining the Zoom call, or using RStudio or whatever, please let us know so that we can try to help. All sessions will be recorded, which means that you will be able to view the session/discussion even if you are unable to attend at the live session time for any reason.
1.1 Experience with R
This course is aimed a graduate-level students or conservation professionals who need to produce data visualisations in the course of their research or work. Ideally you some basic experience with R, which might include performing tasks like:
- importing data,
- cleaning data,
- analysing data,
- plotting your data.
Don’t worry if you are not very familiar with these processes, they will be explained and demonstrated as needed during the course. Any experience with data visualisation tools from other software e.g., Excel, ArcGIS etc., is useful because you will likely have already encountered many of the issues/situations that we will cover in this course.
This course will show you how to manage your entire ‘workflow’ inside R. Using R for your data processing, analysis and visualisation is a great habit to get into because it will make your research reproducible by others (but more importantly - by yourself!)
1.2 Software/R Packages:
1.2.1 R and RStudio
An installation of R for your operating system.
- I am using R 4.0.5 “Shake and Throw” but any installation after R 3.6 should work without a problem.
-
- RStudio’s Integrated Development Environment (IDE) is an invaluable tool for streamlining the data processing and analysis workflows that we will be using in this course.
- Using an IDE during your work is much easier than the RGui which accompanies the standard R installation (I used the RGui for 8 years before switching to an IDE and I regret not switching sooner!)
- There are other good IDEs for R that might suit your needs better and you are welcome to use them, but please note that I will be unable to help you with issues that may arise from using different software as my experience is with RStudio.
1.2.2 The Tidyverse
Within R, we use functions to perform actions that we could code ourselves, but no longer want to or need to because someone else has already built a function for us.
For this course, one of the sets of packages that you need to install is known as the Tidyverse. The Tidyverse consists of eight packages, including the two most important packages we will use in this course i.e., ggplot2 and dplyr. All packages will be explained as needed during the course. If you’re curious, you can find additional information at tidyverse.org.
To install the Tidyverse package set, run the following code from your R command line: (Note: You can copy all code in a code chunk (the grey boxes) by clicking on the page icon at the top right of each chunk. To see the icon, place your mouse cursor over the code chunk you are interested in.)
install.packages("tidyverse")1.2.3 The here package
I also recommend that you install the here package.
install.packages("here")The here package allows R users to share code easily. Essentially, the here package replaces every instance of setwd("C:/My Directory/That Has/My Data") that you might need to use in your code or script.
The primary benefit of the here package allows me to write code on my machine, that will work on your machine even if the full, specific filepath on our computers is different.
To use the here package in your DVC_2021 directory, open your DVC_2021 project in RStudio and run this code:
# Load the package into R
library(here)
In my RStudio Console I see the following message:
here() starts at C:/Users/gavin/r-projects/DVC_2021
The filepath printed in your console will be different but that doesn’t matter. Using the here function we can specify relative filepaths throughout this course as long as your folder has the same structure as the original folder used to produce the code. Run the following code:
here("data/reptiles.csv")What you will see is the full filepath of your root project directory with /data/reptiles.csv appended at the end. When I run the code above I see the following output in the Console:
"C:/Users/gavin/r-projects/DVC_2021/data/reptiles.csv"
If I want to use this function to import the reptile.csv dataset, I use the code above instead of the filepath.
library(tidyverse, quietly = TRUE)
read_csv(here("data/reptiles.csv"))
You should see a table printout of a data frame containing columns of variables and rows of observations.
If you don’t, please let me know so that I can help you solve the issue.
I highly recommend using the here package if you collaborate on analyses in R with your co-authors and you want to share your code with them and have it work with minimal fuss.
1.3 Let’s Go!
We are so glad that you will be joining us for this adventure! We hope that you enjoy the course and that you learn the skills you hope to learn (and more)!
Adventure time!