Chapter 7 The Gini index
The Gini index is a measure used to assess the extent to which income or wealth is concentrated within a group.
7.1 Graphical interpretation
The graphical interpretation of the Gini index is based on the Lorenz curve. The Lorenz curve plots the cumulative share of individual observations (sorted from lowest to highest income or wealth) against the cumulative share of total income or wealth held by those observations.
Figure 7.1: Example Lorenz curve (blue) of a group of 4 persons with incomes 1, 3, 10, and 20
The diagonal line (y = x) represents perfect equality, where each percentage of the observations holds exactly that same percentage of total income. The Gini index is calculated as the ratio of the area between the Lorenz curve and the diagonal line to the total area under the diagonal (which equals 0.5).
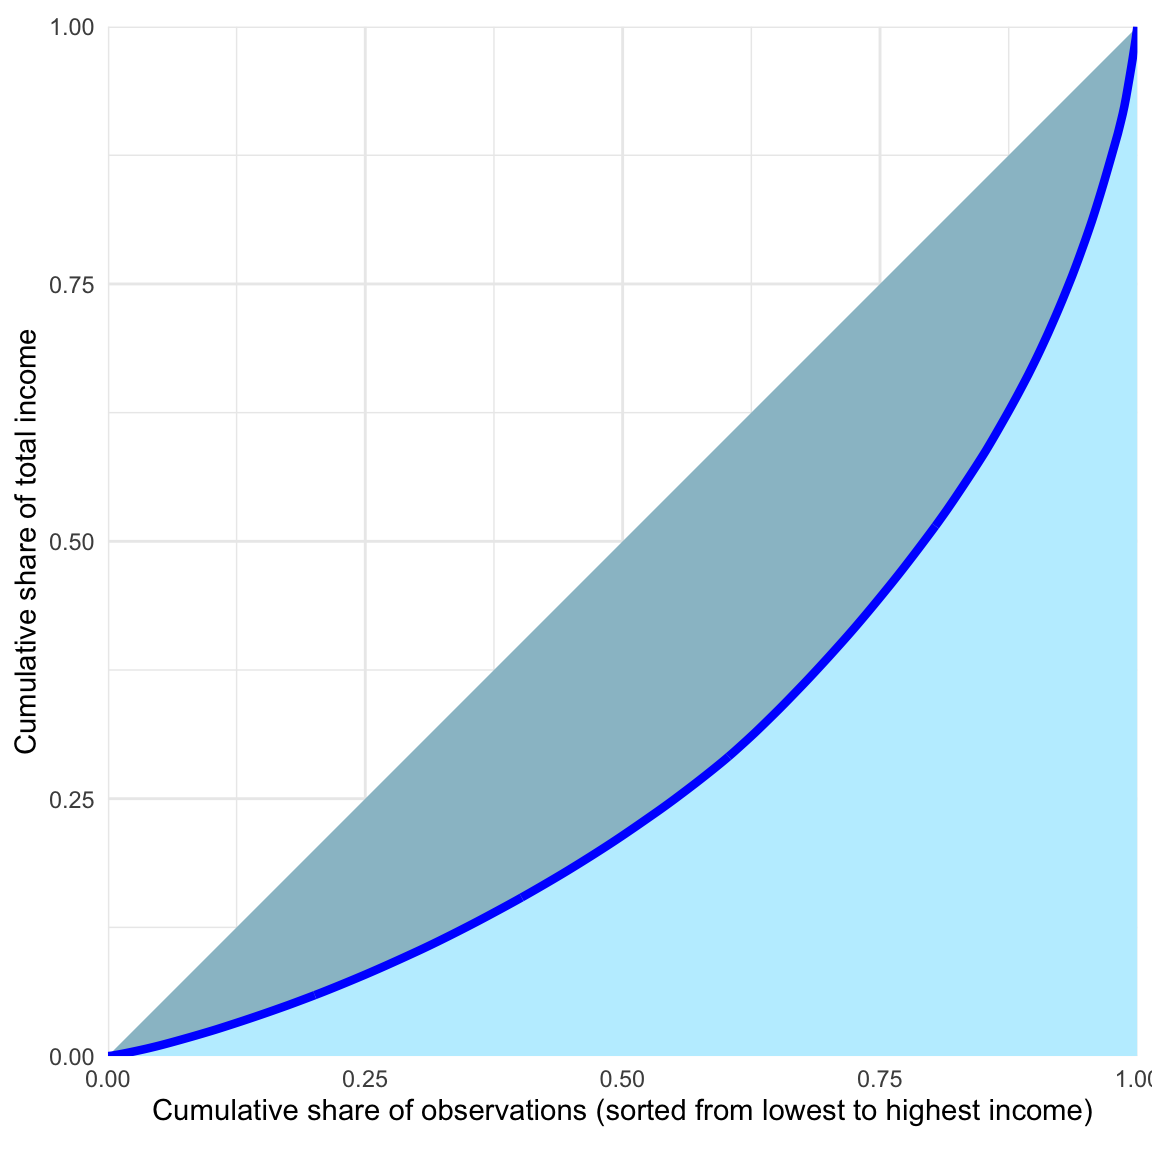
Figure 7.2: The Gini index is the ratio of the darker region to the total area of the blue triangle (the thick blue line is the Lorenz curve)
7.2 Formula
When individual-level data is available and sorted in ascending order by income, the Gini index can be calculated using the following formula:
\[\begin{equation} G = {\frac {\sum _{i=1}^{n}(2i-n-1)x_{(i)}}{{n^{2}}{\overline {x}}}}, \tag{7.1} \end{equation}\]
where
\(n\) is the total number of observations,
\(i\) is the index of the observations taking values from 1 do \(n\),
\(\overline{x}\) is the mean of the variable \(X\) of interest (eg. income or wealth),
\(x_{(i)}\) is the value for the \(i\)-th observation (np. \(i\)-th individual, \(i\)-th household) when sorted in the ascending order.
The Gini index ranges from 0 to 1. The index is zero when the variable is the same for all observations (e.g., everyone earns exactly the same income). The index approaches 1 when the distribution approaches maximal concentration, for example when one individual holds all the wealth while the wealth of others is 0.
For context, the Gini index for Poland is approximately 0.27, indicating moderate income inequality.