12.1 WDI
World Devevlopment Indicators(WDI)是世界银行提供的公开、高质量数据库。指标首先按照领域分类,除了一般常见的统计数据外,还包括农业、气候、贫穷、健康方面的数据。
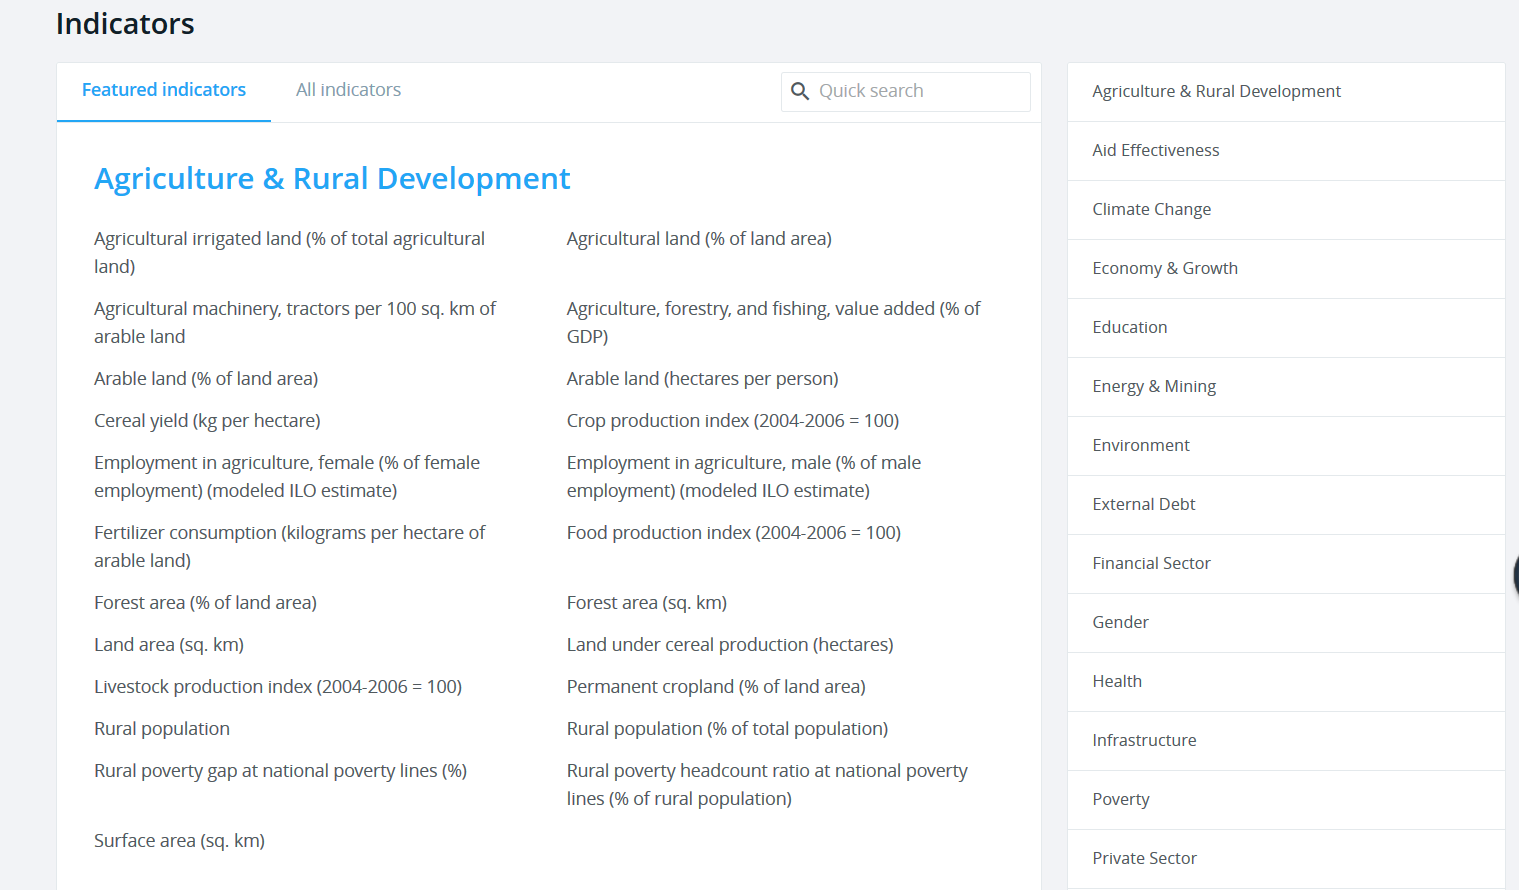
Figure 12.1: Indicators divided by sectors
具体到某领域内,每个数据集都是各个国家在某个指标上的时间序列,时效性一般在两年之内。下面是气候变化分类中电力覆盖率指标(Access to electricity)的一个例子:

数据库中包含了超过 1600 个这样的时间序列,很多有效跨度超过了 50 年。WDI(Arel-Bundock 2019) 包提供了在 WDI 数据库中搜索、提取、格式化信息的接口。
12.1.1 WDIsearch()
WDIserach() 用于在 WDI 数据库中搜索可用的指标,是之后用 WDI() 提取相关数据的基础。
string = "gdp": 用于搜索的正则表达式
field= “name”: 搜索域,可选 “indicator”(编码)、“name”(名称)、“discription”(详细描述)、“sourceDatabase” 和 “sourceOrganization” (来源数据库或组织)
short = TRUE:WDIsearch()默认只返回匹配指标的编码和名称,short = FSLE同时返回详细描述和来源
如在名称域内中搜索与二氧化碳相关的指标:
# the result of WDIsearch() is a 2D matrix
WDIsearch("CO2", short = F) %>%
  as_tibble()
#> # A tibble: 45 x 5
#>   indicator   name       description       sourceDatabase  sourceOrganization
#>   <chr>       <chr>      <chr>             <chr>           <chr>
#> 1 EN.ATM.CO2~ "CO2 emis~ "Carbon dioxide ~ World Developm~ "Carbon Dioxide Info~
#> 2 EN.ATM.CO2~ "CO2 emis~ "Carbon dioxide ~ World Developm~ "Carbon Dioxide Info~
#> 3 EN.ATM.CO2~ "CO2 emis~ "Carbon dioxide ~ World Developm~ "Carbon Dioxide Info~
#> 4 EN.ATM.CO2~ "CO2 emis~ "Carbon dioxide ~ World Developm~ "Carbon Dioxide Info~
#> 5 EN.ATM.CO2~ "CO2 emis~ "Carbon dioxide ~ World Developm~ "Carbon Dioxide Info~
#> 6 EN.ATM.CO2~ "CO2 emis~ ""                WDI Database A~ ""
#> # ... with 39 more rows
改变搜索域:
WDIsearch(string = "mortality", field = "description", short = F) %>%
  as_tibble()
#> # A tibble: 383 x 5
#>   indicator  name         description      sourceDatabase  sourceOrganization
#>   <chr>      <chr>        <chr>            <chr>           <chr>
#> 1 5.51.01.0~ Maternal he~ Births attended~ Statistical Ca~ World Development In~
#> 2 5.51.01.0~ Immunization The proportion ~ Statistical Ca~ World Development In~
#> 3 5.51.01.0~ Child morta~ Under-five mort~ Statistical Ca~ World Development In~
#> 4 PRJ.POP.1~ Wittgenstei~ Total populatio~ Education Stat~ Wittgenstein Centre ~
#> 5 PRJ.POP.1~ Wittgenstei~ Total populatio~ Education Stat~ Wittgenstein Centre ~
#> 6 PRJ.POP.1~ Wittgenstei~ Total populatio~ Education Stat~ Wittgenstein Centre ~
#> # ... with 377 more rows
WDIsearch() 中的正则表达式背后用 base R 中的 grep() 实现,所以无视大小写。
搜索人均不变价 GDP :
WDIsearch(string = 'gdp.*capita.*constant') %>%
  as_tibble()
#> # A tibble: 5 x 2
#>   indicator            name
#>   <chr>                <chr>
#> 1 6.0.GDPpc_constant   "GDP per capita, PPP (constant 2011 international $) "
#> 2 NY.GDP.PCAP.PP.KD.87 "GDP per capita, PPP (constant 1987 international $)"
#> 3 NY.GDP.PCAP.PP.KD    "GDP per capita, PPP (constant 2011 international $)"
#> 4 NY.GDP.PCAP.KN       "GDP per capita (constant LCU)"
#> 5 NY.GDP.PCAP.KD       "GDP per capita (constant 2010 US$)"
12.1.2 WDI
WDIsearch() 得到了指标的编码之后,就可以用 WDI() 下载相关数据:
WDI(country = "all", indicator = "NY.GNS.ICTR.GN.ZS", start = NULL,
end = NULL, extra = FALSE, cache = NULL)country: 筛选国家或地区。使用 “ISO 3166-1” 两位字母编码,具体可见mapdata::iso3166。(中国 CN, 美国 US,德国 DE,日本 JP,英国 GB)indicator: 指标的编码。具名向量可以在重命名该指标
start和end:时间序列的起始和结束。默认为 1950 年和今年
extra = FALSE: 若extra = RTUE,返回首都经纬度、地区、收入水平等更多信息
WDI(indicator = "5.51.01.03.mortal", country = c("US", "CN"),
    start = 2005,
    end = 2015) %>%
  as_tibble()
#> # A tibble: 11 x 4
#>   iso2c country `5.51.01.03.mortal`  year
#>   <chr> <chr>                 <dbl> <int>
#> 1 CN    China                     1  2015
#> 2 CN    China                     1  2014
#> 3 CN    China                     1  2013
#> 4 CN    China                     1  2012
#> 5 CN    China                     1  2011
#> 6 CN    China                     1  2010
#> # ... with 5 more rows

# renaming and extra = TRUE
WDI(indicator = c(child_motality = "5.51.01.03.mortal"),  country = c("US", "CN"),
    start = 2005,
    end = 2015,
    extra = TRUE) %>%
  as_tibble()
#> # A tibble: 11 x 11
#>   iso2c country child_motality  year iso3c region capital longitude latitude
#>   <chr> <chr>            <dbl> <int> <fct> <fct>  <fct>   <fct>     <fct>
#> 1 CN    China                1  2015 CHN   East ~ Beijing 116.286   40.0495
#> 2 CN    China                1  2014 CHN   East ~ Beijing 116.286   40.0495
#> 3 CN    China                1  2013 CHN   East ~ Beijing 116.286   40.0495
#> 4 CN    China                1  2012 CHN   East ~ Beijing 116.286   40.0495
#> 5 CN    China                1  2011 CHN   East ~ Beijing 116.286   40.0495
#> 6 CN    China                1  2010 CHN   East ~ Beijing 116.286   40.0495
#> # ... with 5 more rows, and 2 more variables: income <fct>, lending <fct>