PSY-401017 R Workshop
2023-03-15
1 Week 1: Introduction to the Workshops
1.1 Overview
Welcome to module PSY-40107, “Enhancing Reproducibility in Research”. This workbook will support the weekly workshops where you will learn how to do basic reproducible analysis. For this, we will learn how to use the statistical programming language R together with R markdown, which allows you to embed your data, analysis code, and narrative text into a nicely formatted—and, more importantly, reproducible!—report. In fact, this book is written using R markdown!
This online workbook will form the basis of your learning throughout the 12 weeks of the module. There is one chapter per week which outlines some reading you are required to do that week. We will then meet as a group in the weekly workshop where you will be provided with some exercises to do which applies your understanding from your weekly reading. It is therefore important that you do the required reading before the workshop!
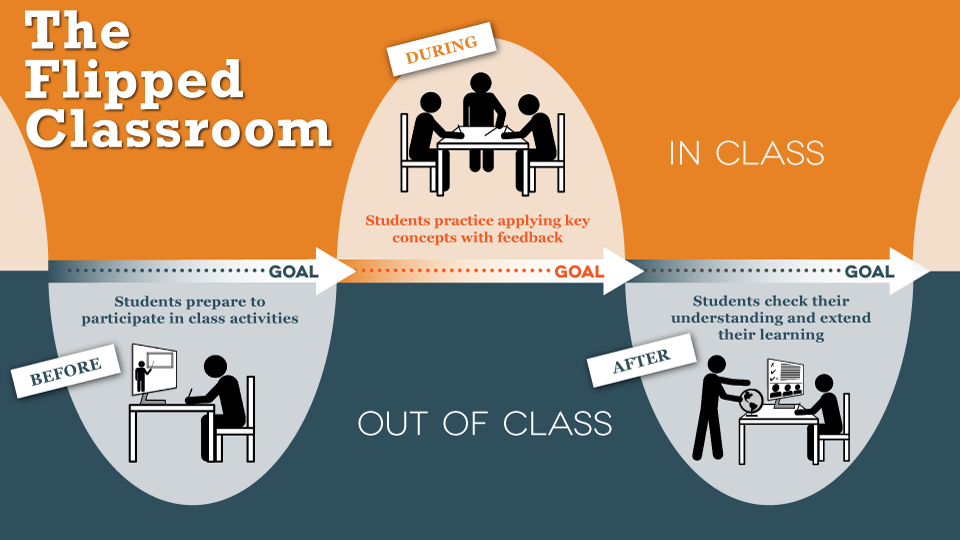
This type of structure—where you learn in your independent study time, and then use class time to apply your learning—is known as a “flipped classroom”. Learning to program is primarily an active process. It’s not something that can be learned by listening to a lecture alone; you have to get your hands dirty with some real data and some real problems for it to sink in. Therefore I want to use our previous class time together to actively work through exercises so I can be available to answer questions you have when you get stuck.
1.1.1 Course textbook
R is an open-source statistical programming language and has a fantastic community keen on sharing materials and supporting each other. As such there is a wealth of free resources available online to help us on our R learning journey.
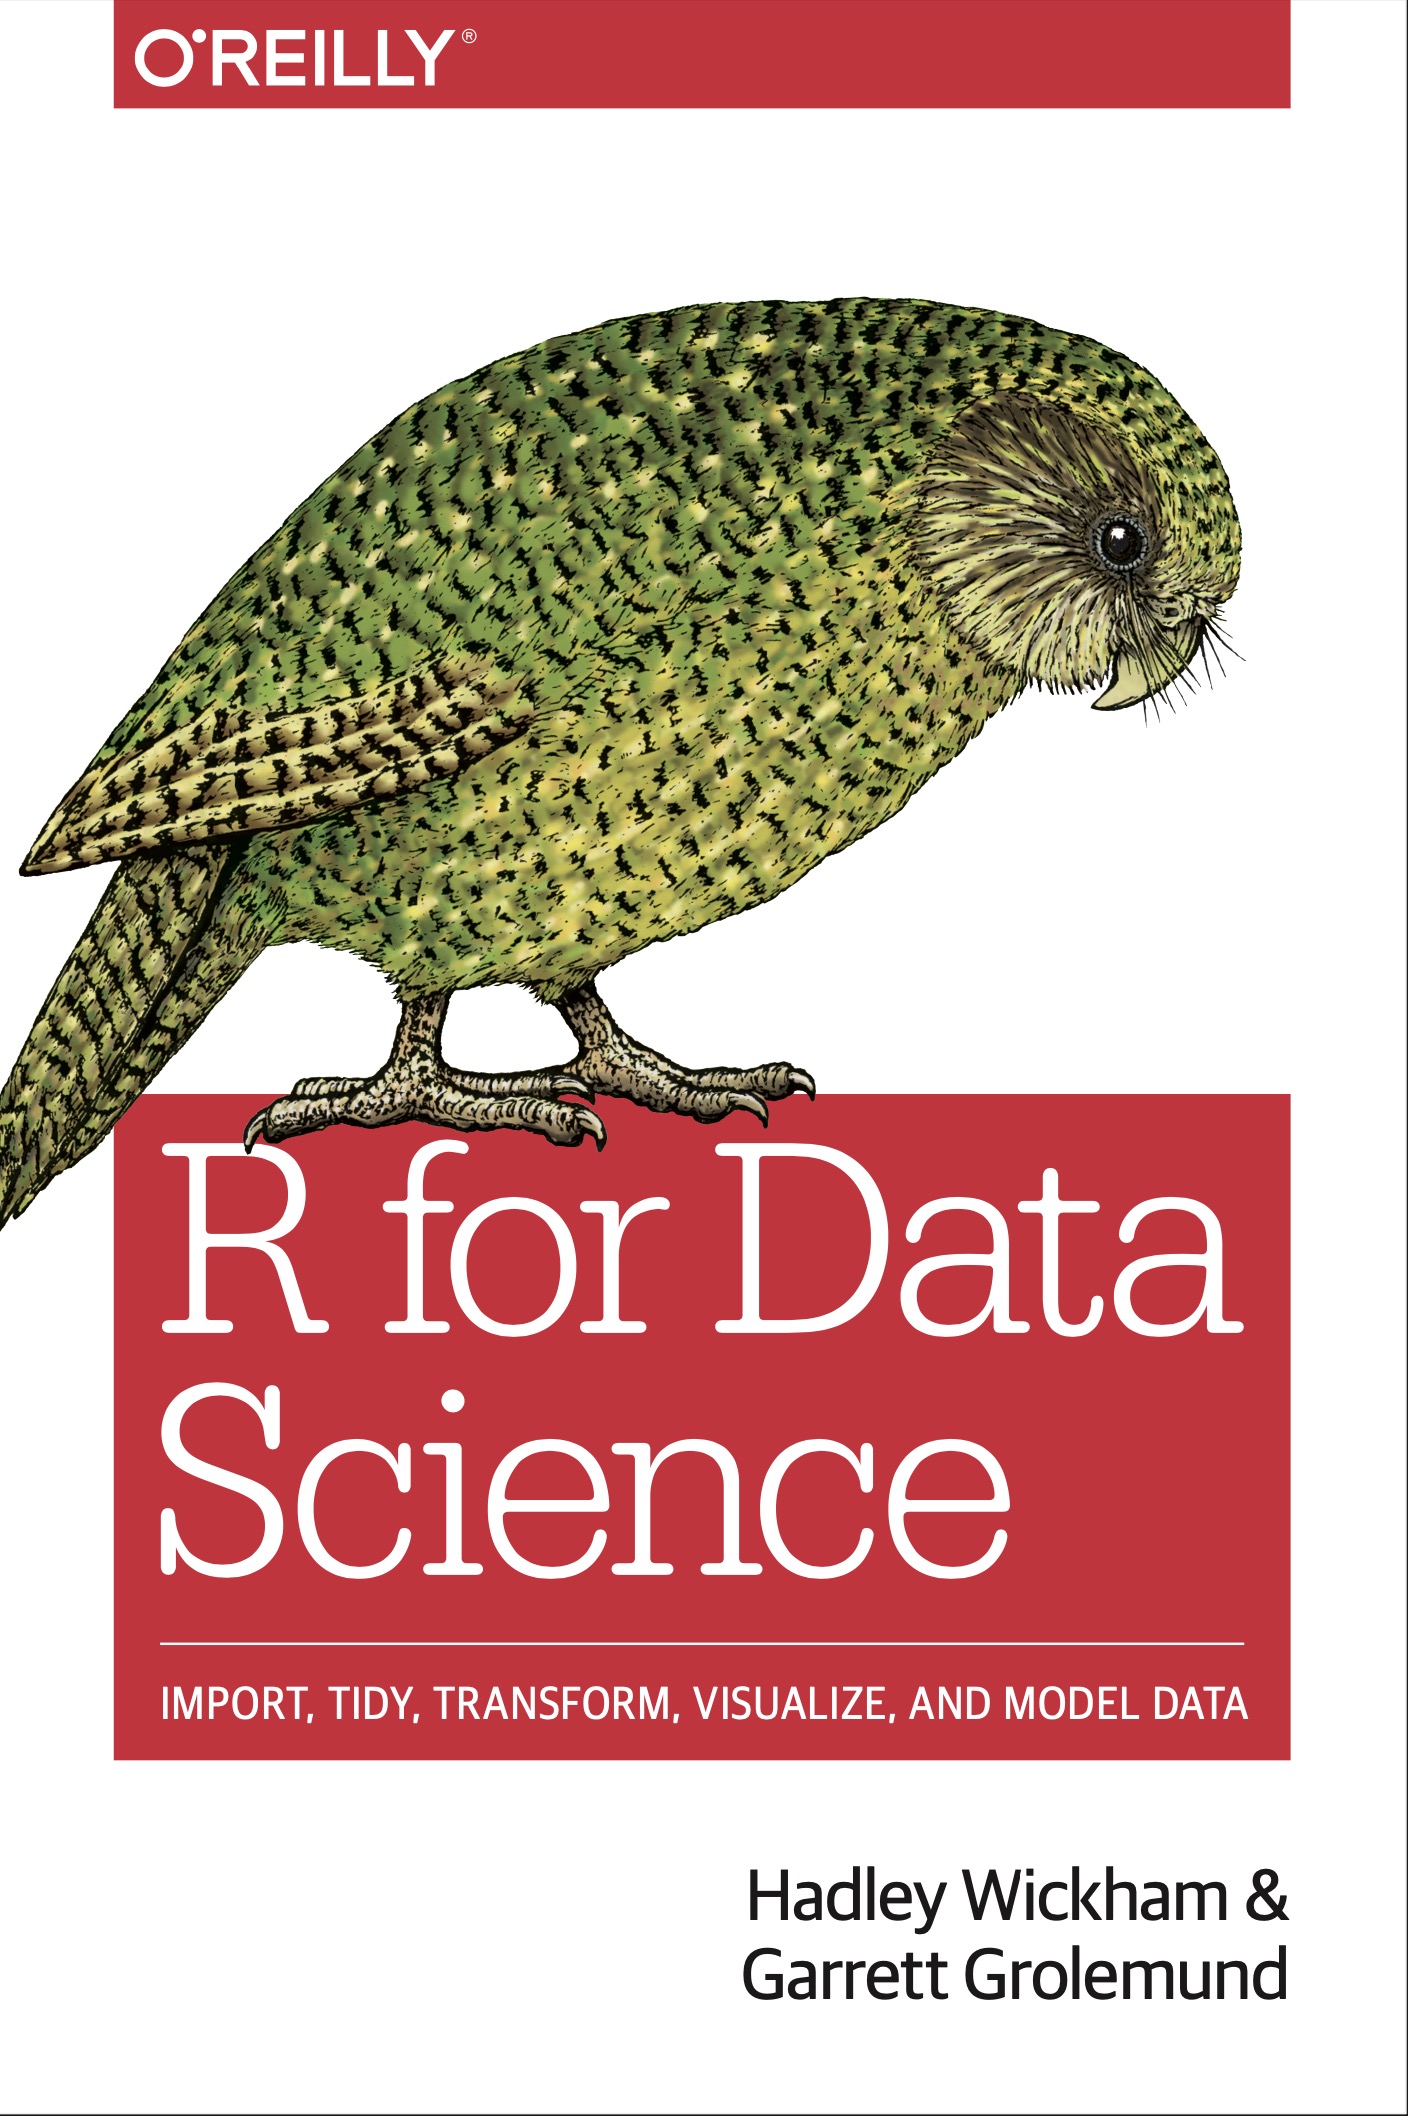
Whilst the workbook you are currently reading provides some original material, we are going to lean heavily on R for Data Science by Hadley Wickham which can be freely accessed here. As the name implies, this book is aimed at those interested in pursuing data science, but serves as an excellent introduction to the best features of R. It is written by Hadley Wickham who is something of a god in the R universe.
We won’t, however, be using all of the R for Data Science book (which, hereafter, I shall refer to as R4DS). Each week I will assign certain chapters, and some weeks I may only assign sections of a chapter (with the rest perhaps being too advanced or not relevant for this module). At other times, I will write some of my own material which will be included in the relevant chapter in the workbook you are now reading.
1.1.2 Are we learning statistics?
As already mentioned, R is primarily a statistical programming language. As such, it can be used to conduct all of the standard statistical tests you have learned so far on your undergraduate and postgraduate journey. However, this course is primarily not a statistics course. Therefore, I will only show you some relatively basic tests and leave the more advanced tests for you to explore on your own.
1.1.3 Callouts
Throughout this workbook, I will add some “callouts” that draws your attention to certain aspects that I think require elaboration:
These sections provide a WARNING to help you avoid common traps and/or errors when learning/using R.
These sections provide TIPS. Learning R can be a frustrating endeavour at times, so I will provide some top-secret tips along the way to help smooth the journey.
These sections provide ADVANCED concepts. (Like rocket science. Hence the rocket…). We are only scratching the surface of what you can do in R in these workshops, so along the way I will from time to time point out some advanced concepts to whet your appetite to explore things further. These are not essential for the module.
These sections prompt you to THINK about something. At times I won’t initally provide all the information you need to do a certain task in R. These sections will encourage you to engage actively with a problem before seeing the solution.
These sections provide FURTHER-READING for you to explore things a little further if you so wish. Again, these are unlikely to be essential readings.
1.1.4 Getting help in Teams
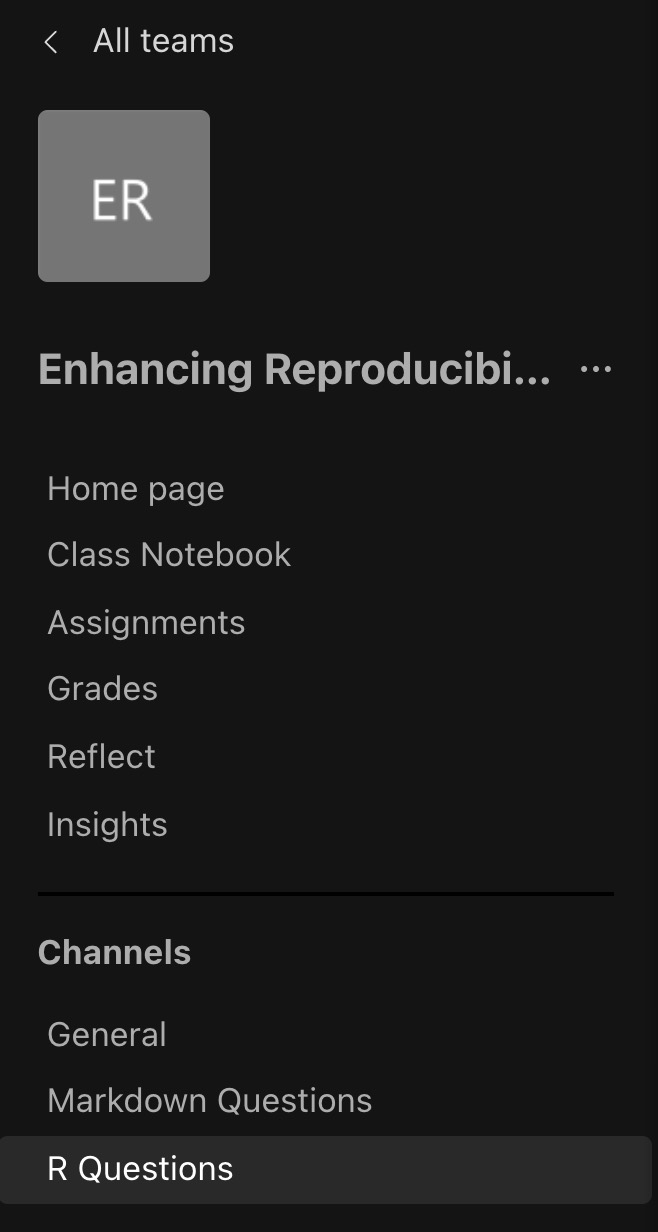
I encourage you to all help each other out in your learning of conducting reproducible analysis in R. As I said, learning R can be frustrating at times. Therefore I have set up a shared space in the MS-Team for this module where you can ask questions. There is channel for questions about R, and another channel for questions about markdown. Please post your questions to the relevant channel.
Teams works best if all members of the group contribute; that is, if you see someone needing some help or has a question, feel free to help each other out. Remember that collaboration is the foundation of good research practice, so model this by helping your colleagues. I of course will be a frequent responder in the Teams channels, but I do have the expectation that everyone helps each other out.
In a similar vein, please do not be shy about asking questions in front of other students in the module. I understand that everyone is nervous about asking a potentially silly question, or looking like they don’t know something, but please don’t worry about this! I often get stuck with many things. This is normal.
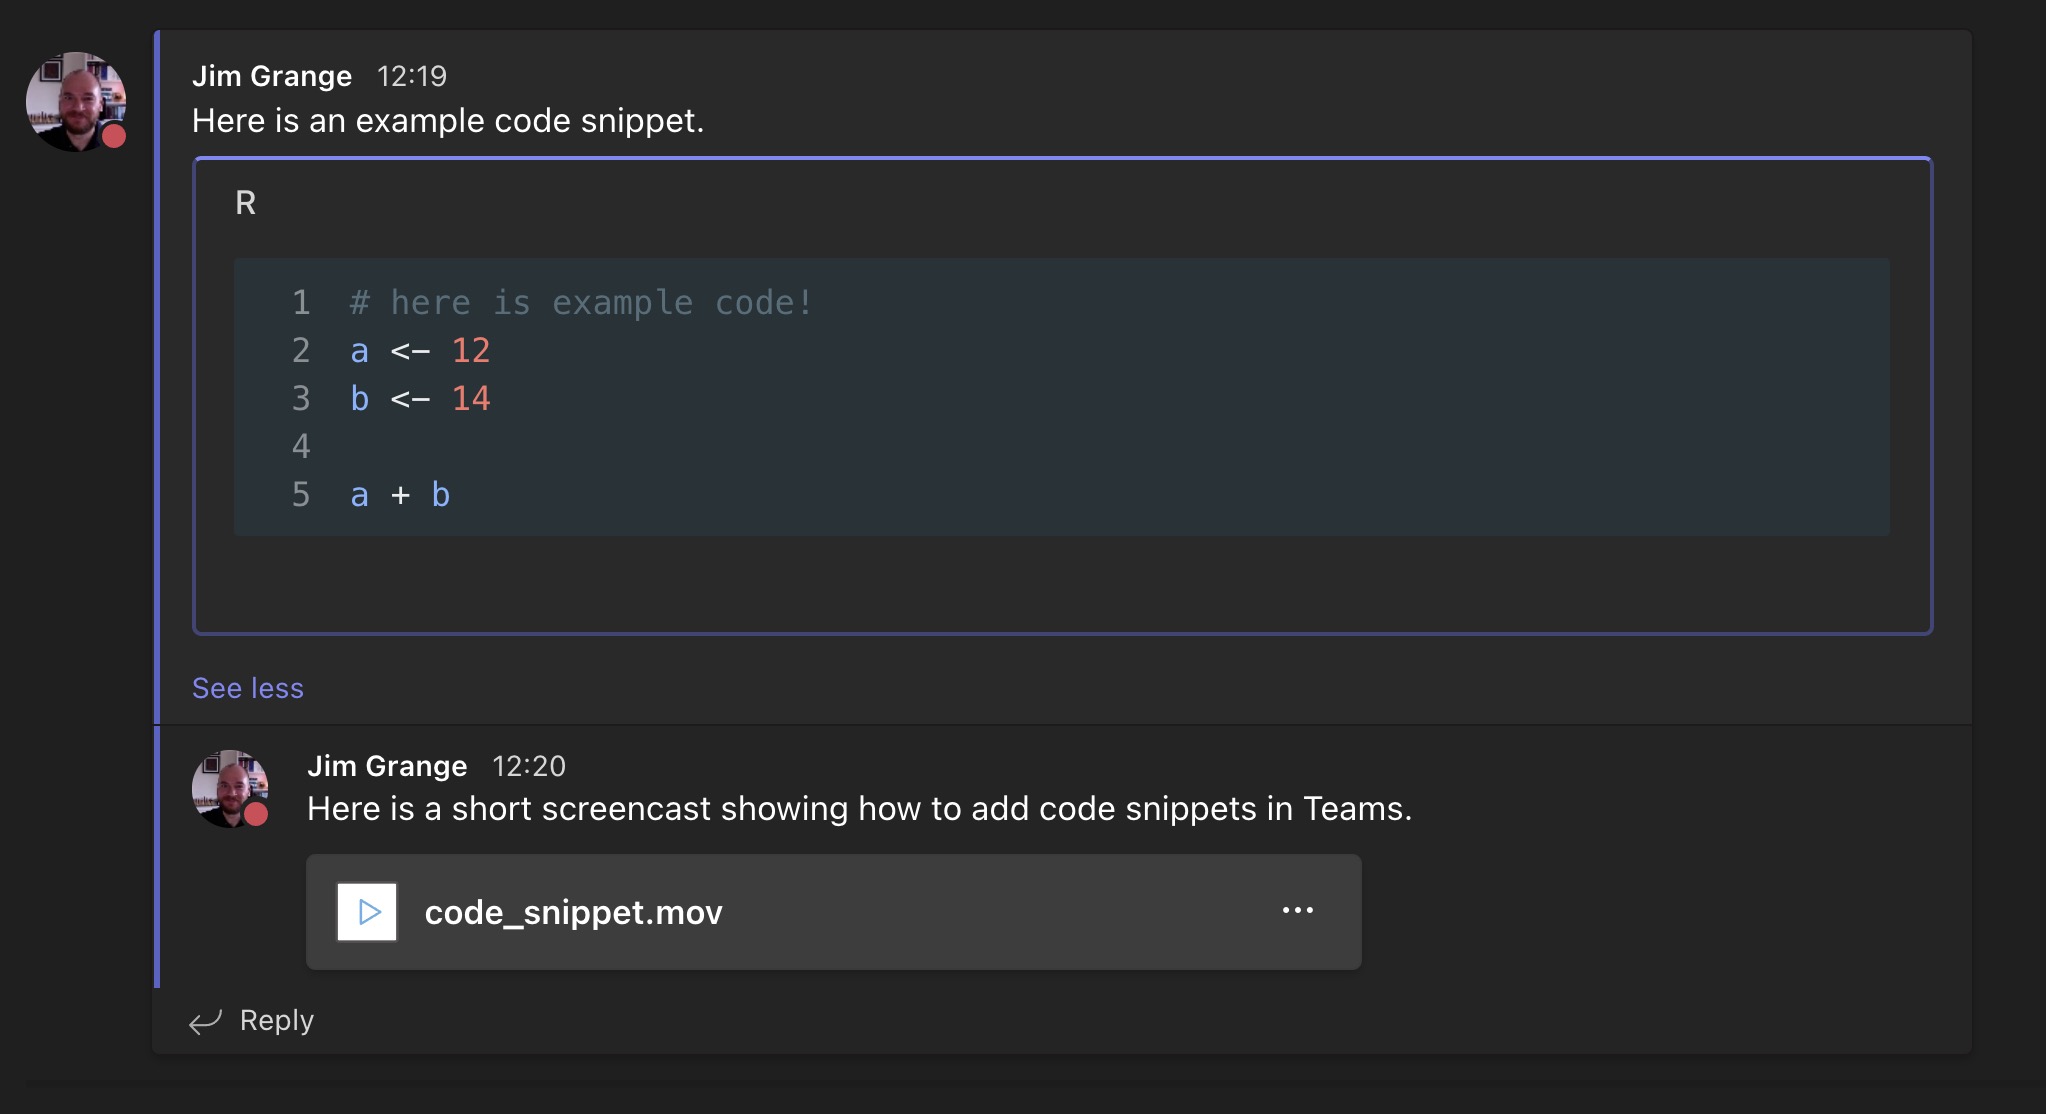
When you post a question, it will help if you also provide the code you are struggling with. Teams is excellent by allowing you to type in properly formatted R code into the channel. Below is an example code snippet in Team, and in the Teams channel you can find a short screencast showing you how to enter formatted R code into the Teams channel.
1.2 Prerequisites for week 1
As this is your first week we will ease into things gently by getting an overview of the R4DS book as well as download all of the necessary software.
The R4DS book—and this module—provides you with essential data science skills, broadly defined. The book provides one of my favourite diagrams of what’s involved in any significant data analysis project:
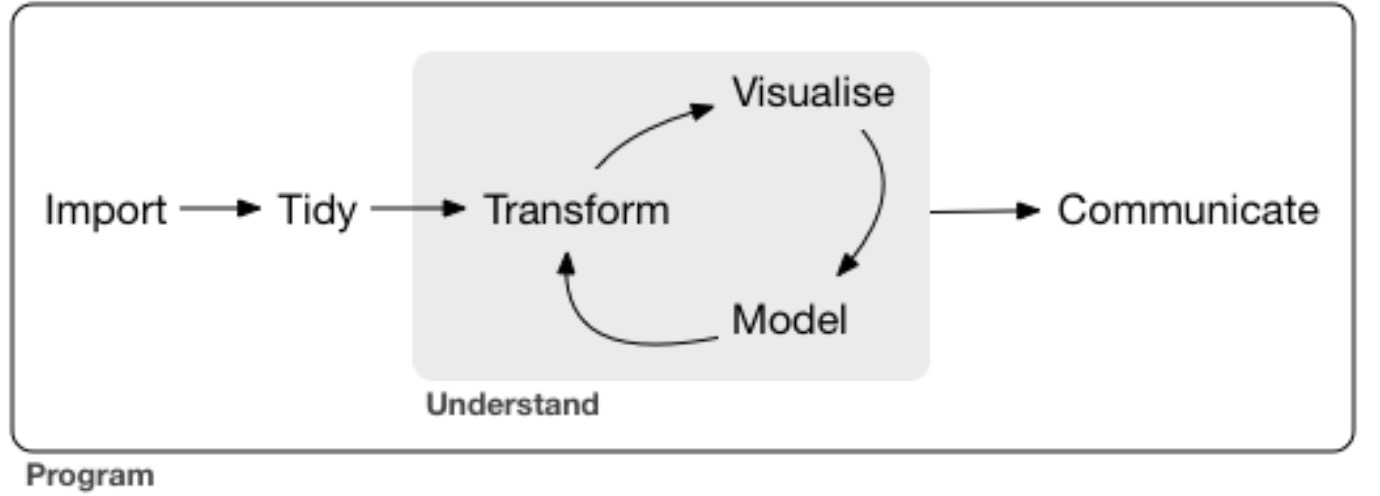
Figure 1.1: The flow of a significant data analysis project.
It’s one of my favourite diagrams because it is brutally honest about where most of our time as researchers is spent when analysing data. Much of our time is actually spent tidying the data (removing unnecessary variables etc.) and trying to get the data into the right format ready for analysis. Running the analysis—the model element in the Figure—is often a single line of code in R, but getting the data ready for analysis can sometimes be tens (or hundreds!) of lines of code.
Data analysis in the wild is hard for the reason that data are often very messy. Your main job as an analyst is to deal with this mess.
That you must get your data imported, tidied, and transformed provides further impetus to use a reproducible analysis process (such as using R) so you—or another researcher—can retrace your footsteps to verify you have done everything accurately. If you do all of your data trimming and transformation in “point & click” software (e.g., Excel), no trace will be left of what steps you took making verification impossible.
1.2.1 Installing R & R Studio
The reading for this week guides you through installing the required software for this module. Specifically, you will be downloading R and R Studio; both are available for Windows, Mac, and Linux operating systems.
Typically, new users get confused between R and R Studio:
- R is the programming language itself that runs computations based on your instructions. It’s the engine.
- R Studio is a user-friendly interface to R providing additional tools and features which makes using R easier. It’s how we interact with engine.
Once both are downloaded, you will only ever need to open R Studio. You won’t ever need to open R itself because you will be accessing it via R Studio.
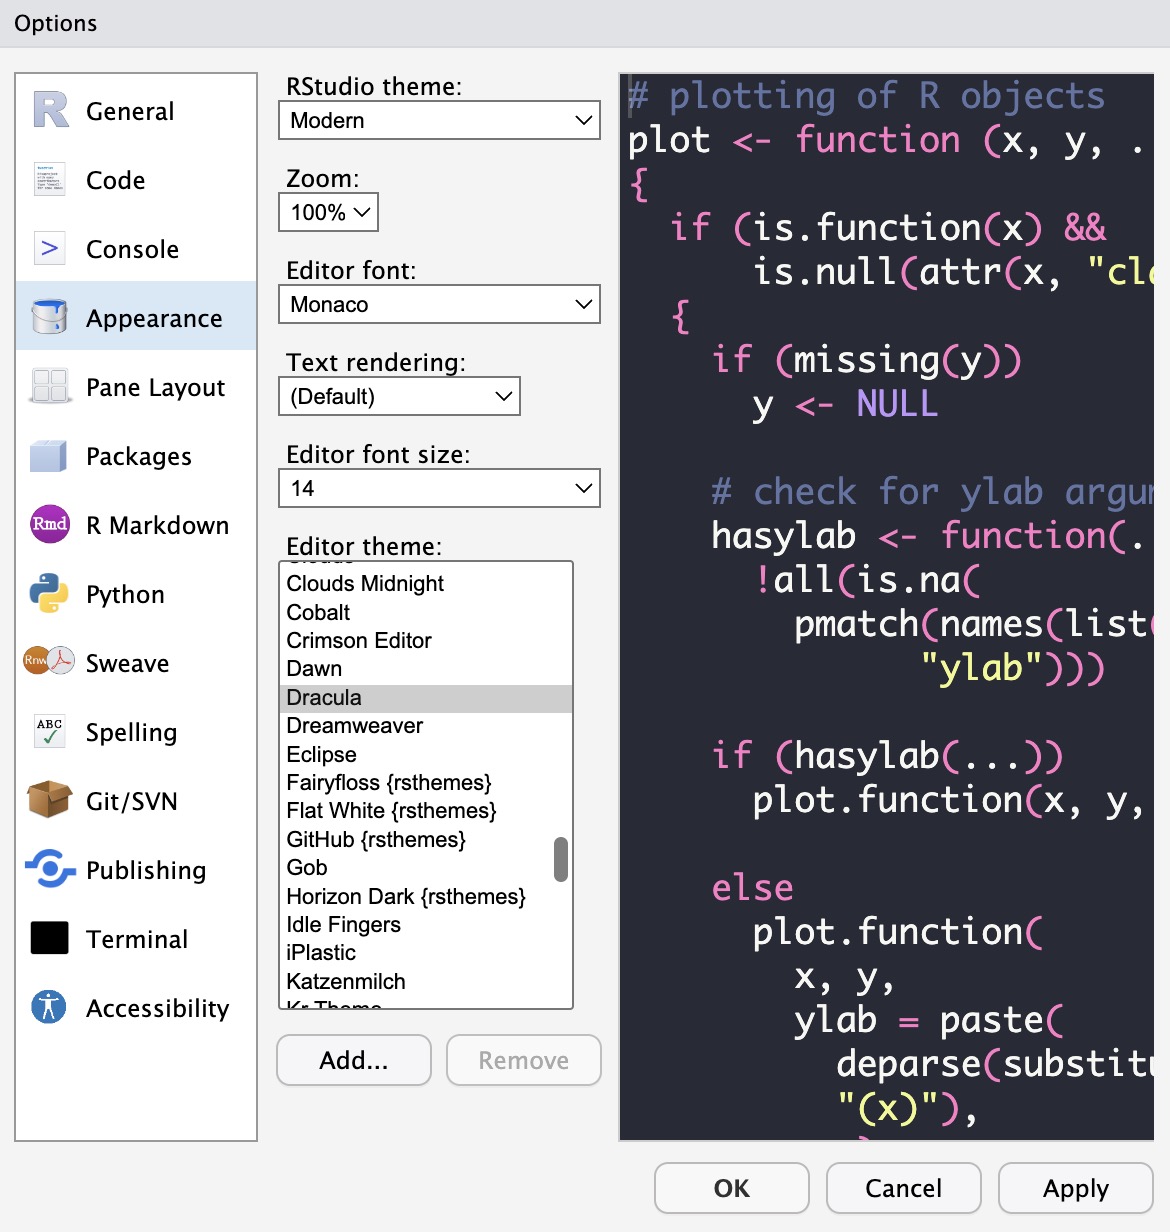
ADVANCED. You can customise the appearance of R Studio to your heart’s content. To do so, in the R Studio menu bar go to Tools – Global Options – Appearance. In the image below you can see the settings I use. (I am huge fan of using Dark Mode on all software I use, and the Dracula theme is delightful.)
1.2.2 Packages
The assigned R4DS chapter for this week also introduces another source of confusion for new R users: Packages. R itself is an incredibly powerful system, but researchers have extended its functioning by creating new packages that extend what R can do.
Think of packages like “apps” on a smartphone: They are discrete tools for performing specific tasks.
Unlike smartphone apps, all packages in R are free to download. You can download packages by typing install.packages("NAME") into the console, where “NAME” refers to the package you want to install.
The majority of our work on this module will use the tidyverse package (also authored by Hadley Wickham…I told you he was a god!) which provides many data analysis and visualisation tools. The tidyverse is a bundled package of several individual packages that each deal with unique elements of the data analysis flow shown in Figure 1.1.
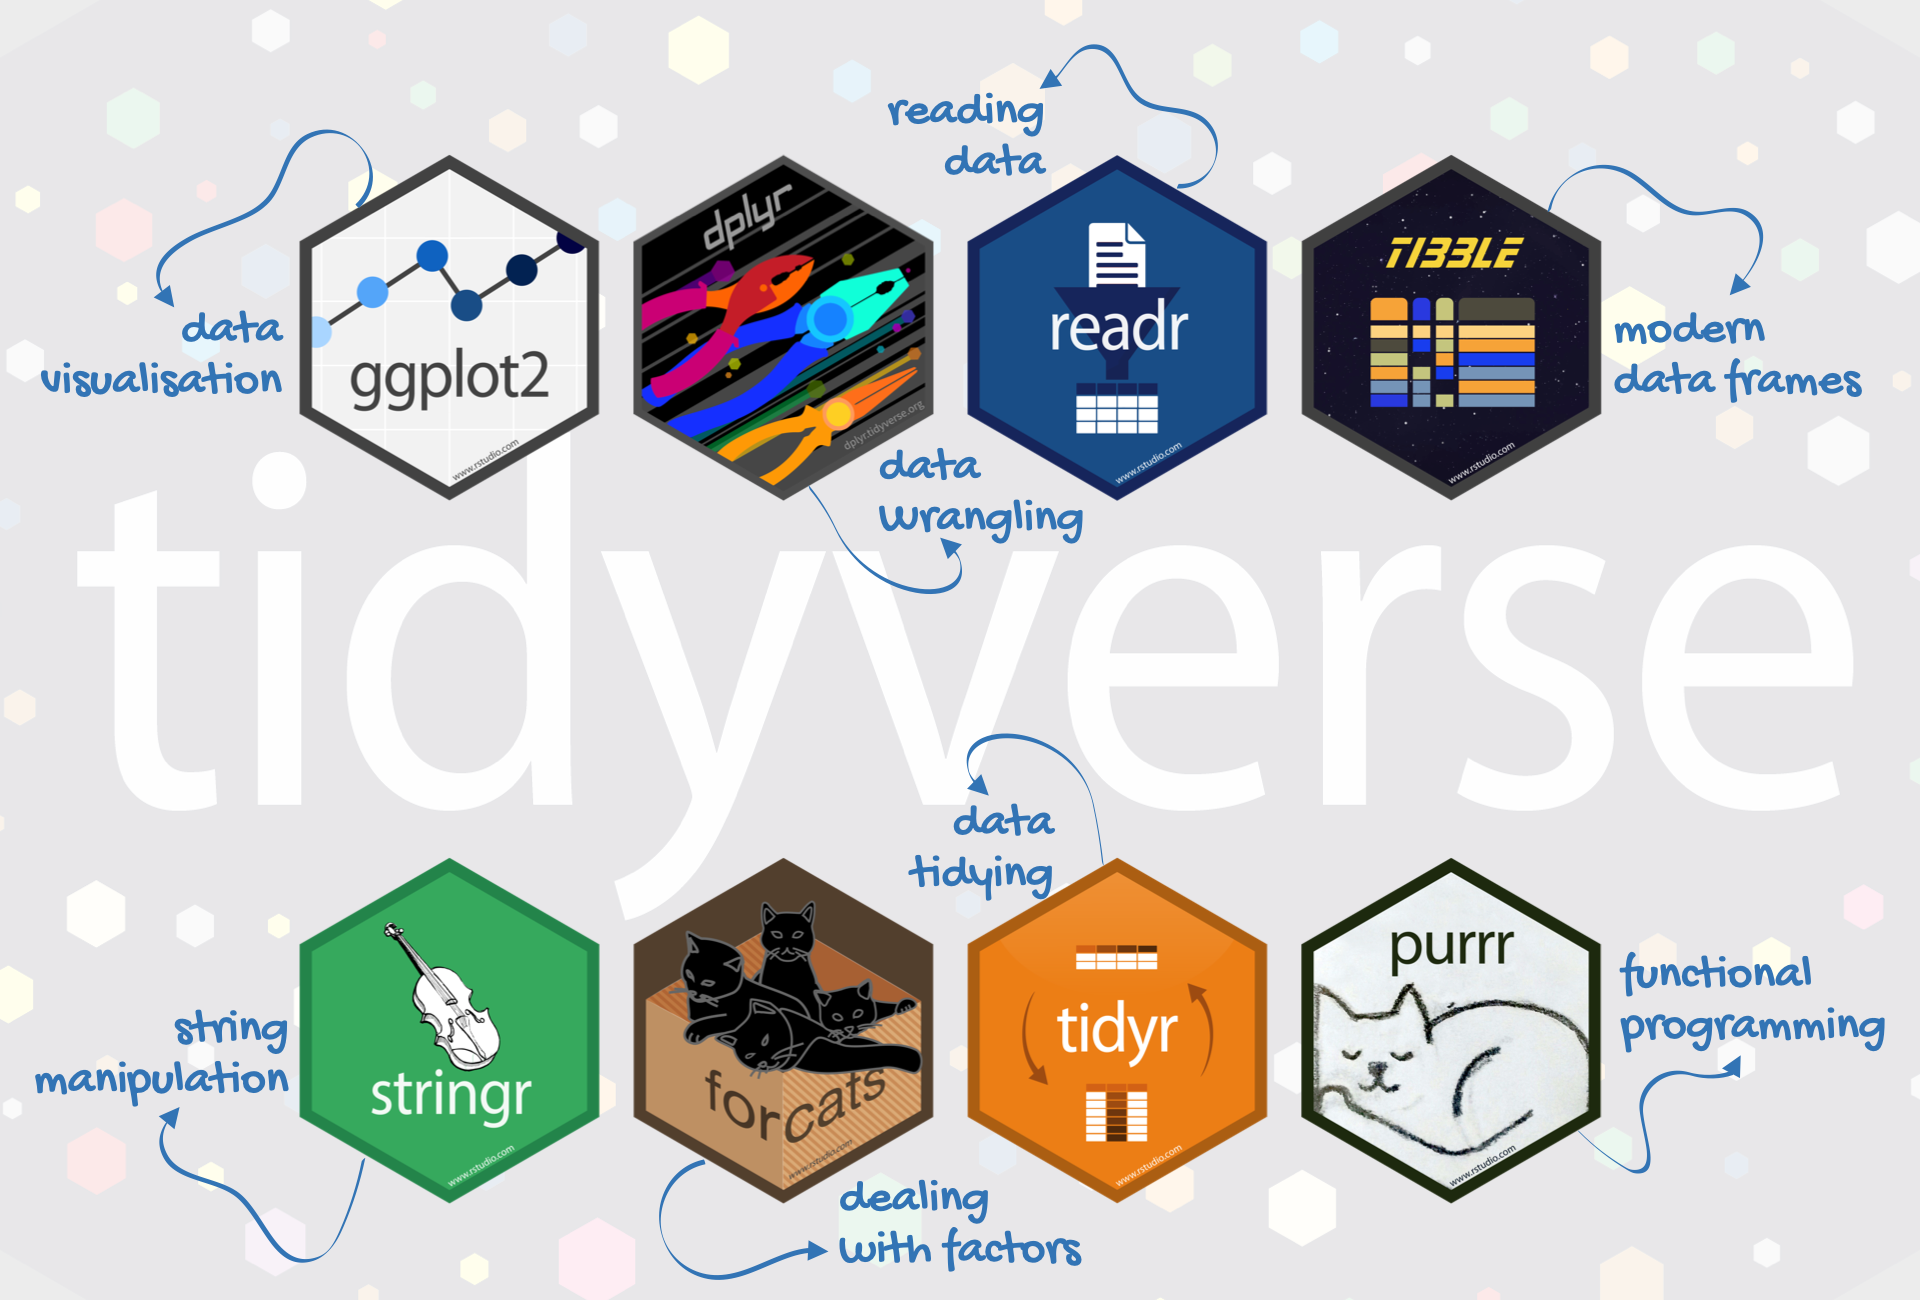
Figure 1.2: The packages of the tidyverse!
Here’s how to install it:
install.packages("tidyverse")Once you’ve installed a package, you need to “activate” it in your session via:
library(tidyverse)The R4DS chapter walks you through installing and using packages in R, but I wanted to clarify these things before you read the chapter to minimise confusion.
1.3 Reading
- All of Chapters 1 & 2 of R4DS.
- This provides an overview of the book and walks you through how to download R and R Studio.
- It shows you how to install the tidyverse and other packages.
- It briefly introduces how to enter R code into the R Studio console. You will be doing more of this next week!
THINK. The R4DS book is exclusively about exploratory data analysis. Therefore it does not cover confirmatory data analysis; that is, no formal statistical tests are covered. Later in the module I will show you how to do some simple statistical tests in R but much will be left unsaid.
What are some of the advantages and disadvantages of focussing exclusively on exploratory data analysis, as proposed by the R for Data Science book?