Graded Task in R (II)
For this task, we’ll again work with a text corpus already included in the R-Package Quanteda-Corpora-Package. For simplicity, I have already downloaded the corpus (with some minor specifications). You can find the corresponding R file in OLAT (via: Materials / Data for R) with the name immigration_news.rda.
These files are news articles from the UK reporting on the topic of immigration from 2014. The data is in a similar format as you would get if you read their text with the readtext package.
Source of the data set: Nulty, P. & Poletti, M. (2014). “The Immigration Issue in the UK in the 2014 EU Elections: Text Mining the Public Debate.” Presentation at LSE Text Mining Conference 2014. Accessed via the quanteda corpus package.
load("immigration_news.rda")Graded Task 2.1
Writing the corresponding R code, create a new variable called words in the data frame data, which contains the number of words each article includes. What is the average number of words each article includes across the whole corpus?
Important: Please do not count the number of words yourself. Each article already contains a string pattern indicating the number of words at the beginning of each text (e.g., the first text contains the string pattern “933 words”). Thus, you simply need to extract this string.
The data frame should then look something like this:
str(data)## 'data.frame': 2833 obs. of 3 variables:
## $ doc_id: chr "text1" "text2" "text3" "text4" ...
## $ text : chr "support for ukip continues to grow in the labour heartlands and miliband should be scared\nby leo mckinstry \"| __truncated__ " \nnews\n30 lawless migrants try to reach uk each night\ngiles sheldrick \n402 words\n14 april 2014\nthe dai"| __truncated__ " \nnews\n30 lawless migrants try to reach uk each night\ngiles sheldrick \n610 words\n14 april 2014\nthe dai"| __truncated__ " \nnews\n£10m benefits scandal\nmartyn brown \n151 words\n14 april 2014\nthe daily express\ntheexp\n1 nation"| __truncated__ ...
## $ words : num 933 402 610 151 460 209 876 120 206 210 ...Graded Task 2.2
Writing the corresponding R code, create a new variable called headline in the data frame data, which contains the headline of each article.
Important: For simplicity, an article’s headline is here defined as any text before the word count in the article (we ignore the fact that this sometimes also includes the author’s name). Thus, you simply have to extract all text before the word count of the respective article.
Graded Task 2.3
Writing the corresponding R code, create a new variable called date in the data frame data. It should contain the year, month, and day each article was published.
Using this variable, please plot the amount of coverage across time. The final graph does not have to look exactly like the one you see below (in terms of colors or design, etc.).
What is important is that is that you somehow visualize how many articles were published on each day.
plot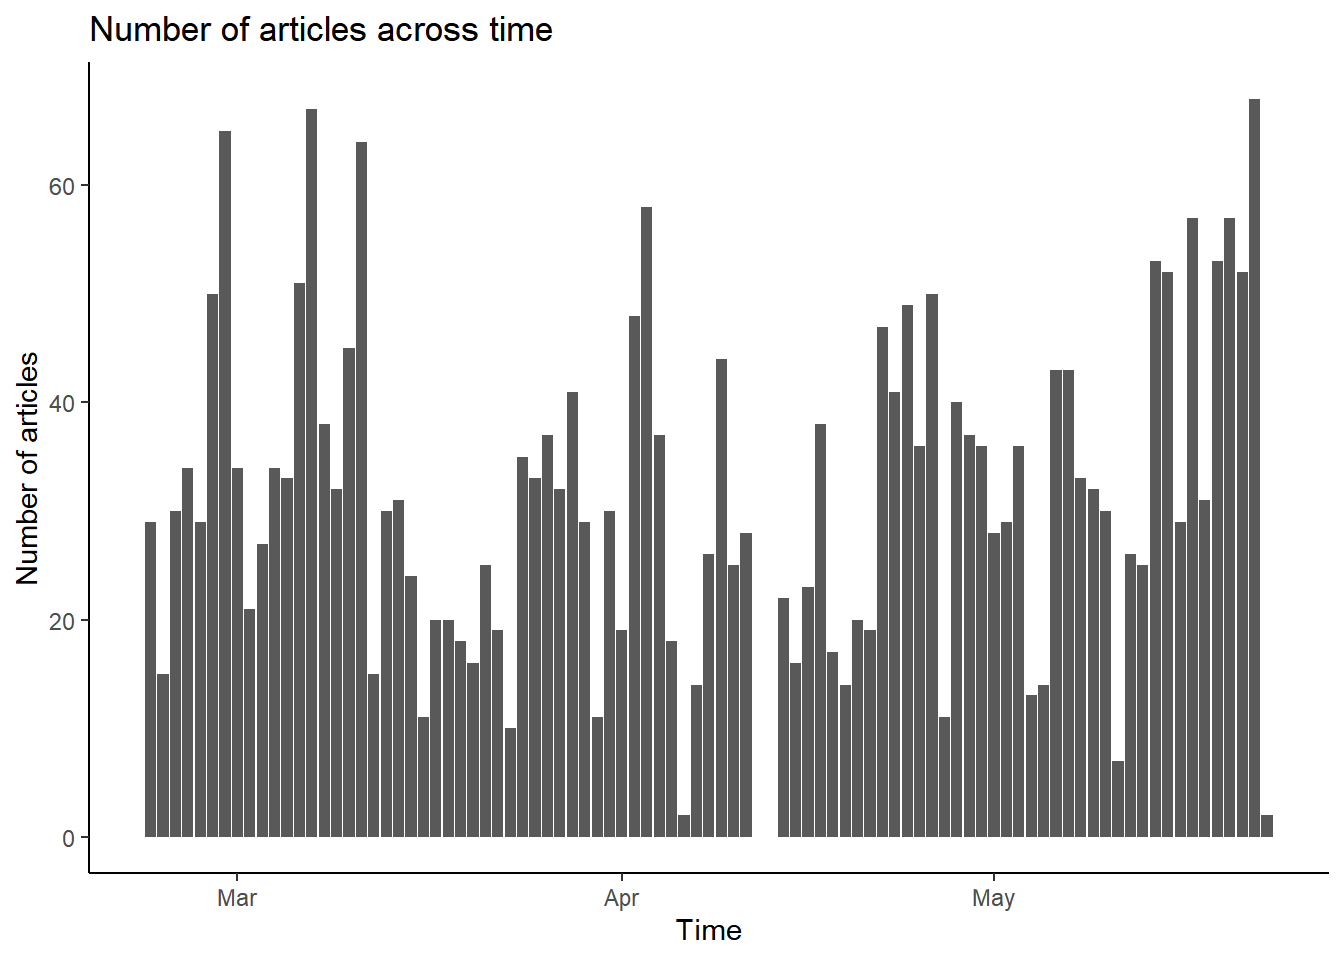
Graded Task 2.4
Writing the corresponding R code, please count how many articles by the newspaper The Daily Express as well as the newspaper The Financial Times the corpus contains (separately). The name of the outlet publishing each article is given in the article (see the beginning of each article) - again, you simply have to extract this information from the variable text in the data frame data.
Graded Task 2.5
Writing the corresponding R code and using the same corpus, please create a document_feature_matrix called dfm based on the full corpus. Which are the three most frequent features in your corpus?
Graded Task 2.6
Writing the corresponding R code, please count: How many texts contain both the words immigration and racism?