Chapter 2 Research Design
2.1 Check list for Week 2 (due by the first day of the third week)
please add a check mark or tick before each list item and post the listed items with check marks to the Discussion thread for Week 2.
() Form groups (2-3 students per group)
() Install Excel, R & Rstudio on your own laptop/PC
() In-class group discussions (non-graded/group work) - answer questions 1-10 listed in this module (see a coffee owner’s marketing research problem and a study on the relationship between advertising and sales) and post your responses to the Discussion Forum Class discussions often mirror the form of a tennis match between professor and students: each party plays an important role in facilitating the exchange of ideas and thoughts. That said, participating in class discussions is important to your success. Please participate in the in-class group discussion and post your responses to these questions to the discussion forum.
() Post your individual discussions and responses to your peers if you could not participate in the in-class group discussions.
() Use Hypothesis.is for social annotations and discussions (graded/individual work) - Basic Marketing Research -Chapter 3 - see the list of items under “annotations” below.
Work on Lab 1 (Bivariate analysis) and answer the questions. There will be an in-class demo during the second class of the 2nd week.
() Individual reflection (graded/individual work) - see the list of questions below.
Annotations - You will learn how to a) log into the group, b) highlight & annotate, c) identify high quality annotations, d)ask at least one question using the annotation tool (at least 10 words), and e) answer two questions raised by your peers.
Individual reflection questions (select two from the following list)
- As you reflect on this week’s work, which of the research design issues were you most aware of in your own learnings? Please describe your experience briefly.
- What research design strategies do you consider to be useful when it comes to helping your project client improve their marketing management?
- Which research design methods will you focus on as you begin our next project? Why?
- What insights would you expect as a result of employing the research design?
Important note: In case you could not participate in the in-class discussions, you would still be responsible for answering the in-class discussion questions. Before each Friday, all you have to do is to answer the in-class discussion questions individually and respond to your in-group peers’ original post regarding two of the issues you found to be interesting.
2.2 Introduction
How does our target market look like?
Why are other people not buying from us?
What does your ideal customer really want?
What is the size of our target market?
Is a website designed with a better landing page more likely to have a better conversion rate than an conventional one?
This list goes on and on.
It is questions like these that motivate people to study marketing, marketing research, and marketing analytics.
Research design is a plan that shows how (methods and data) and why (literature review and theory background) a researcher intends to study an empirical question.
2.3 Research Objectives & Limitations
- exploratory, descriptive, causal, or explanatory?
- A controlled experiment is “an experiment in which all factors are held constant except for one: the independent variable. A common type of controlled experiment compares a control group against an experimental group. All variables are identical between the two groups except for the factor being tested” (Thoughtco, 2019).
- True (or controlled) experiment - In a “true” experiment, the assignment is done randomly.
- Natural or Quasi-experiment - The term “quasi” refers to the situation where study units are not assigned to experimental groups randomly.
Practical limitations:
ethical considerations
lack of data, time, or money
bias
conformity bias is “the tendency people have to behave like those around them rather than using their own personal judgment.” Reference: Conformity Bias https://ethicsunwrapped.utexas.edu/glossary/conformity-bias#:~:text=The%20conformity%20bias%20is%20the,using%20their%20own%20personal%20judgment.
social desirability effect - Republicans are more reticent than Democrats and Independents to share their voting intentions in phone polls (Coy 2020)
-Errors
- Sampling error occurs "when a sample does not accurately represent the population" (Qualtrics, 2011).
- Other types of errors
How we collect data determines whose voice is heard.- tfaforms ## Figuring out causal relationships - Associative variation
Time sequence of events
Absence of other possible causal factors (confounding factors)
2.4 A cafe owner’s marketing research problem
A cafe owner doesn’t believe that his customers can taste the difference between diet and regular softdrinks. As a result, the cafe owner decides to conduct a study of his customers (Peter 2019). The first 6 questions are related to this hypothetical cafe owner’s marketing research problem.
2.4.1 In-class discussion questions
DQ1 - Two questions that the cafe owner is considering are given below. Which do you prefer, and why?
- Among my Wednesday customers, is the average customer-taste rating the same for diet and regular lemonade soft drinks?
- Among my Wednesday customers, is the percentage of customers who prefer diet lemonade soft drink the same as the percentage of customers who prefer regular lemonade soft drink?
DQ2 - Make some notes about how the cafe owner could answer the question using an observational study.
DQ3 -Make some notes about how the cafe owner could answer the question using an experimental study.
DQ4 -What would be the best type of experimental study: natural (true) or quasi? Why?
DQ5 -List some advantages and disadvantages of the experimental and observational studies. List some similarities and differences between the two studies.
DQ6 -Which do you think would be the better study? Why?
2.5 Bivariate Data Analysis
2.5.1 Objective
The objective of this tutorial is to explain how bivariate analysis works.This analysis can be used by marketers to make decisions about their pricing strategies, advertising strategies, and promotion stratgies among others.
Bivariate analysis is one of the simplest forms of statistical analysis. It is generally used to find out if there is a relationship between two sets of values (or two variables). That said, it usually involves the variables X and Y (statisticshowto.com).
- Univariate analysis is the analysis of one (“uni”) variable.
- Bivariate analysis is the analysis of exactly two variables.
- Multivariate analysis is the analysis of more than two variables.
2.5.2 Dataset - We will be using two online datasets available in R for this tutorial
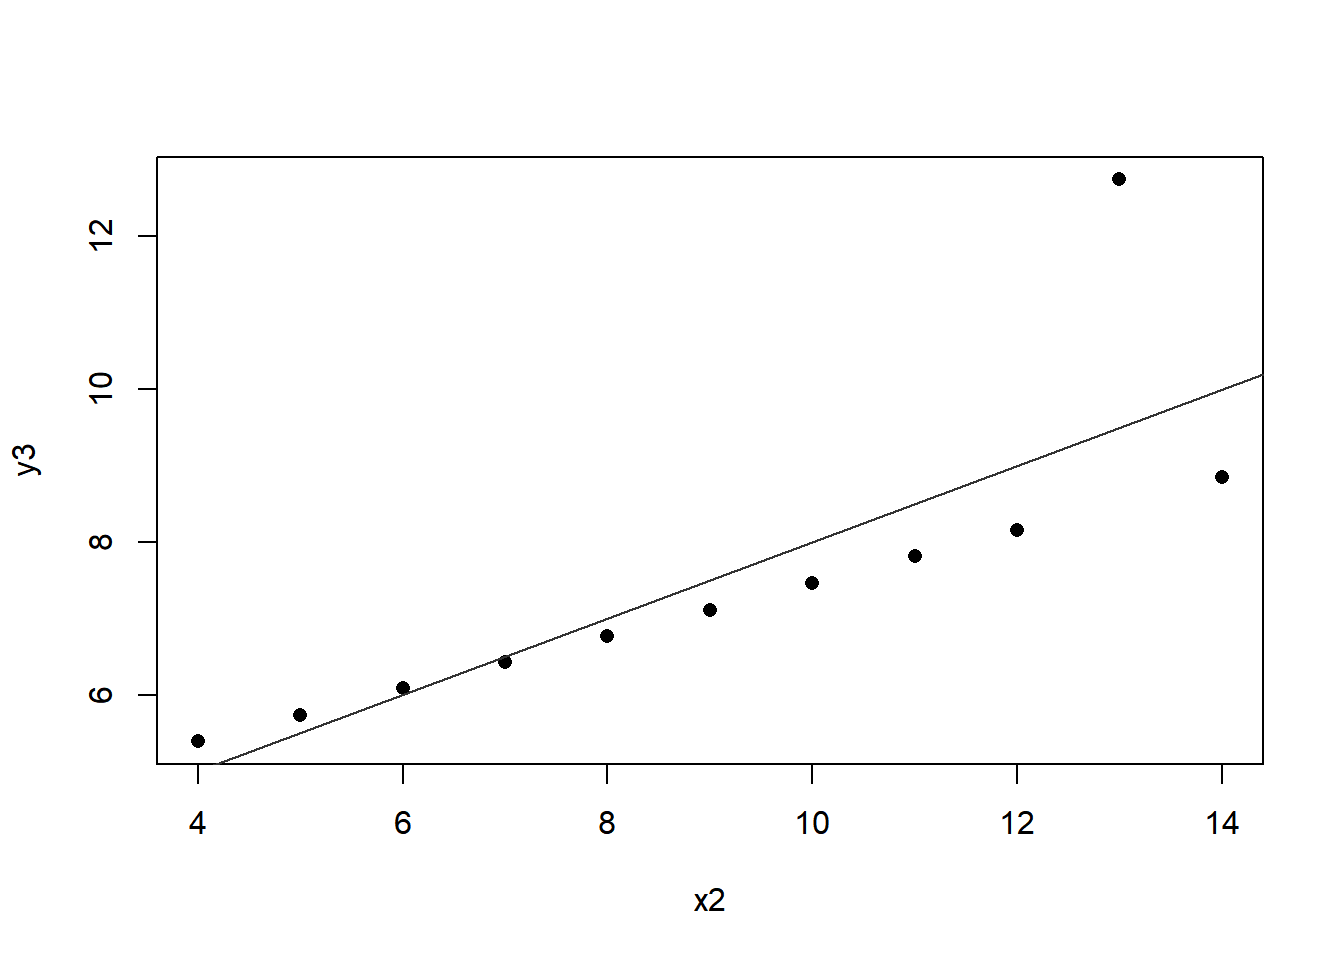
2.5.3 Question 1:is there a relationship between x and y? If so, how does the relationship look like?
2.5.4 Your answer here
library(readr)
library(readr)
ad_sales <- read_csv('https://raw.githubusercontent.com/utjimmyx/regression/master/advertising.csv')
## New names:
## * `` -> ...1## Rows: 200 Columns: 6## -- Column specification --------------------------------------------------------
## Delimiter: ","
## dbl (6): ...1, X1, TV, radio, newspaper, sales##
## i Use `spec()` to retrieve the full column specification for this data.
## i Specify the column types or set `show_col_types = FALSE` to quiet this message.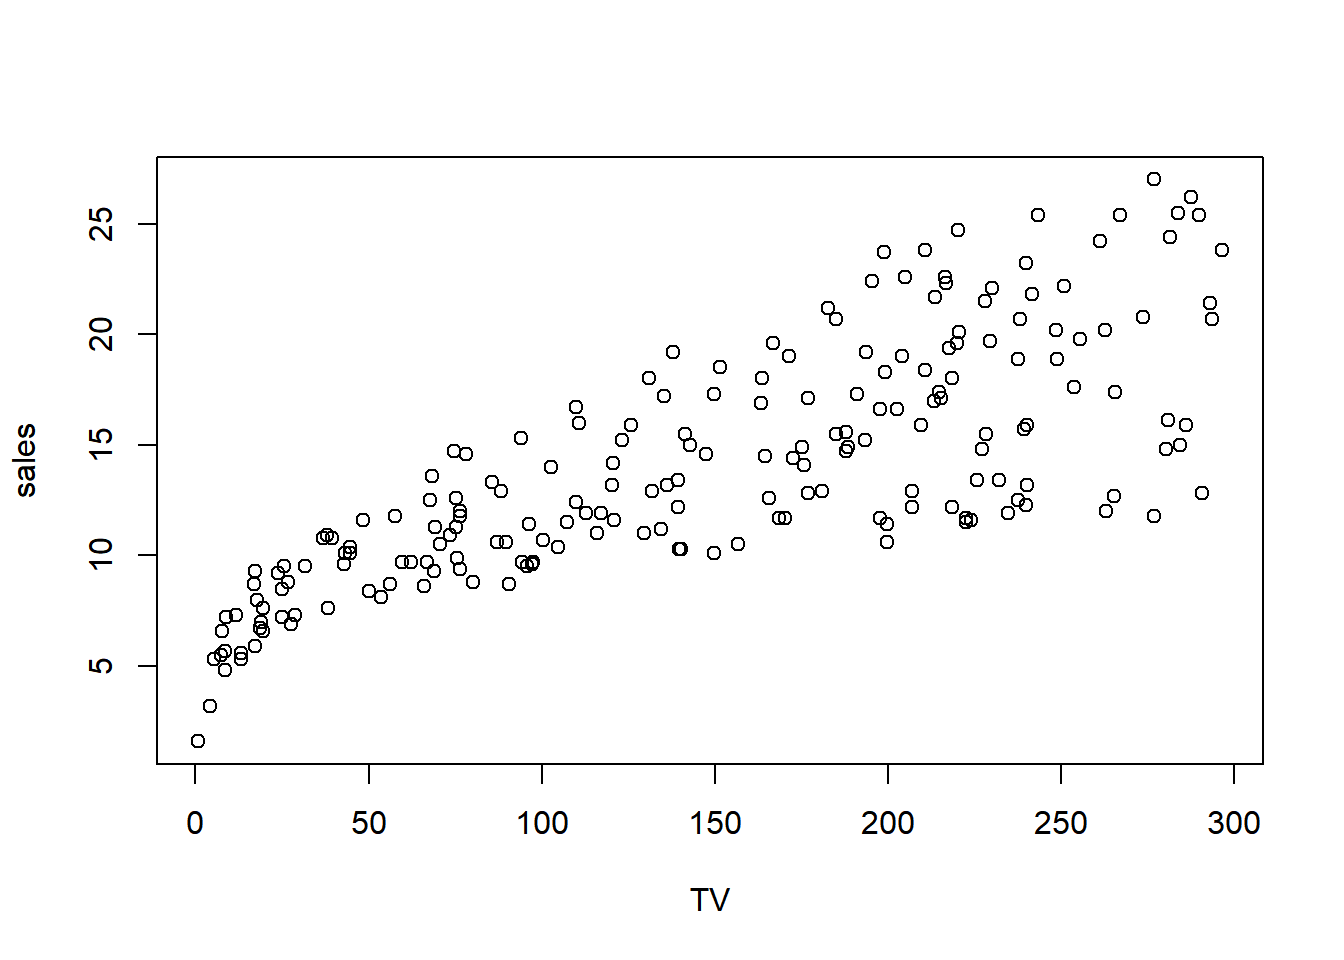
2.5.5 Question 2:Is there a relationship between TV advertising and Sales? If so, how does the relationship look like?
2.5.6 Your answer here
2.5.7 Question 3 (optional):Can you plot the relationship between radio advertising and Sales? If so, how does the relationship look like?
###Your answer here
###Question 4: Two things you learned from this tutorial ###Your answer here
2.5.8 References
Bivariate Analysis Definition & Example https://www.statisticshowto.com/bivariate-analysis/#:~:text=Bivariate%20analysis%20means%20the%20analysis,the%20variables%20X%20and%20Y.
https://www.sciencedirect.com/topics/mathematics/bivariate-data
Coy 2020. New Study Suggests Polls Are Missing Shy Trump Voters. Bloomberg. https://www.bloomberg.com/news/articles/2020-08-28/new-study-suggests-polls-are-missing-shy-trump-voters
Peter K. Dunn (2019). Scientific Research Methods: Tutorials. https://bookdown.org/pkaldunn/SRM-tutorials/index.html Qualtrics, 2011. Marketing Research. Qualtrics Lab.
Conformity Bias https://ethicsunwrapped.utexas.edu/glossary/conformity-bias#:~:text=The%20conformity%20bias%20is%20the,using%20their%20own%20personal%20judgment.
tfaforms, 2020. https://cloudspn.tfaforms.net/266232?utm_source=linkedin&utm_medium=paid