Chapter 1 Introduction
1.1 Welcome to Market Research!
The number one complaint of undergraduate marketing students at CSUB is that they haven’t acquired a marketable “skill” coming out of college. They also complain that friends and roommates in other business majors are having an easier time getting a job. If you feel this way, you’re in luck, as this course should help. In this course, you can acquire a “skill” that is marketable and that will hopefully help you understand statistics as it applies to the development of marketing strategy and consumer behavior. Along these lines, the purpose of this course is to provide you with the knowledge and skills necessary to conduct a market research project from start to finish, and then to apply the findings in developing actionable strategies. The course is centered on the marketing research process—including problem formulation, research design, sampling, data analysis, and interpretation of results.
Traditional marketing courses usually focus on conceptual materials and the big picture of marketing. This course will attempt to help you build marketing research and analytics skills that are in high demand. Every business could potentially benefit from becoming more data-informed.
Recently, the American Marketing Association (AMA) reports that the percentage of marketing budgets companies plan to allocate to analytics over the next three years will increase from 5.8% to 17.3%—a whopping 198% increase (Harvard Business Review, 2018). You may visit indeed.com to explore different careers that are available to students who have “analytics” skills. For instance, a recent report by Digitaldetroit suggests that about 99% of the recent marketing jobs require “analytics & reporting” skills (Digitaldetroitllc, 2021).
The U.S. Bureau of Labor Statistics reports that the demand for data science skills will drive a 27.9 percent rise in employment in the field through 2026. Not only is there a huge demand, but there is also a noticeable shortage of qualified data scientists (Miller, 2020).
Ref: Kelsey Miller, June 4, 2020. 11 Data Science Careers Shaping Our Future. https://www.northeastern.edu/graduate/blog/data-science-careers-shaping-our-future/ .
Ref: Remote Digital Marketing Jobs: What We Learned Looking at 100 Posts (2021 Update). https://digitaldetroitllc.com/2021/07/27/remote-digital-marketing-jobs-what-we-learned-looking-at-100-posts-2021-update/.
knitr::include_graphics("Analytics_post_2022.PNG")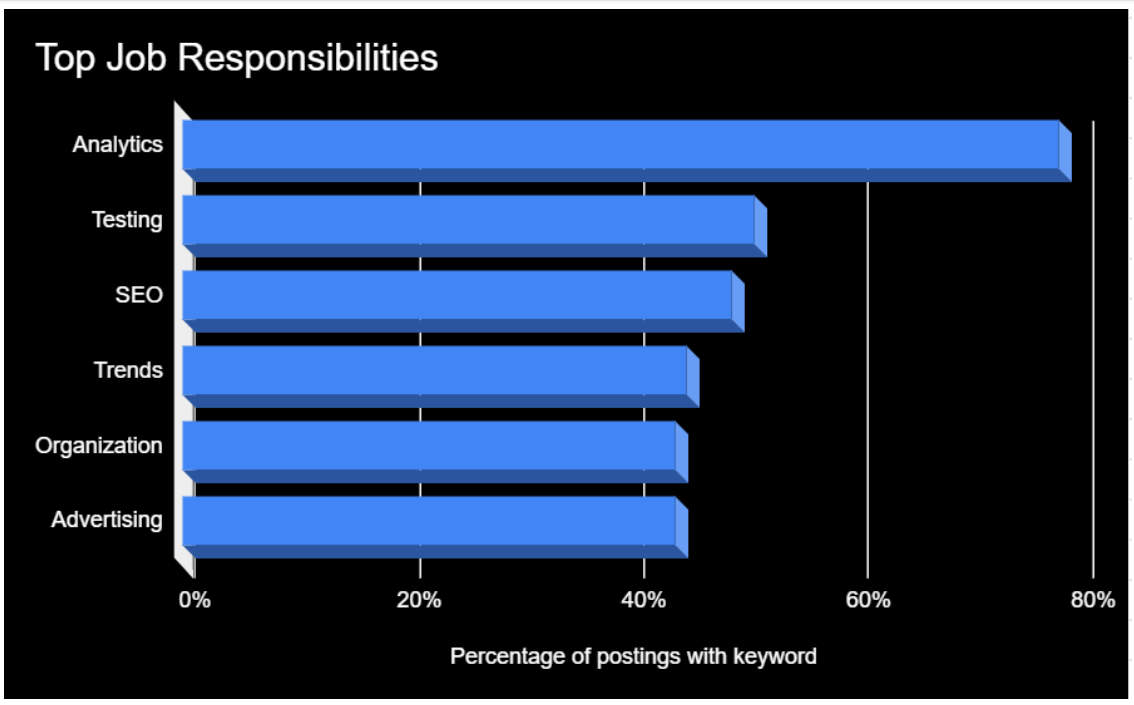
Figure 1.1: Job growth: Employment projections for marketing research analysts - US Bureau of Labor Statistics:2016-2026
Please do not confuse “analytics” with “statistics” though. “Analytics” is a general skill that is one of the most in-demand skills (LinkedIn 2021). That said, you will find many job titles that are designed for data analysts who understand how to collect data, analyze data, present the results, and make data-informed decisions. However, statistics is a subject or area that is focused on understanding predictions, modeling, and algorithms. The demand for analytics professionals is way higher than it is for “statisticians.” See the following two charts for more details.
knitr::include_graphics("analytics_jobs.PNG")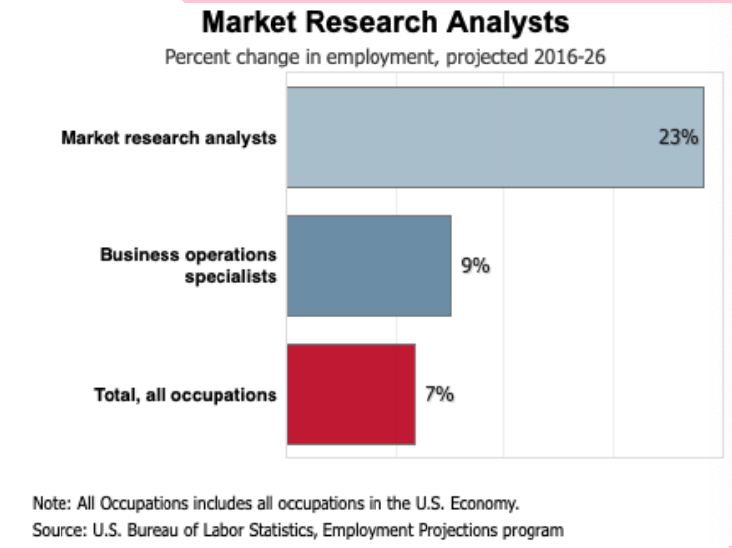
Figure 1.2: Job growth: Employment projections for marketing research analysts- HBR(2018)
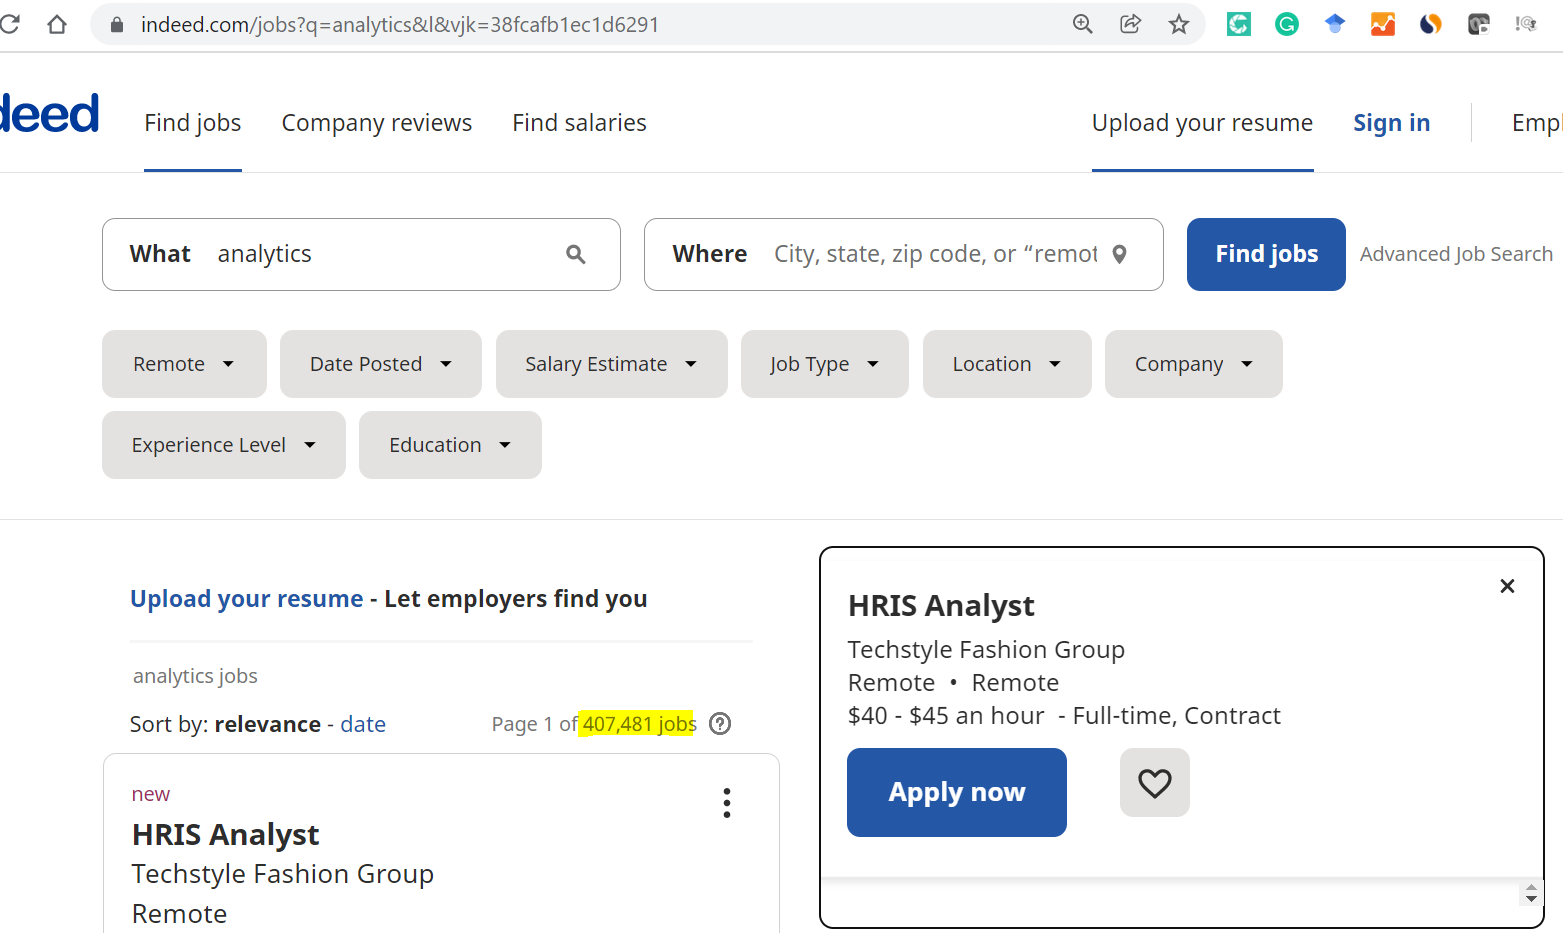
Figure 1.3: The number of job posts that include analyst (indeed.com, 2022
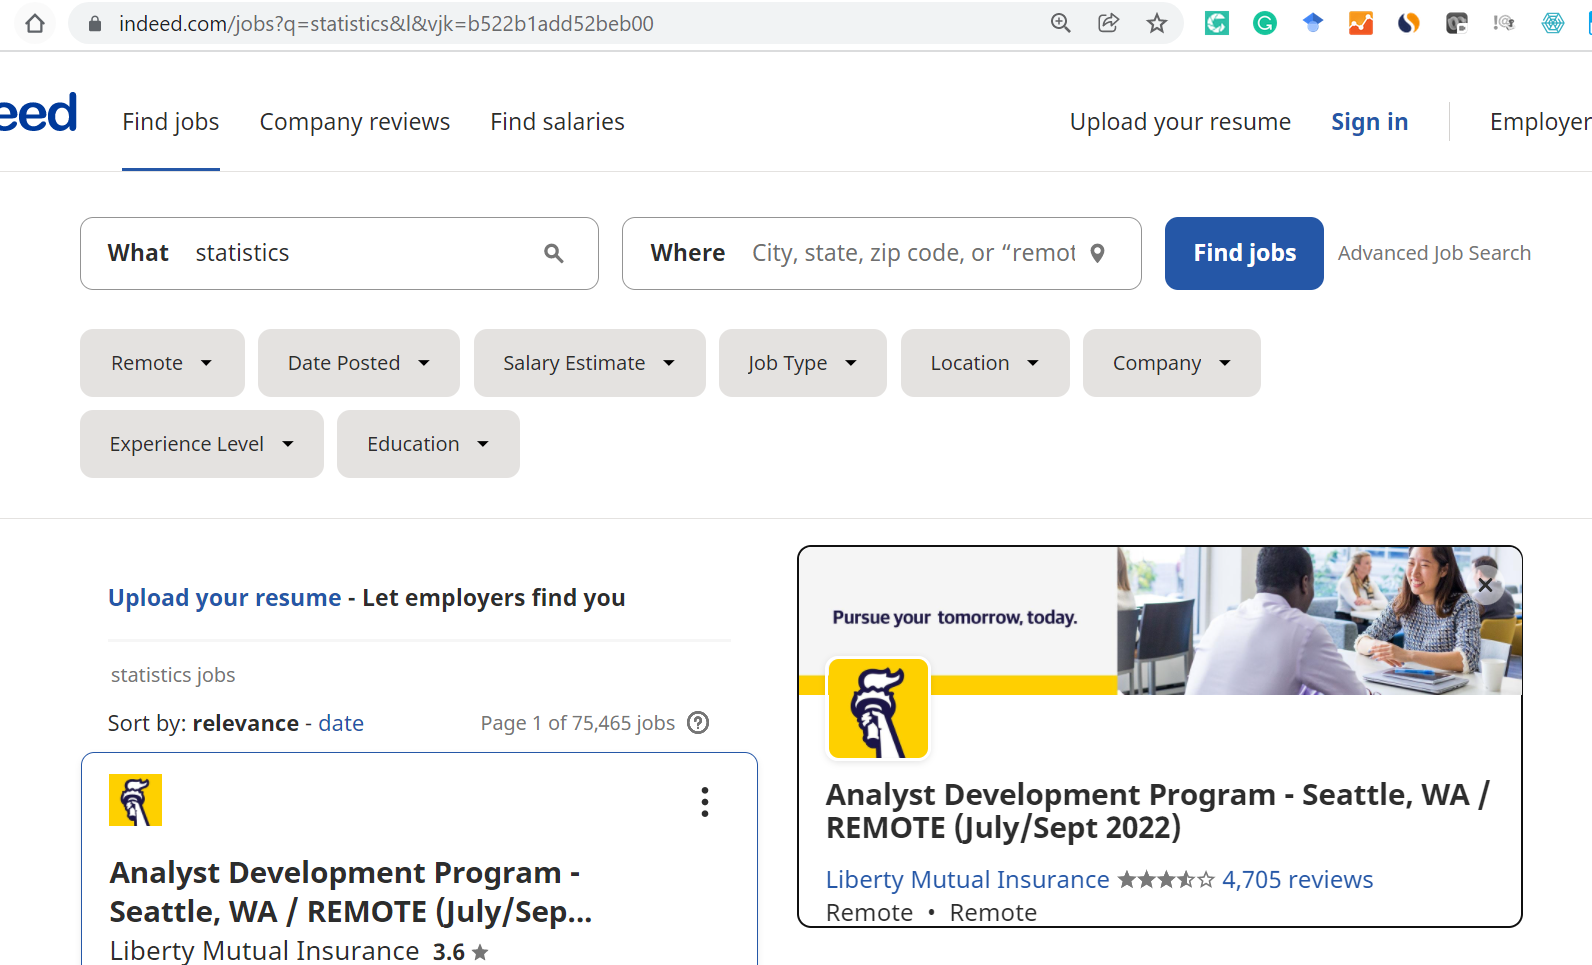
Figure 1.4: The number of job posts that include statistics(indeed.com, 2022
Reference:Jobs on the Rise in 2021 https://business.linkedin.com/talent-solutions/resources/talent-acquisition/jobs-on-the-rise-us LinkedIn Jobs on the Rise 2022: The 25 U.S. roles that are growing in demand. https://www.linkedin.com/pulse/linkedin-jobs-rise-2022-25-us-roles-growing-demand-linkedin-news/
1.1.1 What did my previous students say about their learning experience
“After completing the competition, I hope to use the experience from using R studio to perform analysis and apply the knowledge in future work. My primary focus would be to build a company that focuses on media and animation. Using the same procedures and process we did in the competition will be virtual in my future business plans.”
“Through trial and error, this was achieved but the learning experience is what made it the most exciting for me.”
“This in turn has helped me enrich myself in one of the most popular programming languages, R (R Studio), and learn how to work with others. This could not have been completed without the proper guidance and assistance of both my group mates, as well as Dr. Xu who has helped us tremendously throughout this competition and has given us a new skill that can help us further ourselves into our careers,” “I had a “good time” and “made some amazing connections and friendships.”
Ref: CSUB’s first team participated in 2021 Virtual Business Analytics Competition - School of Business and Public Administration students put their skills to the test with virtual competition https://news.csub.edu/csubs-first-team-participated-in-2021-virtual-business-analytics-competition
Additionally, this course will also introduce you to the current state-of-the-art programming technology for marketing research, R. Currently, only less than .05% of the business schools (MIT, Stanford, University of Zurich, UC Berkeley, John Hopkins, Northwestern, etc.) teach students R for marketing research and analytics. You might want to do some Google search to see which companies are using R for marketing research. See a cool interactive App I designed recently: http://rpubs.com/utjimmyx/nlpapp.
Overarching goals - To succeed in this environment a company must have a sustainable competitive advantage in the market so it will be: (1) the first choice of its customers when they buy, (2) the first choice of its employees when they decide where to work, and (3) the first choice of its investors when they decide to invest their capital. This course builds on strategic marketing that affect a firm’s competitive advantage, and demonstrates how managers can formulate a strong position in the market by: (1) asking the right questions, (2) making the right decisions, and (3) efficiently and effectively implementing their strategic decisions.
1.2 Course Objectives
- To discuss the role of marketing research in marketing strategy development.
- To discuss how marketing research is done in terms of the process used to derive answers to marketing problems.
- To appreciate qualitative research techniques and to be knowledgeable about when to use them and the limitations inherent in their use.
- To be able to diagnose the type of research design needed to approach a marketing problem.
- To be aware of the recommended procedures and pitfalls of survey design.
- To be able to analyze a survey for reliability and to understand when a scale is valid.
- To list the pros and cons of the various sampling methods.
- To be able to derive a statistically valid sample size given limited parameters.
- To analyze data for association and to interpret chi-square output as a means of developing actionable strategies.
- To analyze data for significant mean differences and to interpret t-test and ANOVA output as a means of developing actionable strategies.
- To analyze data for prediction and to interpret regression output as a means of developing actionable strategies.
- To dabble in new areas and new methods (cluster analysis, MDS, NLP, etc.)
This course has two guiding principles. The first is that marketing research is only useful to the extent that they help solve managerial problems. The second is that you have to get your hands dirty. That said, classroom time will be spent on a combination of lecture, discussion, and hands-on exercises. These activities will be focused by a set of discussion questions that will be given to students in separate electronic handouts.
Research - Research is a necessary component for making business decisions. Therefore, regardless of industry, professionals need to know how to conduct research properly as well as be able to recognize appropriate methodologies and sound techniques given a research objective at hand.
This course provides students the steps used by professionals for conducting market research. Instruction is given on defining the objective, secondary research, qualitative primary research, survey development, sampling techniques, survey distribution, data analysis and communicating results.
By the end of the course, students will be able to conduct basic research needed in today’s business environments as well as be able to identify the usefulness of research conducted by others.
1.3 Texts and Materials
https://bookdown.org/utjimmyx/marketing_research/ rpubs.com/utjimmyx There is no required textbook. You should be able to get the reference books for the course at no cost: Smith, S. M., & Albaum, G. S. (2010). Basic marketing research.. Qualtrics Labs, Inc.(Online Edition) at the UWW.edu website.
Other reference materials: Free e-book (online access available at https://library.csub.edu/ ) - The Essentials of Marketing Research. Lawrence Silver, Robert E. Stevens, Bruce Wrenn, and David L. Loudon Wheelan, C. (2013). Naked statistics: Stripping the dread from the data. WW Norton & Company. https://www.ama.org/students/Pages/Student-Resouces.aspx The AMA Student Resource Center provides helpful information for student members and AMA collegiate chapter leaders. http://www.msi.org/ MSI fosters collaboration between member companies and a global network of academics to drive marketing innovation. https://twitter.com/MKTJimmyxu Follow the class feed (hashtag #insightsmkt2020) on Twitter for updates and in class discussion remarks. Informs.com marketingstatistics.wordpress.com
In this class I will blend external interactive reading modules via my own R repository, rpubs.com/utjimmyx and other sites (https://bookdown.org/, https://github.com/xiaoguozhi/R-for-Marketing-Research-and-Analytics, R for Data Science, etc.) where you will read state-of-the-art marketing research topics and applications prior to each class session. Then in each class I’ll spend the first part of class reviewing the key issues and answer any burning questions. Then you will break up into defined small groups and work together to complete a marketing research problem prior to the end of class. Thus, the majority of class time will be spent practicing and applying what you learned outside of the classroom.
All content in this course leads toward the project. All test questions lead toward the project. All Assignments lead to the tests, which lead toward the project. There are no superfluous homework questions.
1.4 Software
Most statistical analyses will be demonstrated using Excel and R.
I suggest that you have Excel, R, and R Studio installed on your own laptop by the end of week 1.
You can use C, C+, Go, Julia, Python, R, SAS, STATA ,Eviews, SPSS, Mplus, or any other language you are comfortable with.
Special note: I have developed a set of computer routines based on the data science software R available at rpubs.com/utjimmyx. The examples usually provide precisely the analyses needed for this course, and for which support and examples are provided.
R is real data science software, which, with the language Python, dominate data science, the real stuff. You might want to check out the following resources for key topics or case studies presented during the class. See which companies are using R for marketing research in a regular basis:
Subject to Change Statement **Schedule and assignments are subject to change as our course moves forward. Students are expected to regularly check the Blackboard course area for announcements and updates about the course. Students are also expected to check their email accounts daily for any announcements, changes, etc.
1.4.1 Getting started with R Studio Cloud
Please watch the following 6-min YouTube video - Intro to R Studio Cloud - https://www.youtube.com/watch?v=uK1Va_UWQFc
1.4.2 Install R & RStudio if you can (For users who would like to use R for more than 15 hours per month)
Follow the instruction here to download R: https://www.r-project.org/
Follow the instruction here to download RStudio next: https://rstudio.com/products/rstudio/download/#download
The link for downloading R on the following site is expired. However, the learning resources on the page are still very useful - https://researchguides.library.vanderbilt.edu/c.php?g=882675&p=6342055
Installing R and RStudio on Windows 10 https://www.youtube.com/watch?v=VLWaED9jTiA
For installation purposes, you may need to get some help from the IT Help Desk at CSUB. For additional information or assistance, contact our CSUB Helpdesk at 661-654-HELP (4357).
1.5 Introduction
How does our target market look like?
Why are other people not buying from us?
What does your ideal customer really want?
What is the size of our target market?
Is a website designed with a better landing page more likely to have a better conversion rate than an conventional one?
This list goes on and on.
It is questions like these that motivate people to study marketing, marketing research, and marketing analytics.
Research design is a plan that shows how (methods and data) and why (literature review and theory background) a researcher intends to study an empirical question.
1.6 Research Objectives & Limitations
- exploratory, descriptive, causal, or explanatory?
- A controlled experiment is “an experiment in which all factors are held constant except for one: the independent variable. A common type of controlled experiment compares a control group against an experimental group. All variables are identical between the two groups except for the factor being tested” (Thoughtco, 2019).
- True (or controlled) experiment - In a “true” experiment, the assignment is done randomly.
- Natural or Quasi-experiment - The term “quasi” refers to the situation where study units are not assigned to experimental groups randomly.
Practical limitations:
ethical considerations
lack of data, time, or money
bias
conformity bias is “the tendency people have to behave like those around them rather than using their own personal judgment.” Reference: Conformity Bias https://ethicsunwrapped.utexas.edu/glossary/conformity-bias#:~:text=The%20conformity%20bias%20is%20the,using%20their%20own%20personal%20judgment.
social desirability effect - Republicans are more reticent than Democrats and Independents to share their voting intentions in phone polls (Coy 2020)
-Errors
- Sampling error occurs "when a sample does not accurately represent the population" (Qualtrics, 2011).
- Other types of errors
How we collect data determines whose voice is heard.- tfaforms
1.7 Figuring out causal relationships
Associative variation
Time sequence of events
Absence of other possible causal factors (confounding factors)
1.8 A cafe owner’s marketing research problem
A cafe owner doesn’t believe that his customers can taste the difference between diet and regular softdrinks. As a result, the cafe owner decides to conduct a study of his customers (Peter 2019). The first 6 questions are related to this hypothetical cafe owner’s marketing research problem.
1.8.1 In-class discussion questions
DQ1 - Two questions that the cafe owner is considering are given below. Which do you prefer, and why?
- Among my Wednesday customers, is the average customer-taste rating the same for diet and regular lemonade soft drinks?
- Among my Wednesday customers, is the percentage of customers who prefer diet lemonade soft drink the same as the percentage of customers who prefer regular lemonade soft drink?
DQ2 - Make some notes about how the cafe owner could answer the question using an observational study.
DQ3 -Make some notes about how the cafe owner could answer the question using an experimental study.
DQ4 -What would be the best type of experimental study: natural (true) or quasi? Why?
DQ5 -List some advantages and disadvantages of the experimental and observational studies. List some similarities and differences between the two studies.
DQ6 -Which do you think would be the better study? Why?
1.9 Bivariate Data Analysis
1.9.1 Objectives
The objective of this tutorial is to explain how bivariate analysis works.This analysis can be used by marketers to make decisions about their pricing strategies, advertising strategies, and promotion stratgies among others.
Bivariate analysis is one of the simplest forms of statistical analysis. It is generally used to find out if there is a relationship between two sets of values (or two variables). That said, it usually involves the variables X and Y (statisticshowto.com).
- Univariate analysis is the analysis of one (“uni”) variable.
- Bivariate analysis is the analysis of exactly two variables.
- Multivariate analysis is the analysis of more than two variables.
1.9.2 Dataset - We will be using two online datasets available in R for this tutorial
plot(y3 ~ x2, data = anscombe, pch = 16)
abline(lm(y3 ~ x3, anscombe), col = "grey20")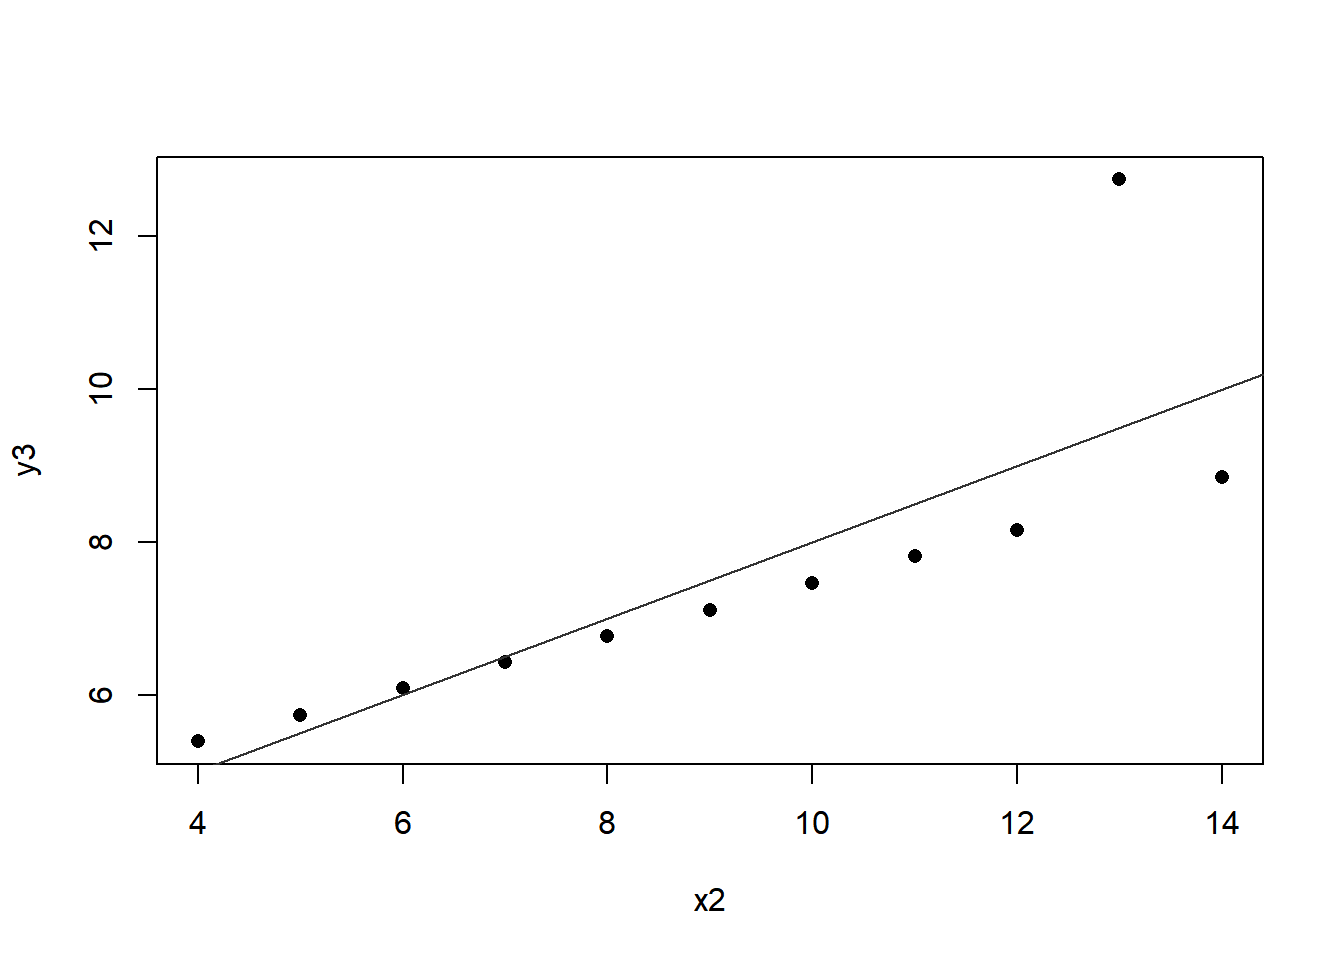
1.9.3 Question 1:is there a relationship between x and y? If so, how does the relationship look like?
1.9.4 Your answer here
library(readr)## Warning: package 'readr' was built under R version 4.1.3library(readr)
ad_sales <- read_csv('https://raw.githubusercontent.com/utjimmyx/regression/master/advertising.csv')## New names:
## Rows: 200 Columns: 6
## -- Column specification
## -------------------------------------------------------- Delimiter: "," dbl
## (6): ...1, X1, TV, radio, newspaper, sales
## i Use `spec()` to retrieve the full column specification for this data. i
## Specify the column types or set `show_col_types = FALSE` to quiet this message.
## * `` -> `...1`plot(sales ~ TV, data = ad_sales)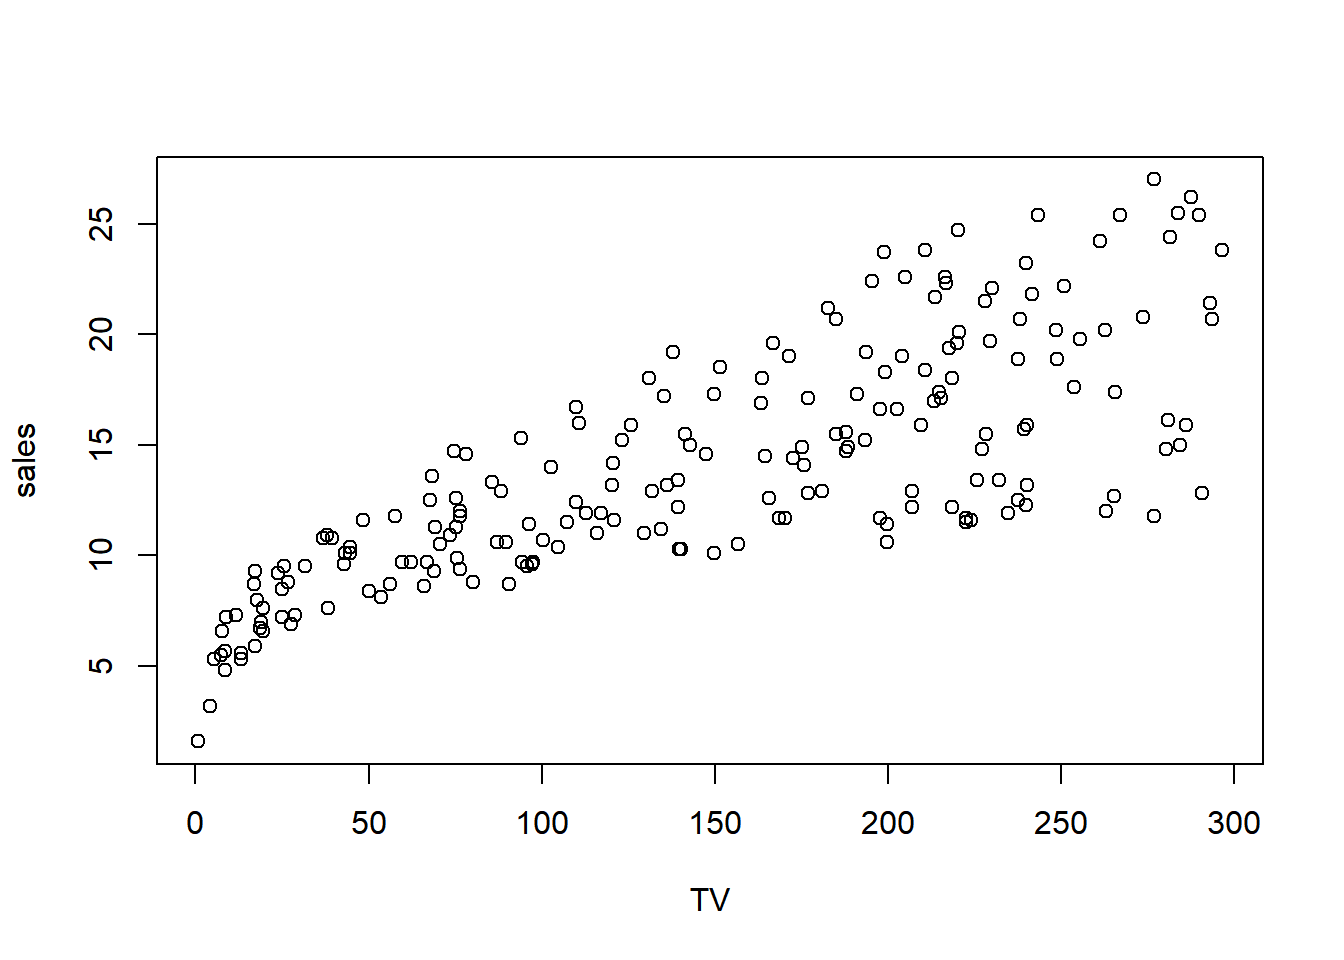
1.9.5 Question 2:Is there a relationship between TV advertising and Sales? If so, how does the relationship look like?
1.9.6 Your answer here
1.9.7 Question 3 (optional):Can you plot the relationship between radio advertising and Sales? If so, how does the relationship look like?
###Your answer here
###Question 4: Two things you learned from this tutorial ###Your answer here
1.9.8 References
Bivariate Analysis Definition & Example https://www.statisticshowto.com/bivariate-analysis/#:~:text=Bivariate%20analysis%20means%20the%20analysis,the%20variables%20X%20and%20Y.
https://www.sciencedirect.com/topics/mathematics/bivariate-data
Coy 2020. New Study Suggests Polls Are Missing Shy Trump Voters. Bloomberg. https://www.bloomberg.com/news/articles/2020-08-28/new-study-suggests-polls-are-missing-shy-trump-voters
Peter K. Dunn (2019). Scientific Research Methods: Tutorials. https://bookdown.org/pkaldunn/SRM-tutorials/index.html Qualtrics, 2011. Marketing Research. Qualtrics Lab.
Conformity Bias https://ethicsunwrapped.utexas.edu/glossary/conformity-bias#:~:text=The%20conformity%20bias%20is%20the,using%20their%20own%20personal%20judgment.
tfaforms, 2020. https://cloudspn.tfaforms.net/266232?utm_source=linkedin&utm_medium=paid