Chapter 12 Shiny
12.2 元素設計
library(readr)
studentData <- read_csv("https://raw.githubusercontent.com/tpemartin/github-data/master/studentFeatures.csv");
library(dplyr); library(stringr); library(lubridate); library(purrr); library(ggplot2); library(plotly)
.x<- "92a7Q7fee" # readline(prompt="學號")
studentData %>%
filter(學號==.x) -> student_i
library(magrittr) # 為了使用 %T>%
# student_i %>%
# select(學年, 學期, 學期PR) %T>% View -> studentPR
student_i %>%
select(學年, 學期, 學期借書量) %T>% View -> studentLibrary
student_i %>%
select(學系,學屆, 學年, 學期, 學期平均, 學期PR) %>%
mutate(
學年學期=as.factor(paste0(學年,"-",學期)),
學期平均=round(學期平均,digits = 2)
) %T>% View -> studentGPAstudentData %>%
group_by(學系, 學屆, 學年, 學期) %>%
summarise(
同學平均成績=round(mean(學期平均),digits=2),
同學中位成績=round(median(學期平均),digits=2),
同學中位借書量=median(學期借書量)
) %>%
ungroup %>%
mutate(
學年學期=as.factor(paste0(學年,"-",學期))
) -> studentSummary12.2.1 表格
https://rmarkdown.rstudio.com/flexdashboard/using.html#tabular_data
install.packages("DT")library(DT)
studentGPA %>%
select(
學年,學期,學期平均,學期PR
) %>%
DT::datatable(options = list(
bPaginate = FALSE
)) -> gpaTable; gpaTable12.2.2 圖形
studentSummary %>%
filter(
學系==studentGPA$學系[1],
學屆==studentGPA$學屆[1]) -> classmateDatavalidClassmateData <-
classmateData %>%
filter((學年-學屆)*2+學期<=8)
validClassmateData$同學平均成績[nrow(validClassmateData)]-> yloc
validClassmateData$學年學期 %>% length -> xloc
studentGPA %>%
ggplot()+
geom_line(aes(x=學年學期,y=學期平均,group=1),size=1.5)+
geom_line(
data=validClassmateData,
aes(x=學年學期,y=同學平均成績,group=1),
color="#33B5FF",size=1.2,alpha=0.5)+
annotate("text",x=c(xloc),y=yloc*0.996,label="同學平均",color="#2B95D2") +
labs(x=NULL,y="學期平均")->
studentGPAgg; studentGPAgg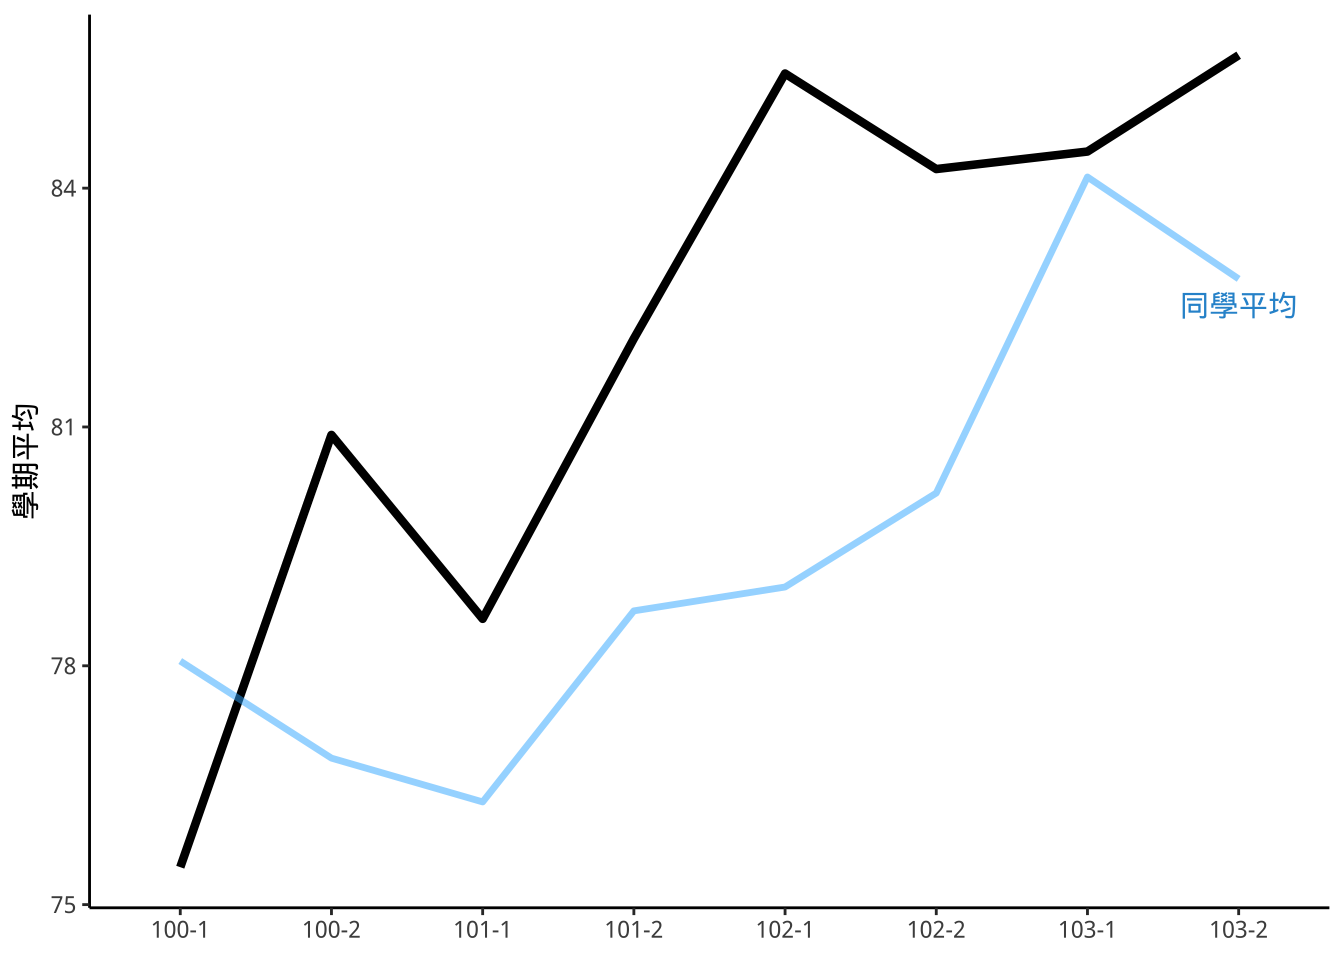
studentGPAplotly <- studentGPAgg %>% ggplotly
studentGPAplotlystudentGPA %>%
ggplot()+
geom_line(aes(x=學年學期,y=學期PR,group=1),size=1.5)+
labs(x=NULL,y="學期PR") -> studentPRgg
ggplotly(studentPRgg) -> studentPRggplotly
studentPRggplotly12.3 儀表板配置
download.file("https://raw.githubusercontent.com/tpemartin/github-data/master/shinyExample.Rmd",destfile = "./shinyExample.Rmd")12.4 使用步驟
frontmatter新增
Add runtime: shiny.Dashboard第一個column增加
{.sidebar}(用來放input controls).在Dashboard sidebar放Input, Output則放其他區塊。
12.4.1 Expensive loading
如有大量的資料要放在global chunk
```{r global, include=FALSE}
```
確認rmarkdown套件為最新。
install.packages("rmarkdown", type = "source")範例:
studentData <- read_csv("https://raw.githubusercontent.com/tpemartin/github-data/master/studentFeatures.csv");
studentData %>%
  group_by(學系, 學屆, 學年, 學期) %>%
  summarise(
    同學平均成績=round(mean(學期平均),digits=2),
    同學中位成績=round(median(學期平均),digits=2),
    同學中位借書量=median(學期借書量)
  ) %>%
  ungroup %>%
  mutate(
    學年學期=as.factor(paste0(學年,"-",學期))
) -> studentSummary12.4.2 Inputs
依input類型選擇適當Shiny input function: https://rmarkdown.rstudio.com/flexdashboard/shiny.html#inputs__outputs
範例:文字input
textInput(inputId, label, value = "", width = NULL,
placeholder = NULL)inputId: 網頁輸入區塊的id,可自取“英文名稱”。
label: 網頁顯示的輸入區塊標題,可自取任何名稱。
value: 輸入預設值。
placeholder: 給使用者的提示文字。
library(shiny)
textInput("student_id","請輸入學號")12.4.3 Outputs
依output類型選擇適當Shiny output function: https://rmarkdown.rstudio.com/flexdashboard/shiny.html#inputs__outputs
範例:圖形output
renderPlot(expr, width = "auto", height = "auto", res = 72, ...,
env = parent.frame(), quoted = FALSE, execOnResize = FALSE,
outputArgs = list())expr: 可以產生圖形的程式碼,可用{...}。
quoted: 程式碼用quote({...})->exprObj在外區存好而expr放exprObj時,quoted=TRUE。
注意quote裡的第一行,它是shiny output引入input值的方式:
input$YourInputIdquote({
.x<- input$student_id # readline(prompt="學號")
studentData %>%
filter(學號==.x) -> student_i
student_i %>%
select(學年, 學期, 學期借書量) -> studentLibrary
student_i %>%
select(學系,學屆, 學年, 學期, 學期平均, 學期PR) %>%
mutate(
學年學期=as.factor(paste0(學年,"-",學期)),
學期平均=round(學期平均,digits = 2)
) -> studentGPA
studentSummary %>%
  filter(
    學系==studentGPA$學系[1],
    學屆==studentGPA$學屆[1]) -> classmateData
validClassmateData <-
classmateData %>%
filter((學年-學屆)*2+學期<=8)
validClassmateData$同學平均成績[nrow(validClassmateData)]-> yloc
validClassmateData$學年學期 %>% length -> xloc
studentGPA %>%
ggplot()+
geom_line(aes(x=學年學期,y=學期平均,group=1),size=1.5)+
geom_line(
data=validClassmateData,
aes(x=學年學期,y=同學平均成績,group=1),
color="#33B5FF",size=1.2,alpha=0.5)+
annotate("text",x=c(xloc),y=yloc*0.996,label="同學平均",color="#2B95D2") +
labs(x=NULL,y="學期平均")->
studentGPAgg
studentGPAplotly <- studentGPAgg %>% ggplotly
studentGPAplotly
}) -> exprObjrenderPlotly(exprObj,quoted=TRUE)若為plotly物件,必需使用plotly所提供的renderPlotly()
12.4.4 適當放置Inputs/Outputs
Input function
創造Input sidebar,將input function放裡面。
Inputs {.sidebar data-width=300}
--------------------------------------------------------

```{r}
# shiny inputs defined here
```
Output function
將renderXXX()放在想放的Chart裡。
範例
download.file("https://raw.githubusercontent.com/tpemartin/github-data/master/shinyExample.Rmd",destfile = "./shinyExample2.Rmd")download.file("https://raw.githubusercontent.com/tpemartin/github-data/master/shinyComplete.Rmd",destfile = "./shinyComplete.Rmd")