8.1 Discrepancy measures per iteration
# In this section we will be calculating the AAD and MAD values for the true population matrix
# First get the true population vector from another dataset
voro <- readRDS("~/OneDrive - Vysoká škola ekonomická v Praze/YAY/Estimates/Voronoi both/Voronoi.estimates.rds") # getting the true pop vector from another object
pop = voro$pop
voro = voro %>% ungroup()
# Calculating Average Absolute Discrepancy
# Because the data is in three parts, thus we will calculate the AAD separately. The first set has iterations between 0 and 400. The second set has iterations between 401 and 801. The third set has iterations between 802 and 1002.
# The code/procedure is rather similar to the statistical evaluation presented in chapter 5, except that over here we are looking at all of the iterations instead of the last iteration.
# Note: the graphing part might take a bit longer to render.
# Part one
equal1 <- readRDS("~/OneDrive - Vysoká škola ekonomická v Praze/YAY/Estimates/P.equal/u.est.non.inf.P.equal.part1_400_new.rd s" ) #read in the data
equal1 = cbind(equal1, pop) # combining the data frame with the population vector
bigu = sum(equal1$pop) # useful to have this calculated and stored as a constant already
aad1 = equal1 %>%
  transmute_at(vars(contains("u")),funs("diff" = abs(pop - .))) %>% # transforming the columns
  summarise_all(funs("i" = sum(.)/bigu)) # summing up all rows for each column
colnames(aad1) = 0:400 # change the column names
# Part two
equal2 <- readRDS("~/OneDrive - Vysoká škola ekonomická v Praze/YAY/Estimates/P.equal/u.est.non.inf.P.equal.part401_800_new.rds") # read in the data
equal2 = cbind(equal2,pop) # combining the data frame with the population vector
aad2 = equal2 %>%  # mutating
  transmute_at(vars(contains("u")),funs("diff" = abs(pop - .))) %>%
  summarise_all(funs("i" = sum(.)/bigu))
colnames(aad2) = 401:801 # change the column names
# Part three
equal3 <- readRDS("~/OneDrive - Vysoká škola ekonomická v Praze/YAY/Estimates/P.equal/u.est.non.inf.P.equal.part801_1000_new.rds") # read in the data
equal3 = cbind(equal3,pop) # combining the data frame with the population vector
aad3 = equal3 %>%
  transmute_at(vars(contains("u")),funs("diff" = abs(pop - .))) %>% # transforming the columns
  summarise_all(funs("i" = sum(.)/bigu)) # summing up all rows for each column
colnames(aad3) = 802:1002 # change the column names
aad = cbind(aad1,aad2,aad3) # now we merge all three parts together in one
aadt = aad %>%
  pivot_longer(-c(), names_to = "iter", values_to = "aad") # transform the data frame into the long format
aadt$iter = as.numeric(aadt$iter) # cast the `iter` variable as a numeric variable
# Plot using ggplot
equal.aad.plot = aadt %>%
  ggplot(aes(x = iter, y = aad)) +
  geom_line() + labs(x = "Number of Iteration", y = "Average Absolute Discrepancy", title = "Equal Probability Matrix ~ AAD") + theme(axis.text.x = element_text(angle = 90),legend.position = "bottom") +
  scale_x_continuous(breaks=seq(0, 1000, 50))
saveRDS(equal.aad.plot, file = "equal.aad.plot.rds") # save the plot as rds
# Calculating Maximum Absolute Discrepancy
# Part One
mad1 = equal1 %>%
  transmute_at(vars(contains("u")),funs("diff" = abs(pop - .))) %>% # transforming the columns
  summarise_all(funs("i" = sum(.))) # summing up all rows for each column
colnames(mad1) = 0:400 # change the column names
# Part Two
mad2 = equal2 %>%  # mutating
  transmute_at(vars(contains("u")),funs("diff" = abs(pop - .))) %>% # transforming the columns
  summarise_all(funs("i" = sum(.))) # summing up all rows for each column
colnames(mad2) = 401:801 # change the column names
# Part Three
mad3 = equal3 %>%  # mutating
  transmute_at(vars(contains("u")),funs("diff" = abs(pop - .))) %>% # transforming the columns
  summarise_all(funs("i" = sum(.))) # summing up all rows for each column
colnames(mad3) = 802:1002 # change the column names
mad = cbind(mad1,mad2,mad3) # now we merge all three parts together in one
madt = mad %>%
  pivot_longer(-c(),names_to = "iter", values_to = "mad") # transform the data frame into the long format
madt$iter = as.numeric(madt$iter) # cast the `iter` variable as a numeric variable
# Plot using ggplot
equal.mad.plot = madt %>%
  ggplot(aes(x = iter, y = mad)) +
  geom_line() + labs(x = "Number of Iteration", y = "Maximum Absolute Discrepancy", title = "Equal Probability Matrix ~ MAD") + theme(axis.text.x = element_text(angle = 90),legend.position = "bottom") +
  scale_x_continuous(breaks=seq(0, 1000, 50))
saveRDS(equal.mad.plot, file = "equal.mad.plot.rds") # save the plot as rds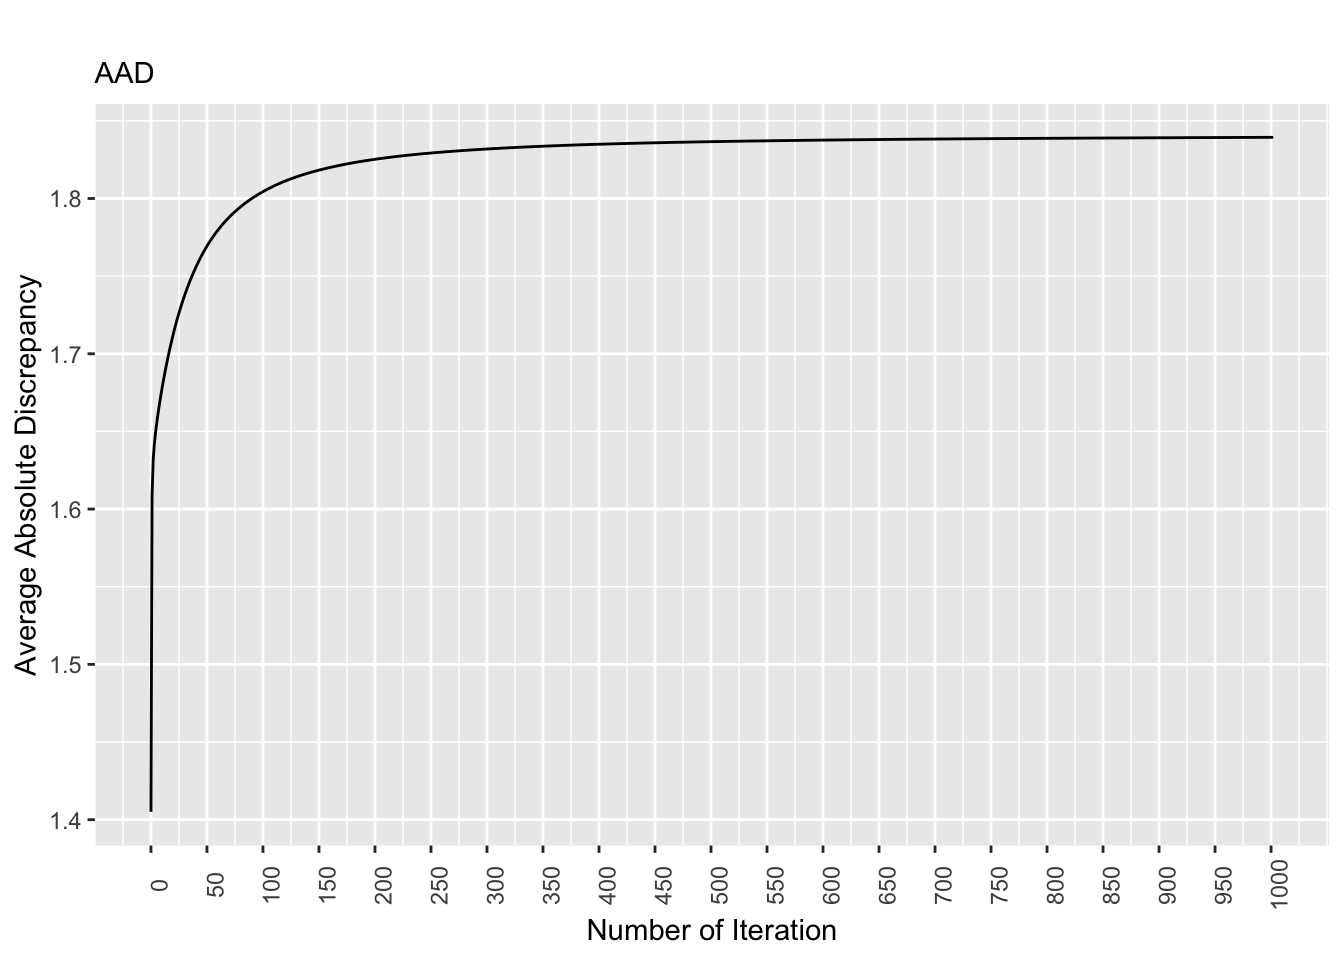
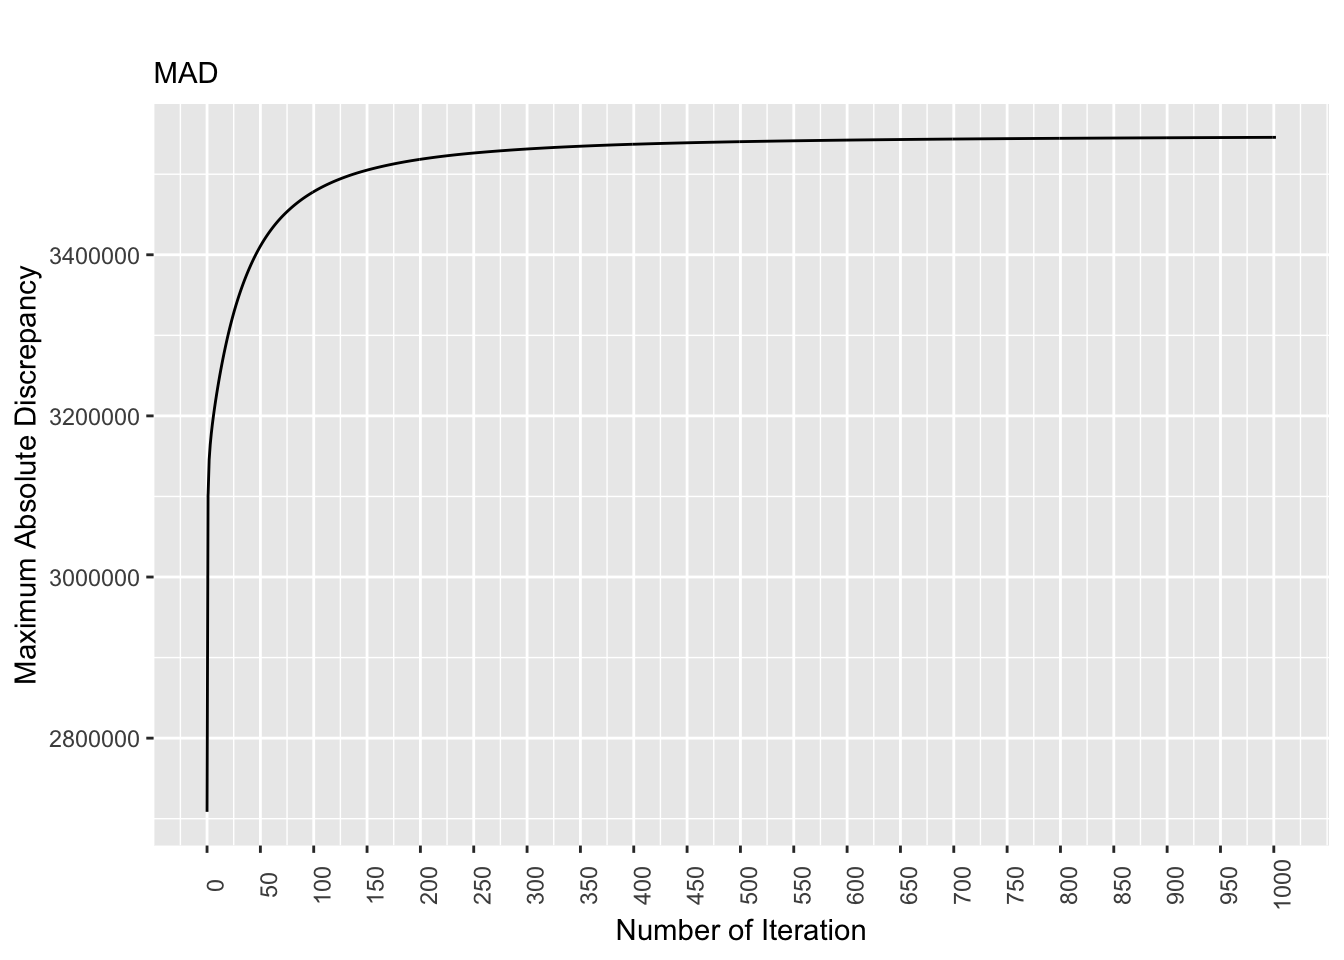
Figure 8.1: Discrepancy Over Time, Equal Pop. Matrix
For the equal population matrix, the discrepancy values stabilizes as the number of iterations increases. Specifically, starting at the 700th iteration, the discrepancy values are largely the same.
# In this section we will be calculating the AAD and MAD values for the true population matrix.
# This part is the largely the same procedure as the above section when calculating the equal population matrix.
# NOte: due to memory shortage, I have actively remove unused objects in order to conserve as much memory as possible. I also used as much of the garbage collection function, gc(), as possible.
rm(list = ls()) # remove unused objects
voro <- readRDS("~/OneDrive - Vysoká škola ekonomická v Praze/YAY/Estimates/Voronoi both/Voronoi.estimates.rds") # getting the true pop vector from another object
pop = voro$pop
rm(voro)
# Calculating Average Absolute Discrepancy
# Part One
true1 <- readRDS("~/OneDrive - Vysoká škola ekonomická v Praze/YAY/Estimates/P.oracle/u.est.non.inf.P.oracle.part1_400_new.rds") # read in the data
true1 = cbind(true1,pop) # combining the data frame with the population vector
bigu = sum(true1$pop) # useful to have this calculated and stored as a constant already
aad1 = true1 %>%
  transmute_at(vars(contains("u")),funs("diff" = abs(pop - .))) %>% # transforming the columns
  summarise_all(funs("i" = sum(.)/bigu)) # summing up all rows for each column
colnames(aad1) = 0:400 # change column names
rm(true1) # remove unnecessary object
# Part Two
true2 <- readRDS("~/OneDrive - Vysoká škola ekonomická v Praze/YAY/Estimates/P.oracle/u.est.non.inf.P.oracle.part401_800_new.rds") # read in the data
true2 = cbind(true2,pop) # combining the data frame with the population vector
aad2 = true2 %>%
  transmute_at(vars(contains("u")),funs("diff" = abs(pop - .))) %>% # transforming the columns
  summarise_all(funs("i" = sum(.)/bigu)) # summing up all rows for each column
colnames(aad2) = 401:801# change column names
rm(true2)# remove unnecessary object
# Part Three
true3 <- readRDS("~/OneDrive - Vysoká škola ekonomická v Praze/YAY/Estimates/P.oracle/u.est.non.inf.P.oracle.part801_1000_new.rds") # read in the data
true3 = cbind(true3,pop) # combining the data frame with the population vector
aad3 = true3 %>%
  transmute_at(vars(contains("u")),funs("diff" = abs(pop - .))) %>% # transforming the columns
  summarise_all(funs("i" = sum(.)/bigu)) # summing up all rows for each column
colnames(aad3) = 802:1002 # change column names
rm(true3)# remove unnecessary object
aad = cbind(aad1,aad2,aad3) # combining all three parts together in one data frame
aadt = aad %>%
  pivot_longer(-c(), names_to = "iter", values_to = "aad") # Transform the data frame into long form
aadt$iter = as.numeric(aadt$iter) # cast the `iter` variable as a numeric variable
# Plot using ggplot
true.aad.plot = aadt %>%
  ggplot(aes(x = iter, y = aad)) +
  geom_line() + labs(x = "Number of Iteration", y = "Average Absolute Discrepancy", title = "True Probability Matrix ~ AAD") + theme(axis.text.x = element_text(angle = 90),legend.position = "bottom") +
  scale_x_continuous(breaks=seq(0, 1000, 50))
saveRDS(true.aad.plot, file = "true.aad.plot.rds") # save the plot as a rds object
# Calculating Maximum Absolute Discrepancy
rm(list = ls()) # remove unnecessary objects
voro <- readRDS("~/OneDrive - Vysoká škola ekonomická v Praze/YAY/Estimates/Voronoi both/Voronoi.estimates.rds") # getting the true pop vector from another object
pop = voro$pop
rm(voro)
# Part One
true1 <- readRDS("~/OneDrive - Vysoká škola ekonomická v Praze/YAY/Estimates/P.oracle/u.est.non.inf.P.oracle.part1_400_new.rds") # read in the data
true1 = cbind(true1,pop) # combining the data frame with the population vector
mad1 = true1 %>%
  transmute_at(vars(contains("u")),funs("diff" = abs(pop - .))) %>% # transforming the columns
  summarise_all(funs("i" = sum(.))) # summing up all rows for each column
colnames(mad1) = 0:400 # change column names
rm(true1) # remove unused object
# Part Two
true2 <- readRDS("~/OneDrive - Vysoká škola ekonomická v Praze/YAY/Estimates/P.oracle/u.est.non.inf.P.oracle.part401_800_new.rds") # read in the data
true2 = cbind(true2,pop) # combining the data frame with the population vector
mad2 = true2 %>%
  transmute_at(vars(contains("u")),funs("diff" = abs(pop - .))) %>% # transforming the columns
  summarise_all(funs("i" = sum(.))) # summing up all rows for each column
colnames(mad2) = 401:801 # change column names
rm(true2) # remove unused object
# Part Three
true3 <- readRDS("~/OneDrive - Vysoká škola ekonomická v Praze/YAY/Estimates/P.oracle/u.est.non.inf.P.oracle.part801_1000_new.rds") # read in the data
true3 = cbind(true3,pop) # combining the data frame with the population vector
mad3 = true3 %>%
  transmute_at(vars(contains("u")),funs("diff" = abs(pop - .))) %>% # transforming the columns
  summarise_all(funs("i" = sum(.))) # summing up all rows for each column
colnames(mad3) = 802:1002 # change column names
rm(true3) # remove unused object
mad = cbind(mad1,mad2,mad3)  # combining all three parts together in one data frame
madt = mad %>%
  pivot_longer(-c(),names_to = "iter", values_to = "mad") # Transform the data frame into long form
madt$iter = as.numeric(madt$iter) # cast the `iter` variable into numeric
# plot using ggplot
true.mad.plot = madt %>%
  ggplot(aes(x = iter, y = mad)) +
  geom_line() + labs(x = "Number of Iteration", y = "Maximum Absolute Discrepancy", title = "True Probability Matrix ~ MAD") + theme(axis.text.x = element_text(angle = 90),legend.position = "bottom") +
  scale_x_continuous(breaks=seq(0, 1000, 50))
saveRDS(true.mad.plot, file = "true.mad.plot.rds") # save the plot as a rds object
rm(list = ls()) # remove 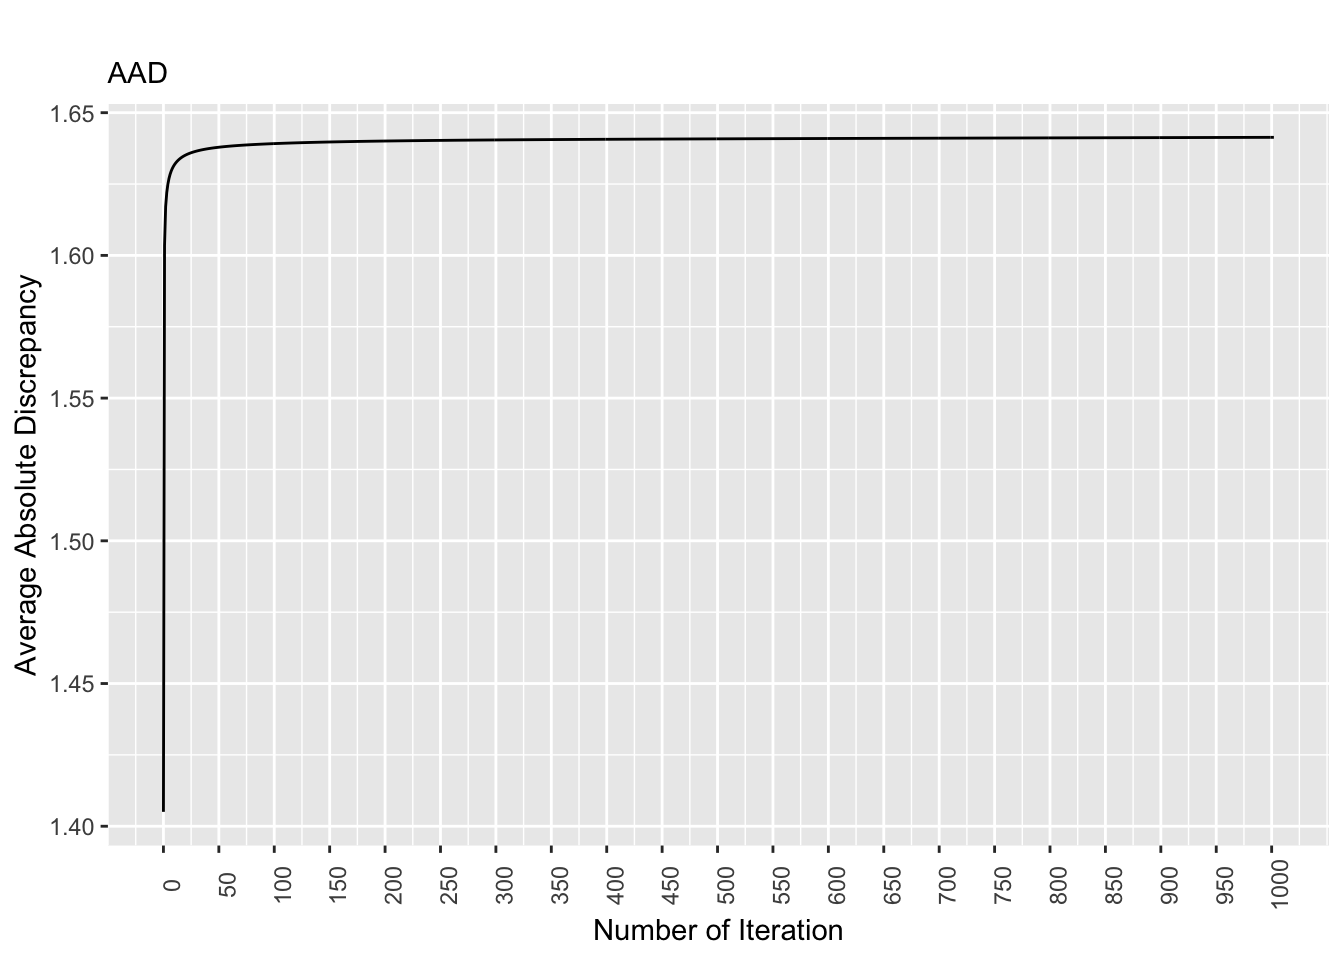
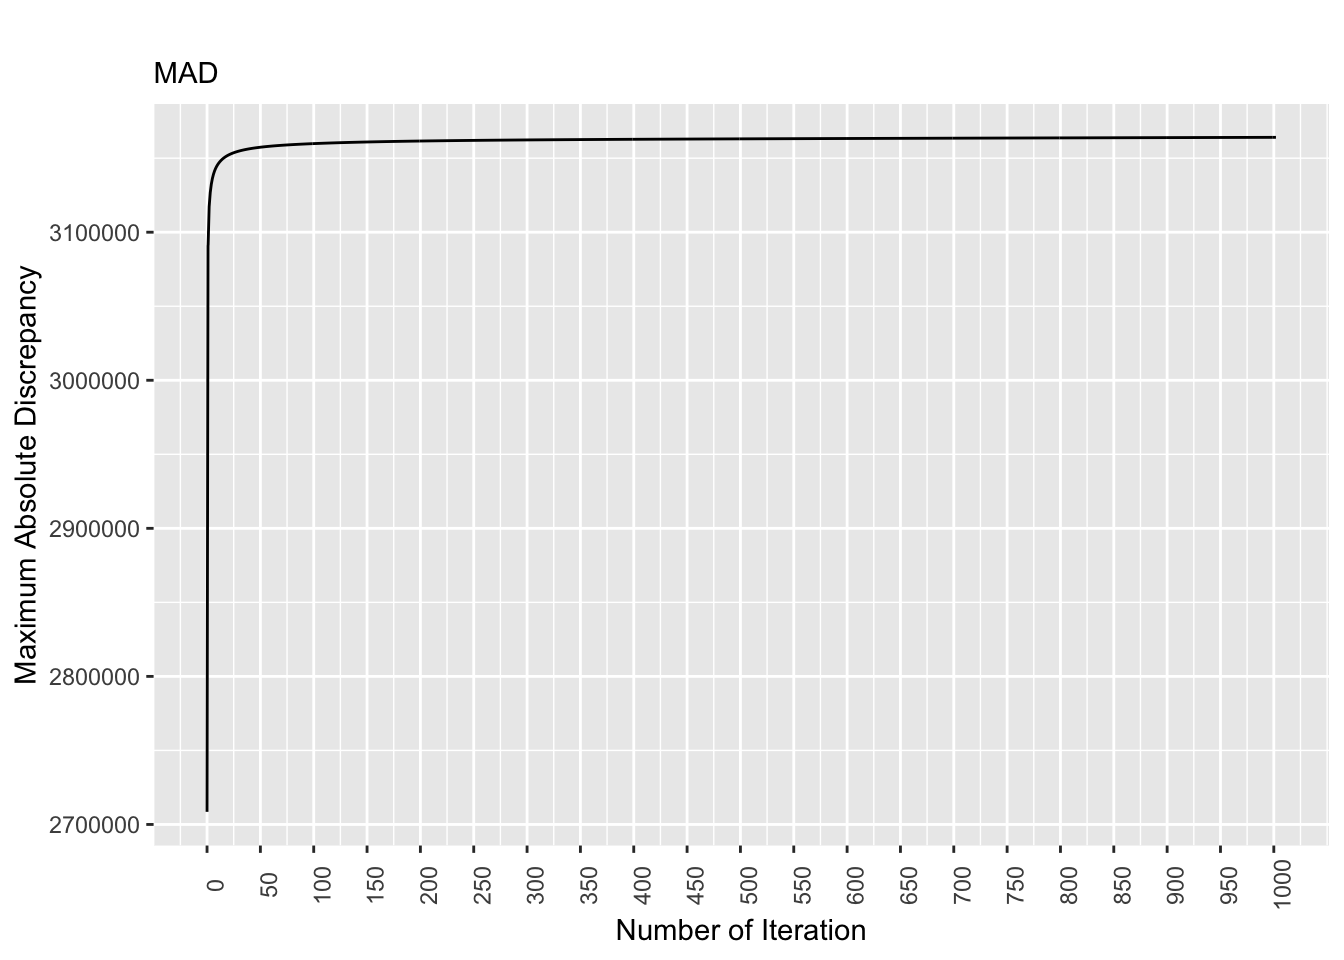
Figure 8.2: Discrepancy Over Time, True Pop. Matrix
For the true population matrix, the discrepancy values stabilizes as the number of iterations increases. More specifically, starting at the 300th iteration, the discrepancy values are largely the same.