Chapter 6 Partial Least Squares Correlation
The goal of PLSC is to find what is common between two different data tables of the same observations when multicolinearity and the “p>>n” problem exist.
First, an SVD is performed to decompose the correlation matrix between the data tables into weights for each data table. To obtain the latent variables we multiple the weights for each table obtained by the SVD by its respective data table. Finally, we find the maximal covariance between the latent variable pairs found in the diagonal matrix of singular values of the SVD.
Partial Least Squares Regression is PLSC’s close cousin that creates latent variables from one data table in order to predict the values of the other data table. In terms of predictive power it is often compared to feedforward artificial neural networks or backpropagation.
6.1 Data set: PHQ and OSIQ
Object-Spatial Imagery Questionnaire (OSIQ) has 216 participants (rows) and 30 quantitative variables (columns). The columns consist of 15 object imagery questions and 15 spatial imagery questions.
The questionnaire measures how participants imagine and experience things on a scale from 1 i.e. “completely disagree” to 5 i.e. “completely agree.” The “neutral” option is placed at 3 and heeds caution if ever binning this scale due to the 0 point being in the middle of the scale. It doesn’t make sense to bin “agree” and “disagree” with “neutral” in order to make a balanced design.
Note: The number of participants (rows) for the PHQ has been reduced to 216.
| s01 | s02 | s03 | o04 | s05 | s06 | o07 | o08 | s09 | o10 | s11 | o12 | s13 | s14 | o15 | o16 | o17 | s18 | o19 | s20 | o21 | o22 | s23 | s24 | o25 | o26 | s27 | o28 | s29 | o30 |
|---|---|---|---|---|---|---|---|---|---|---|---|---|---|---|---|---|---|---|---|---|---|---|---|---|---|---|---|---|---|
| 4 | 3 | 3 | 4 | 2 | 1 | 4 | 2 | 1 | 5 | 2 | 3 | 3 | 4 | 3 | 2 | 3 | 1 | 4 | 4 | 2 | 3 | 2 | 2 | 5 | 1 | 5 | 2 | 1 | 3 |
| 2 | 4 | 2 | 4 | 2 | 4 | 4 | 4 | 2 | 5 | 3 | 4 | 4 | 3 | 4 | 4 | 4 | 3 | 2 | 4 | 4 | 3 | 2 | 2 | 4 | 4 | 2 | 4 | 3 | 4 |
| 5 | 5 | 1 | 2 | 5 | 1 | 1 | 1 | 1 | 1 | 1 | 2 | 3 | 1 | 1 | 1 | 2 | 1 | 4 | 5 | 1 | 1 | 5 | 1 | 1 | 5 | 5 | 1 | 1 | 1 |
| 4 | 4 | 2 | 2 | 5 | 5 | 5 | 3 | 4 | 4 | 4 | 4 | 2 | 5 | 2 | 4 | 5 | 2 | 4 | 4 | 4 | 4 | 2 | 4 | 5 | 4 | 4 | 2 | 1 | 1 |
| 3 | 2 | 3 | 4 | 2 | 2 | 4 | 2 | 5 | 5 | 3 | 5 | 5 | 3 | 5 | 5 | 5 | 3 | 5 | 2 | 3 | 3 | 1 | 1 | 5 | 3 | 5 | 4 | 3 | 4 |
| 1 | 1 | 4 | 4 | 2 | 2 | 4 | 1 | 3 | 5 | 2 | 4 | 4 | 3 | 4 | 4 | 5 | 1 | 2 | 1 | 4 | 2 | 1 | 1 | 4 | 3 | 2 | 4 | 2 | 5 |
6.2 Correlation Plot
# Compute the covariance matrix
XY.cor <- cor(PHQ,OSIQ)
# Plot it with corrplot
corrplot(XY.cor, method = "color")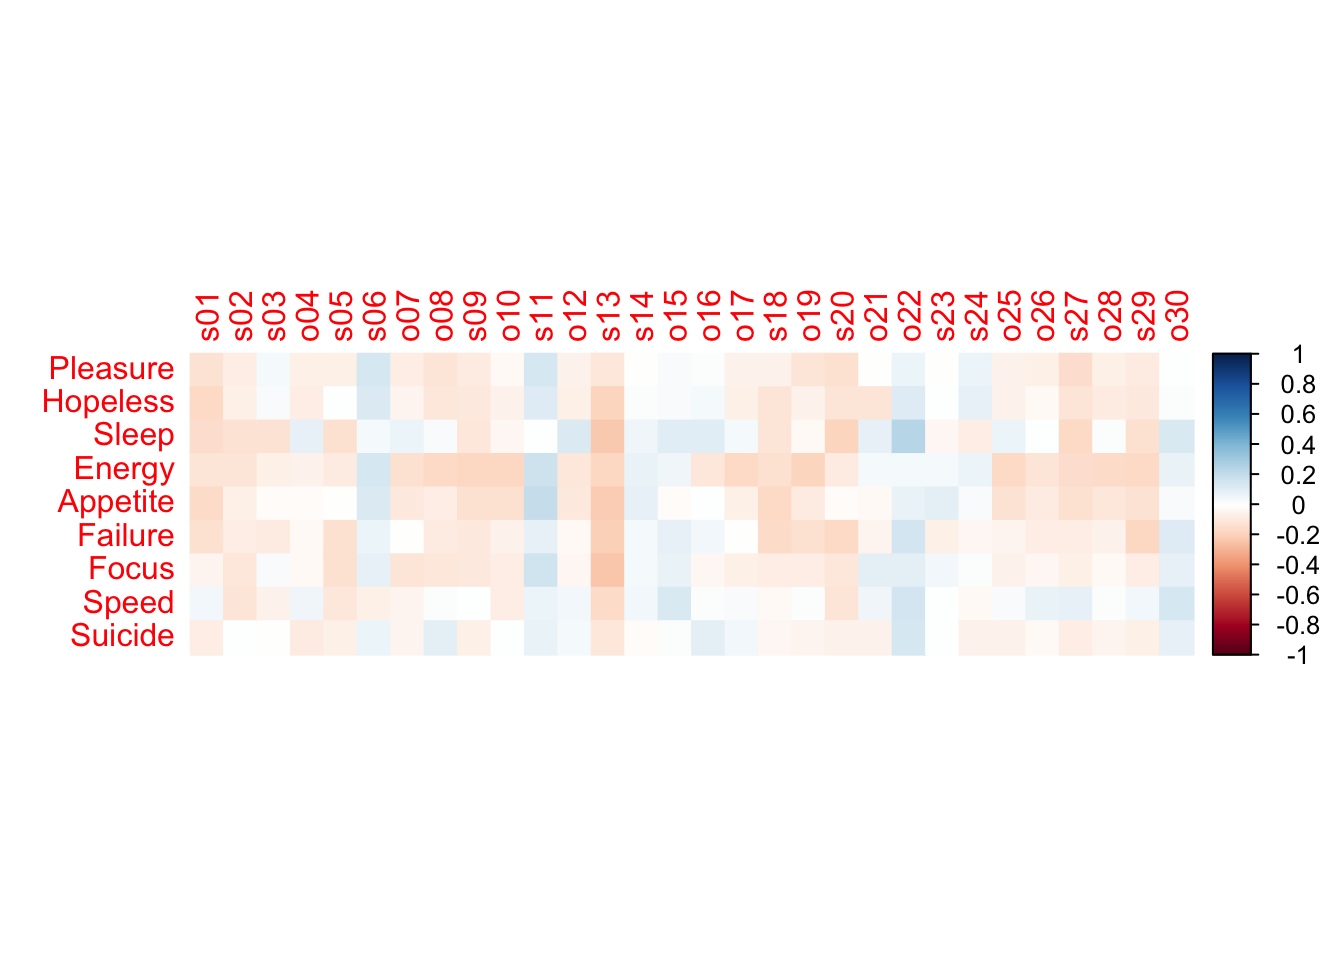
From the correlation plot we can see that the majority of the PHQ is negatively correlated with OSIQ.
6.3 Analysis
resPLSCPHQ <- tepPLS(PHQ, OSIQ,
                scale1 = 'SS1', scale2 = 'SS1',
                DESIGN = GroupingVaribles$memoryGroups,
                graphs =  FALSE)
6.3.1 Scree Plot
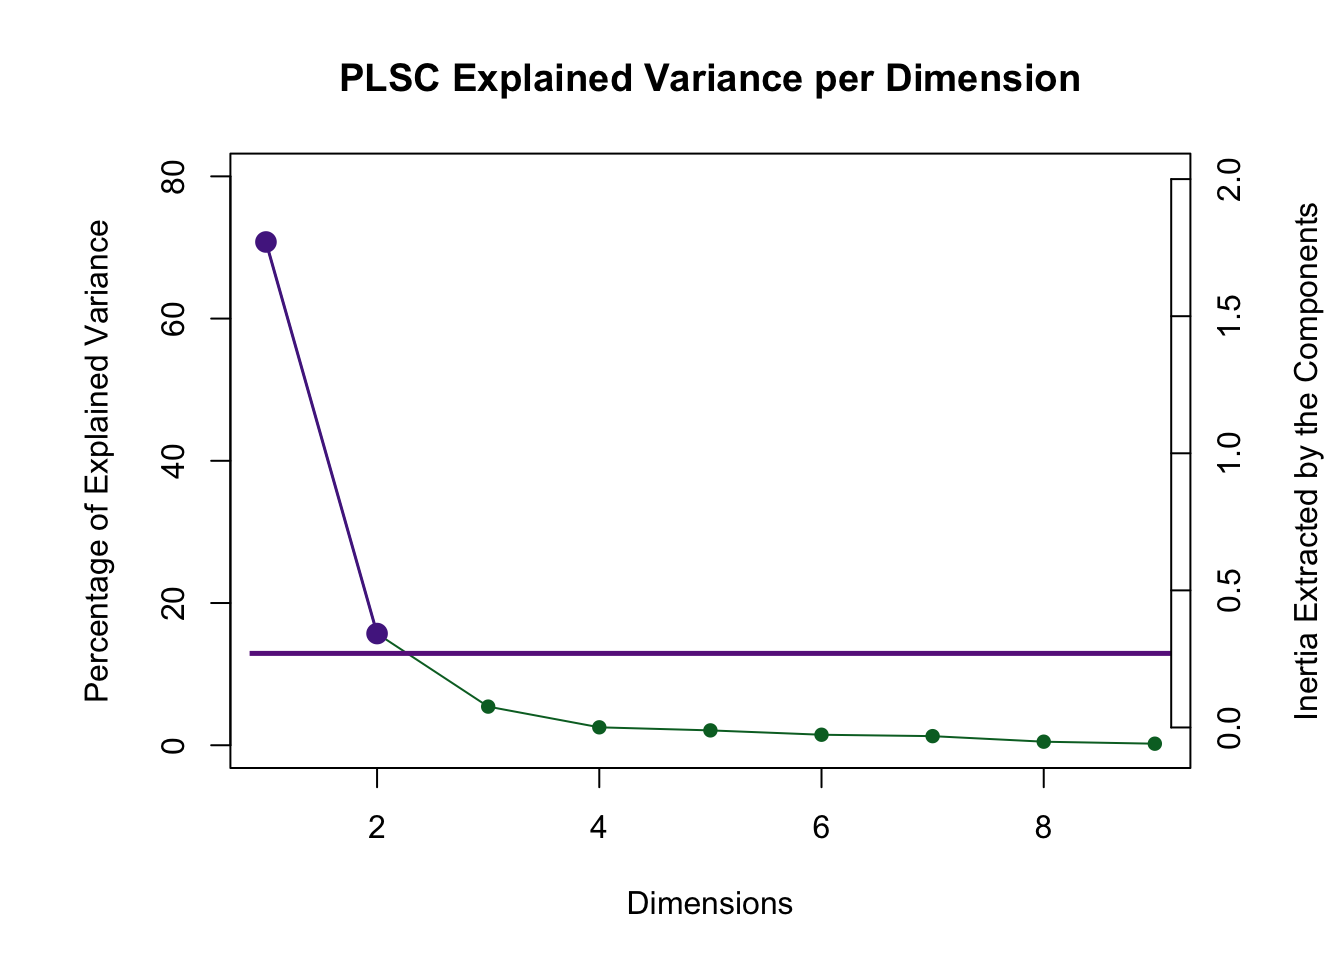
The scree plot shows that the first two dimensions are reliable via the permutation test and they are also above the Kaiser line.
However, PLSC suffers from a strange null hypothesis when testing for reliable dimensions. The null hypothesis is that all variables are zero. That explains why the 7th dimension is “reliable.”
6.3.2 PHQ and OSIQ Saliences
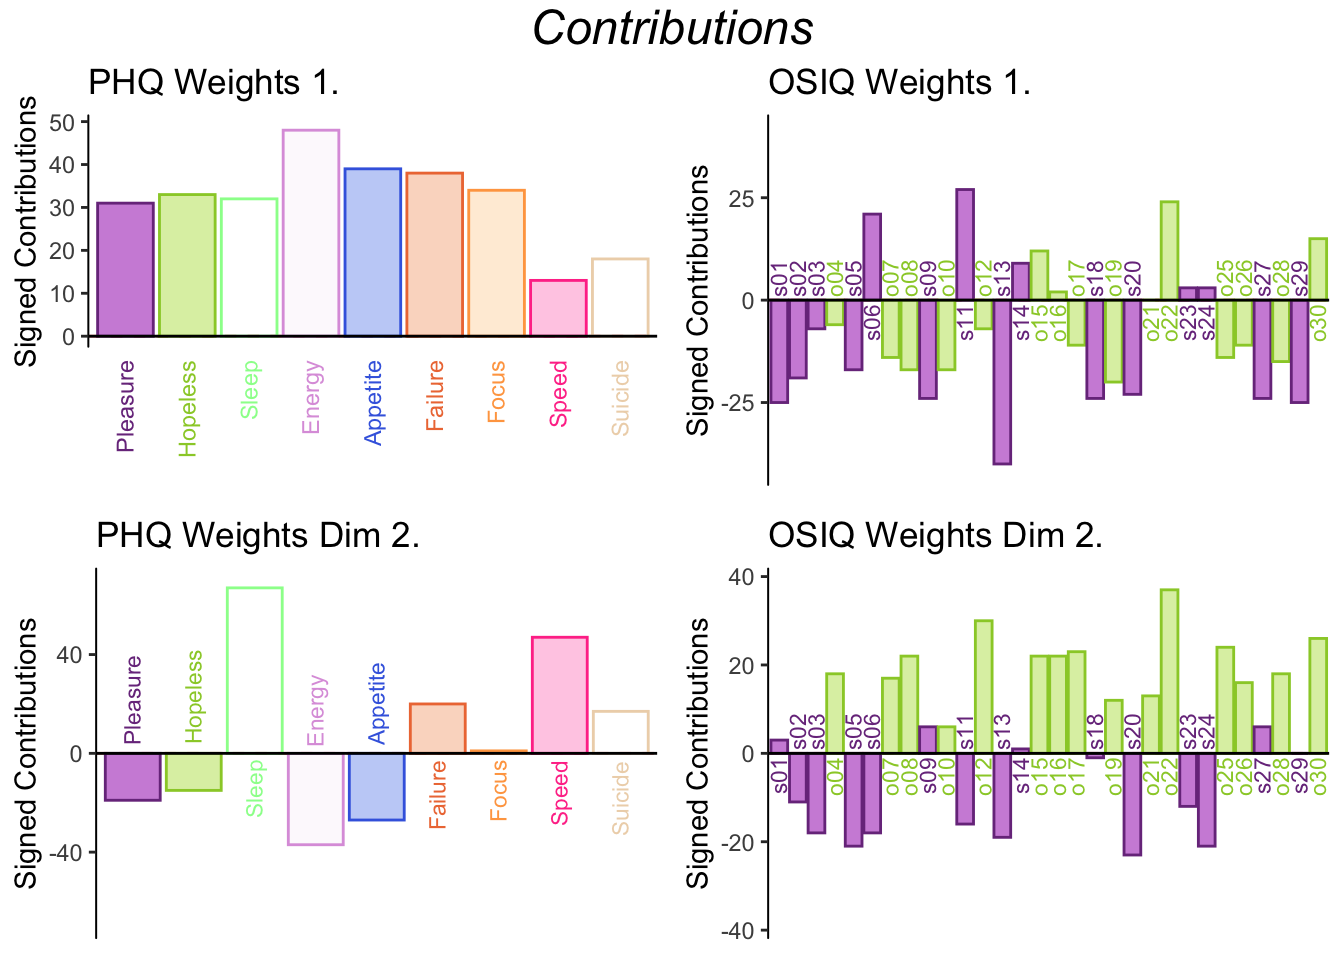
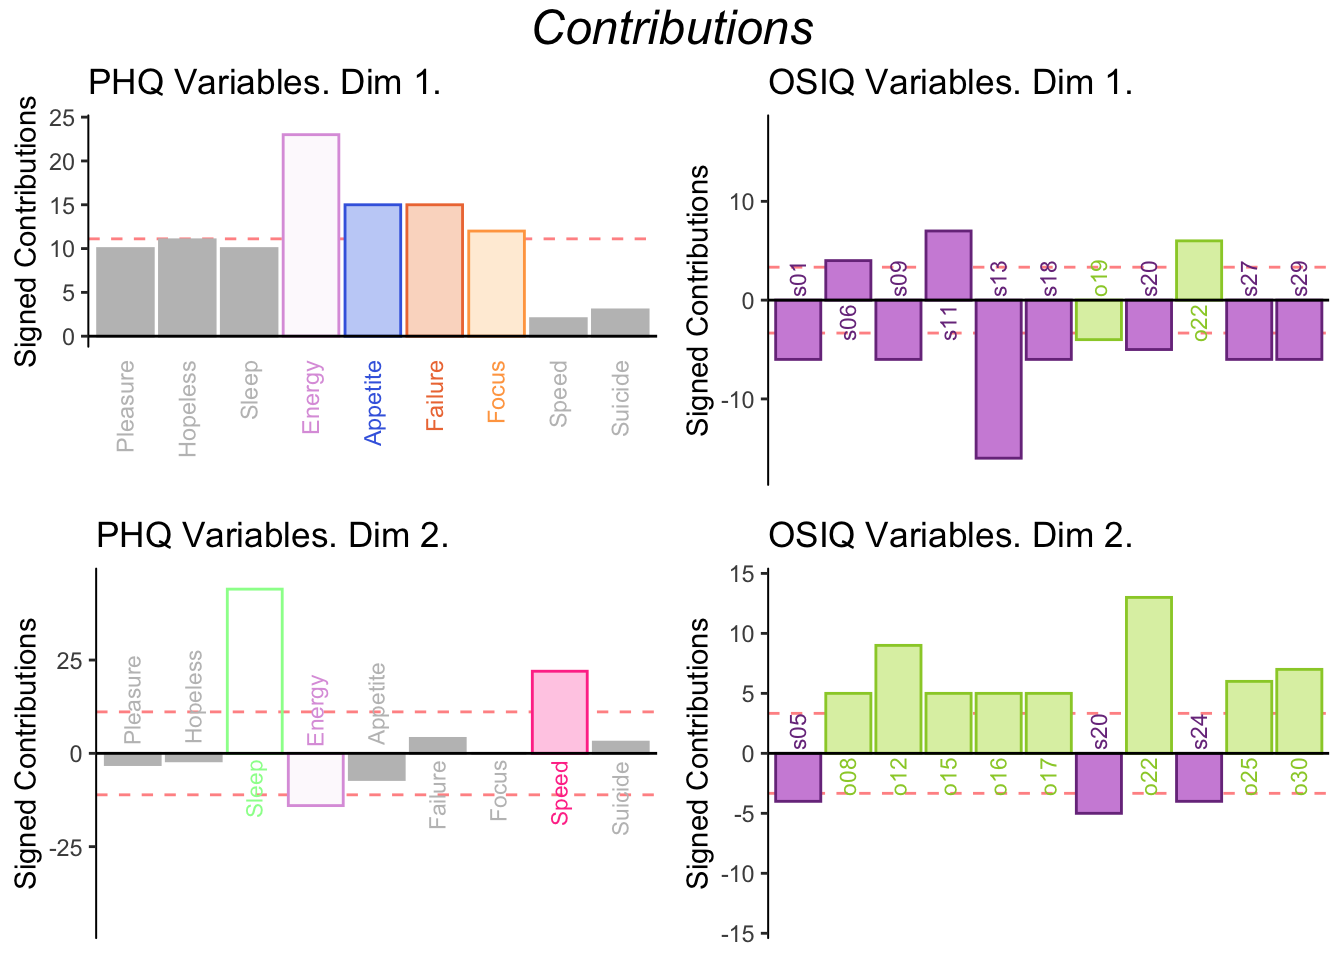
The weights of each table show the proportion of each variable when making the latent variables.
Dimension 1: PHQ weights are positively contributing to the Lx 1 and most of the OSIQ variables are are negatively contributing to Ly 1, which is similar to what was shown in the correlation plot.
Dimension 2: Sleep, Failure, Focus, Speed, and Suicide are positively contributing to Lx 2 and the object questions are postively contributing to Ly 2.
Pleasure, Hopeless, Energy, Appetite are negatively contributing to Lx 2 as well as most of the spatial questions for Ly 2.
6.3.3 Latent Variables
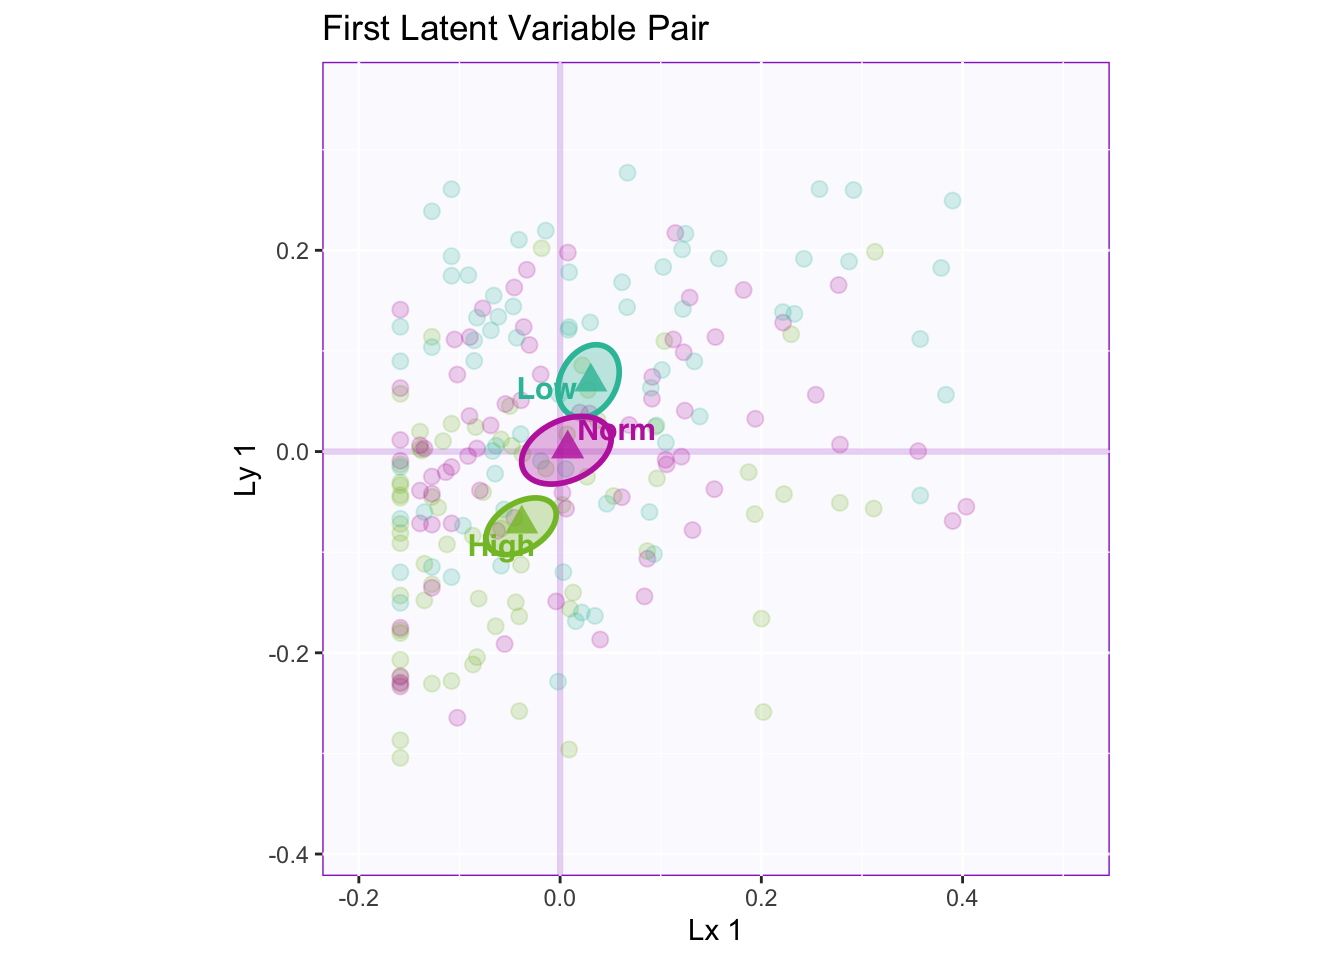
Lxy 1: The first latent variable pair shows that there is a reliable separation between high memory and normal/low. Both latent variables are contributing to this separation via the angle between the means approaching 45 degrees.
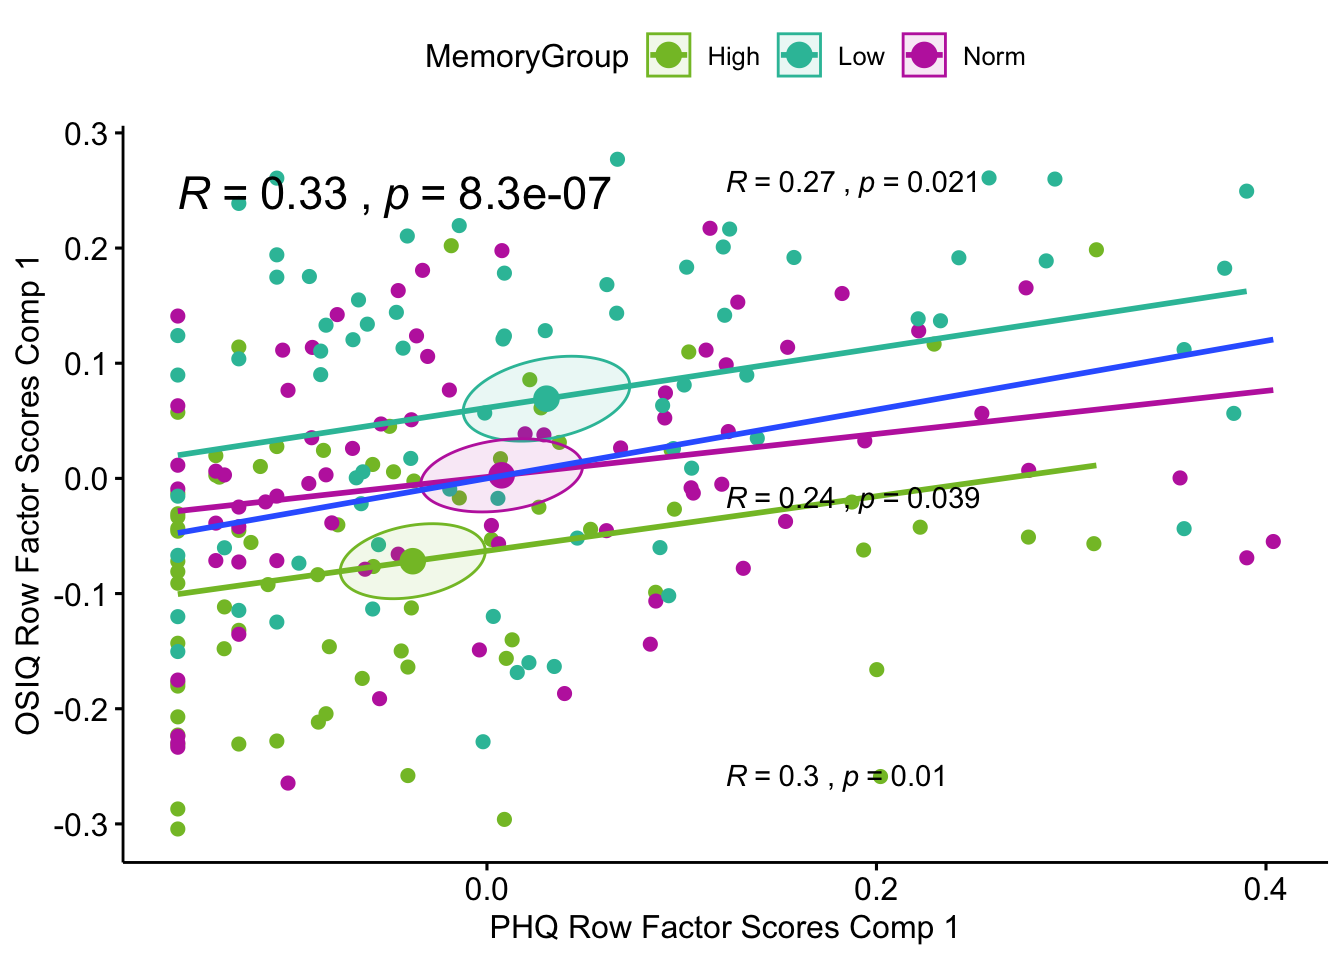
Lxy 1 Correlation Plot: Here the confidence intervals are computed by FactoMineR and they show similar separation. The overall correlation between the tables when analyzing the design varaible i.e. memory groups, is a significant correlation of .33 (blue regression line). There are also significant correlations within each group: .27 for low memory, .24 for normal memory, and .30 for high meomry.
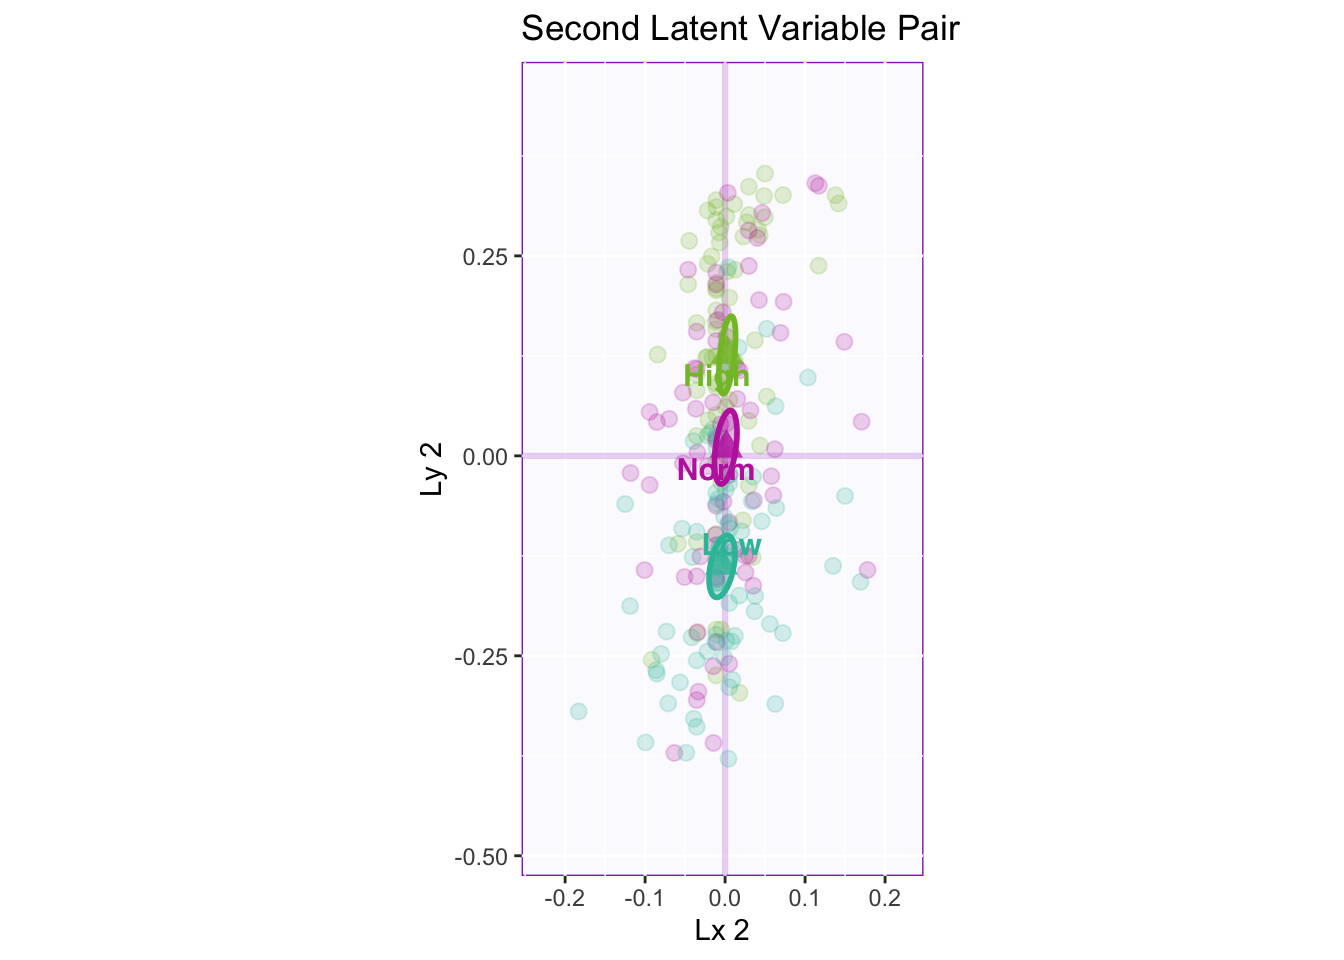
Lxy 2: The second latent variable pair shows that there is a reliable separation between all three groups. The contribution for this separation is lying on lx 2 (PHQ).
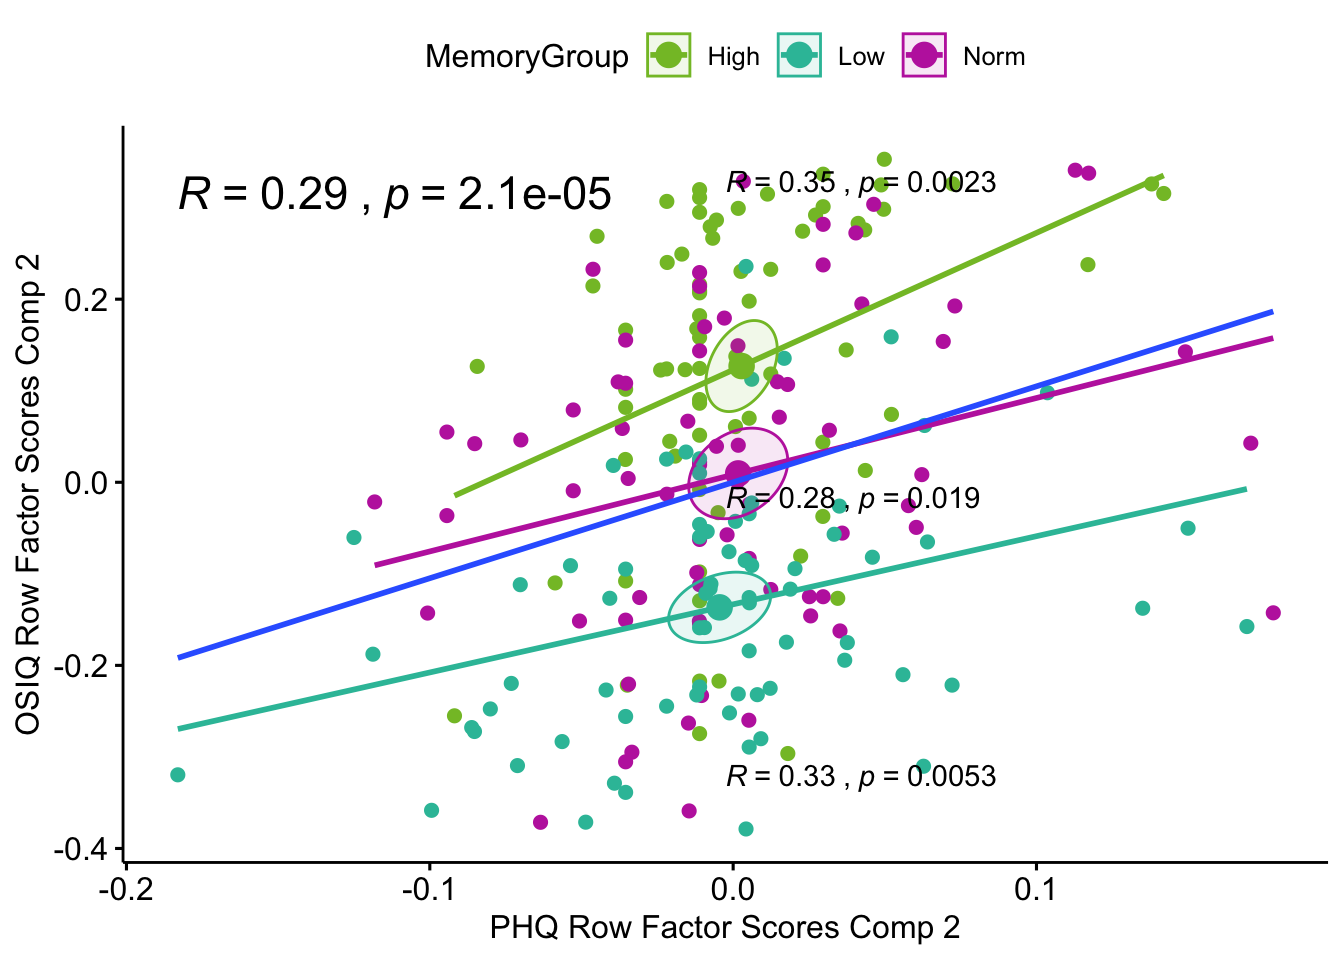
Lxy 2 Correlation Plot: Here the confidence intervals are similar to the previous plot. There are significant correlations all around .29 for overall correlation between the tables (blue regression line), .35 for the high memory group, .28 for the normal memory group, and .33 for the low memory group.
6.3.4 Contributions for PLSC
6.3.5 Bootstrap for PLSC
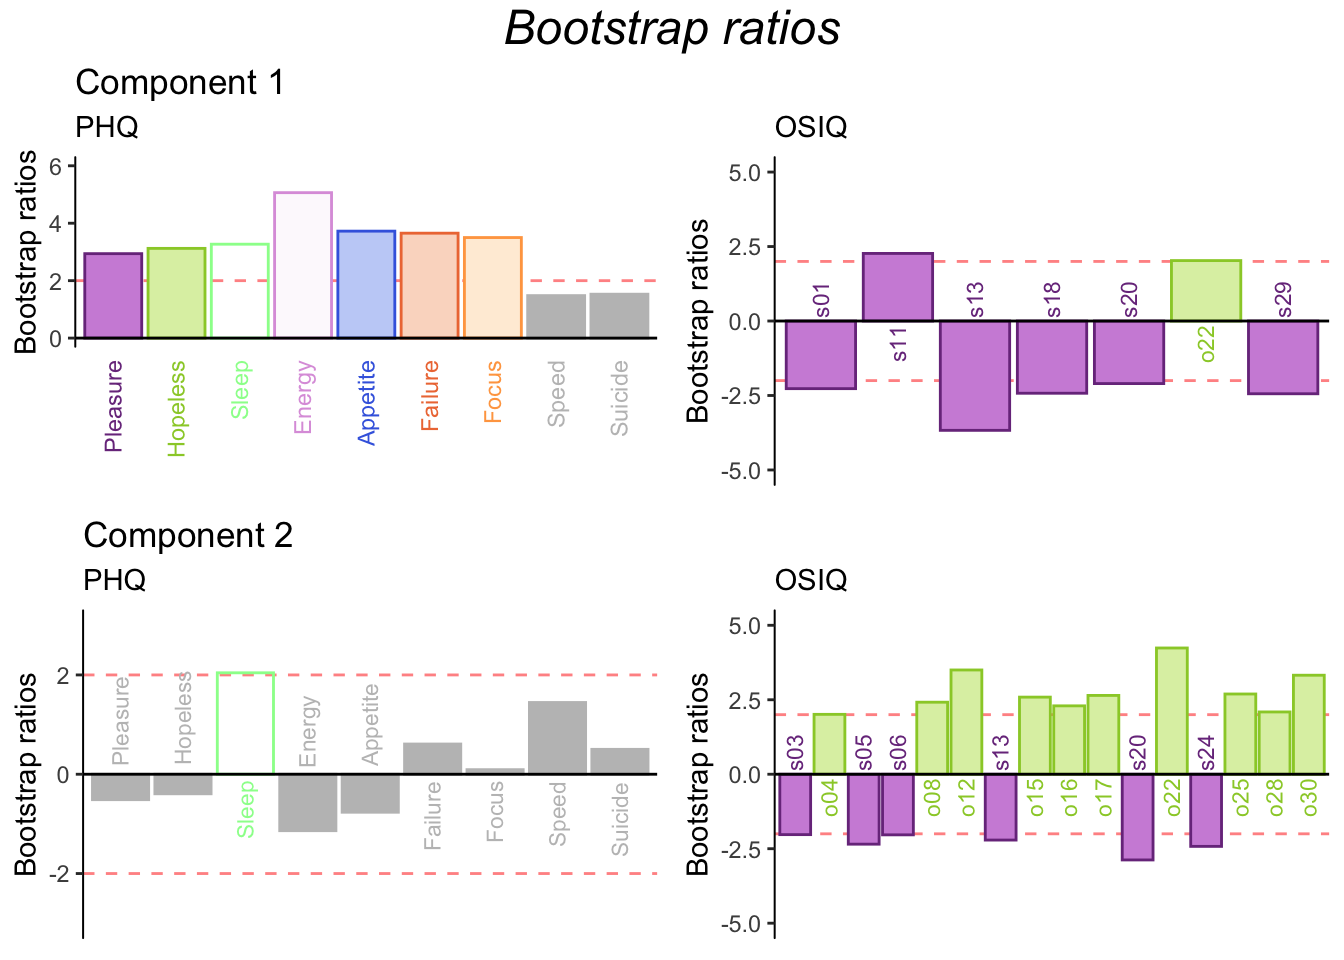
The bootstraps are different from both contributions for dimension 1 and 2.
Dimension 1:
PHQ: Entirely supported.
OSIQ: Analyze the bootstrap ratios when interpreting the reliable contributions.
Dimension 2:
PHQ: Entirely NOT supported.
OSIQ: Entirely supported.
6.4 Summary
When we interpret the factor scores and saliences, the PLSC revealed:
Latent Variable Pairs
Lxy 1: Separating high memory (-) from normal and low memory (+)
Lxy 2: Separates high (+), normal (at origin meaning a different dimension is explaining it becasue the origin of the plot is also a dimension due to centering), low (-) memory
Contribution and Boot Interpretations
Dim 1:
Low and normal memory scores higher in energy, appetite, failure, focus as well as scores in spatial question 11, “Mental imagery to solve problems i.e. do not experience spontaneous vivid images,” and object question 22, “Sometimes my images are so vivid and persistant that it is difficult to ignore them.”
High memory scores higher on spatial questions and object (via saliences) i.e. overall imagery.
Dim 2:
When there is a separation between imagery types, the low memory group only scores higher on spatial (4 Q’s).