Chapter 5 Discriminant Correspondence Analysis
Used to assign (classify) participants to a-priori assigned groups using nominal data. It first perfroms CA on the sums of the groups’ observations (rows) and then projects the observations and variables into the same space.
It is similar to a perceptron in terms of prediction effectiveness. Similar to MCA the data needs to be binned and disjunctively coded before the analysis.
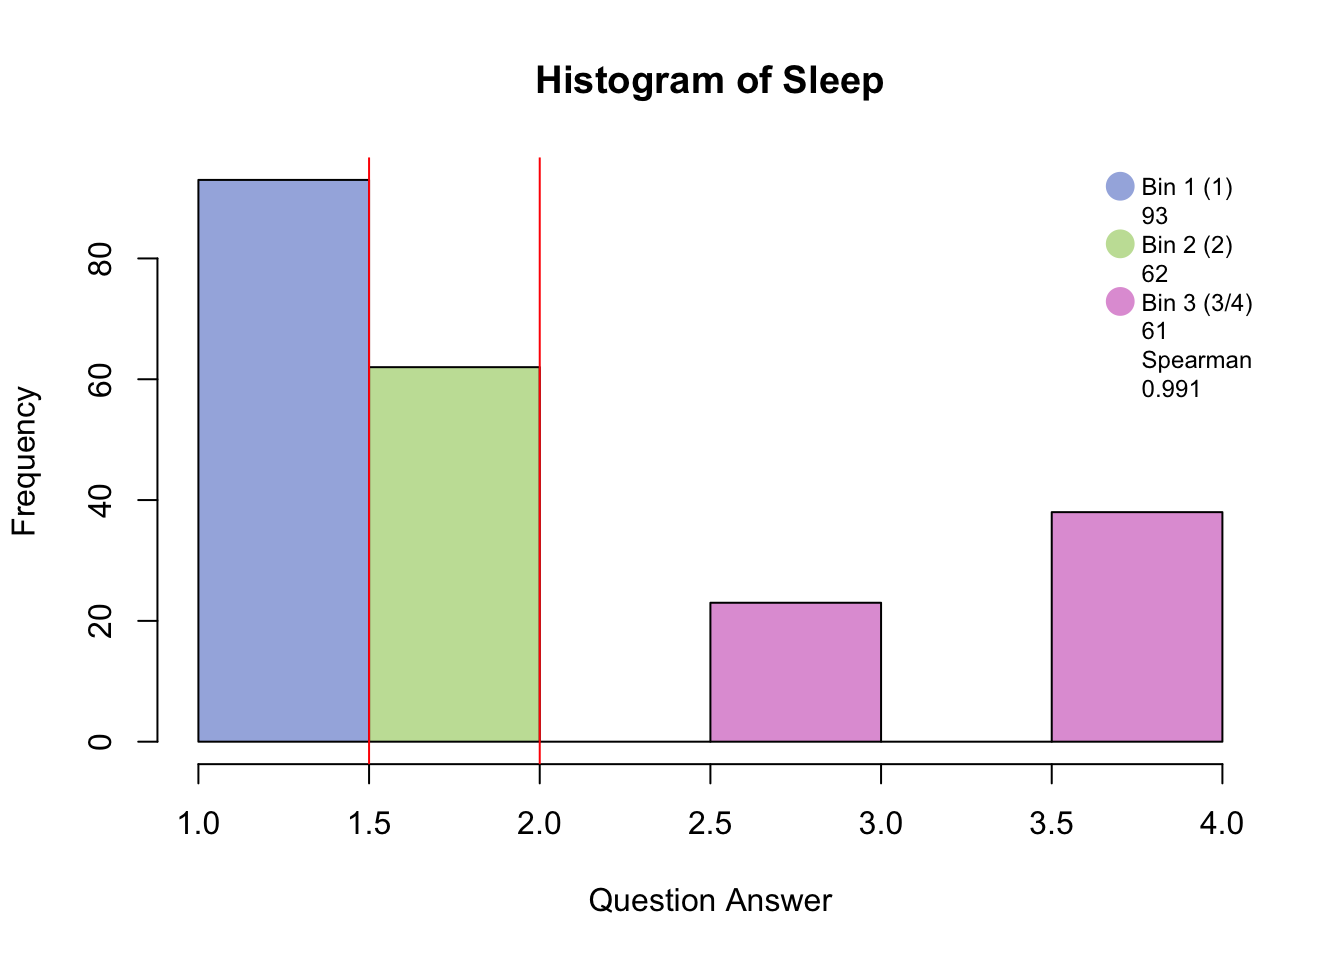
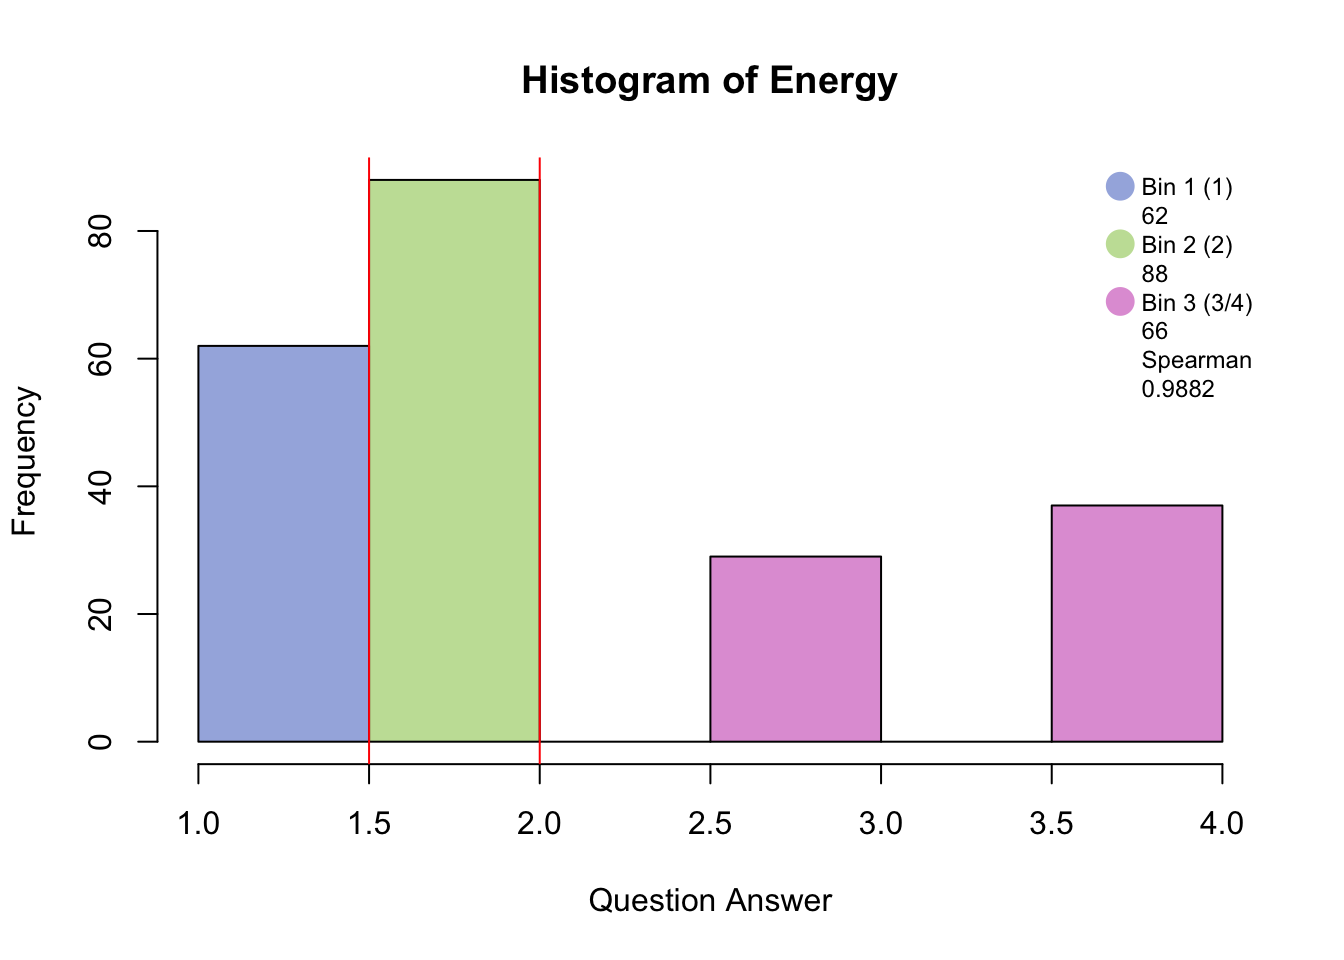
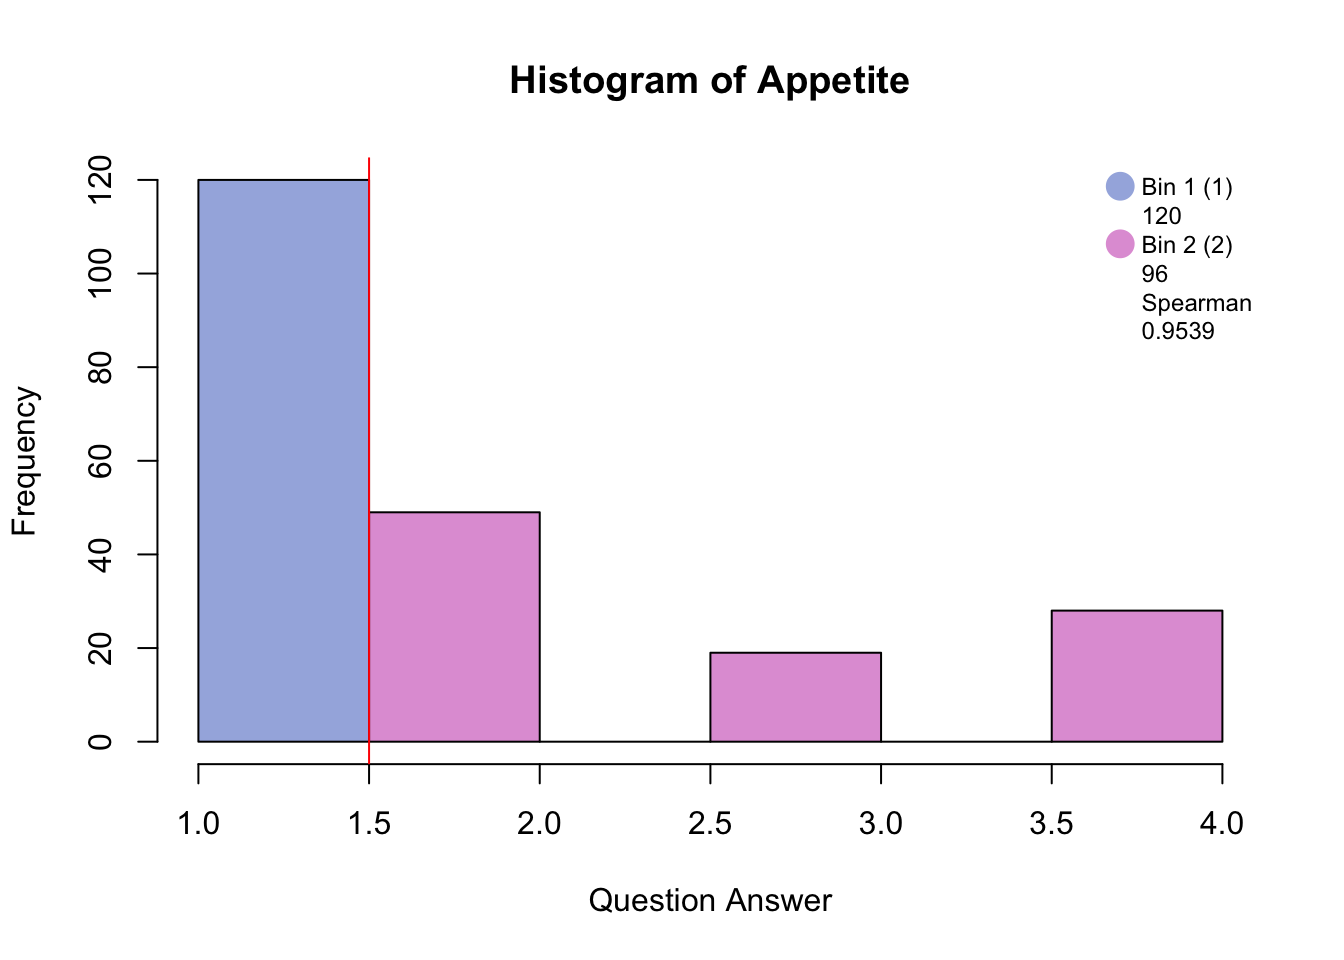
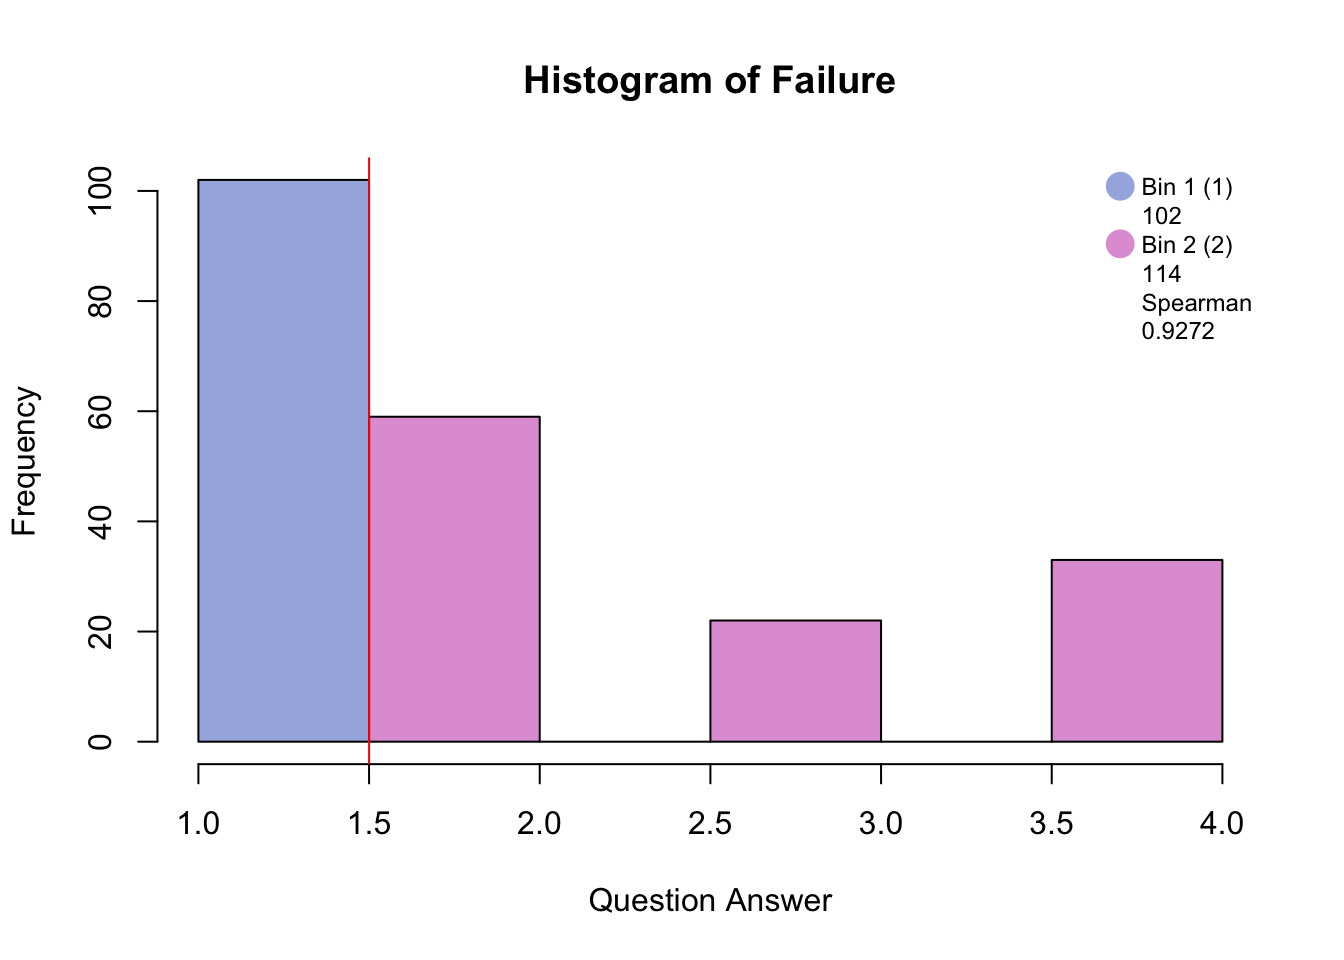
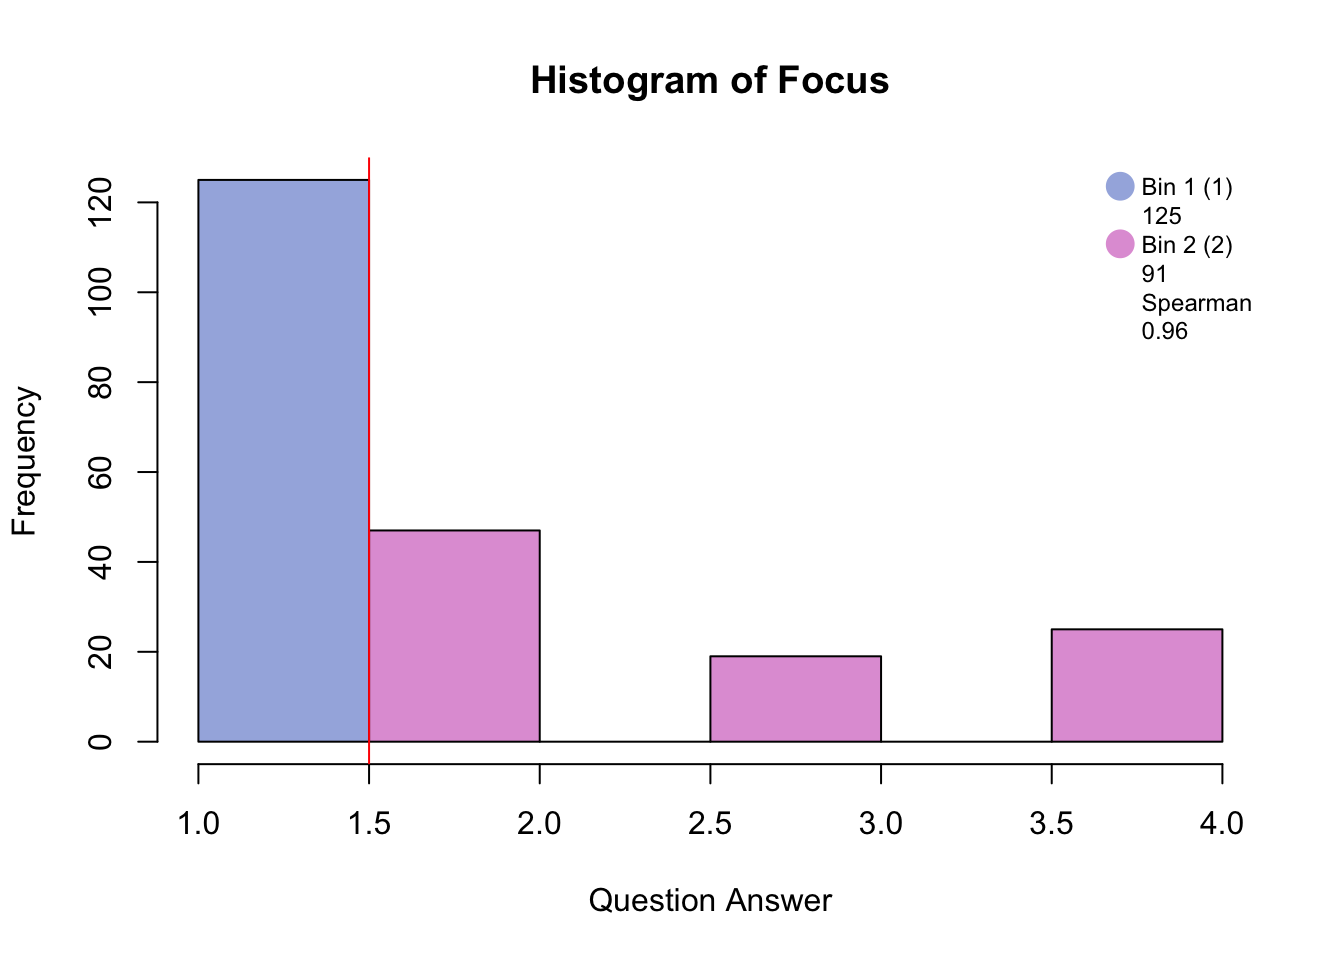
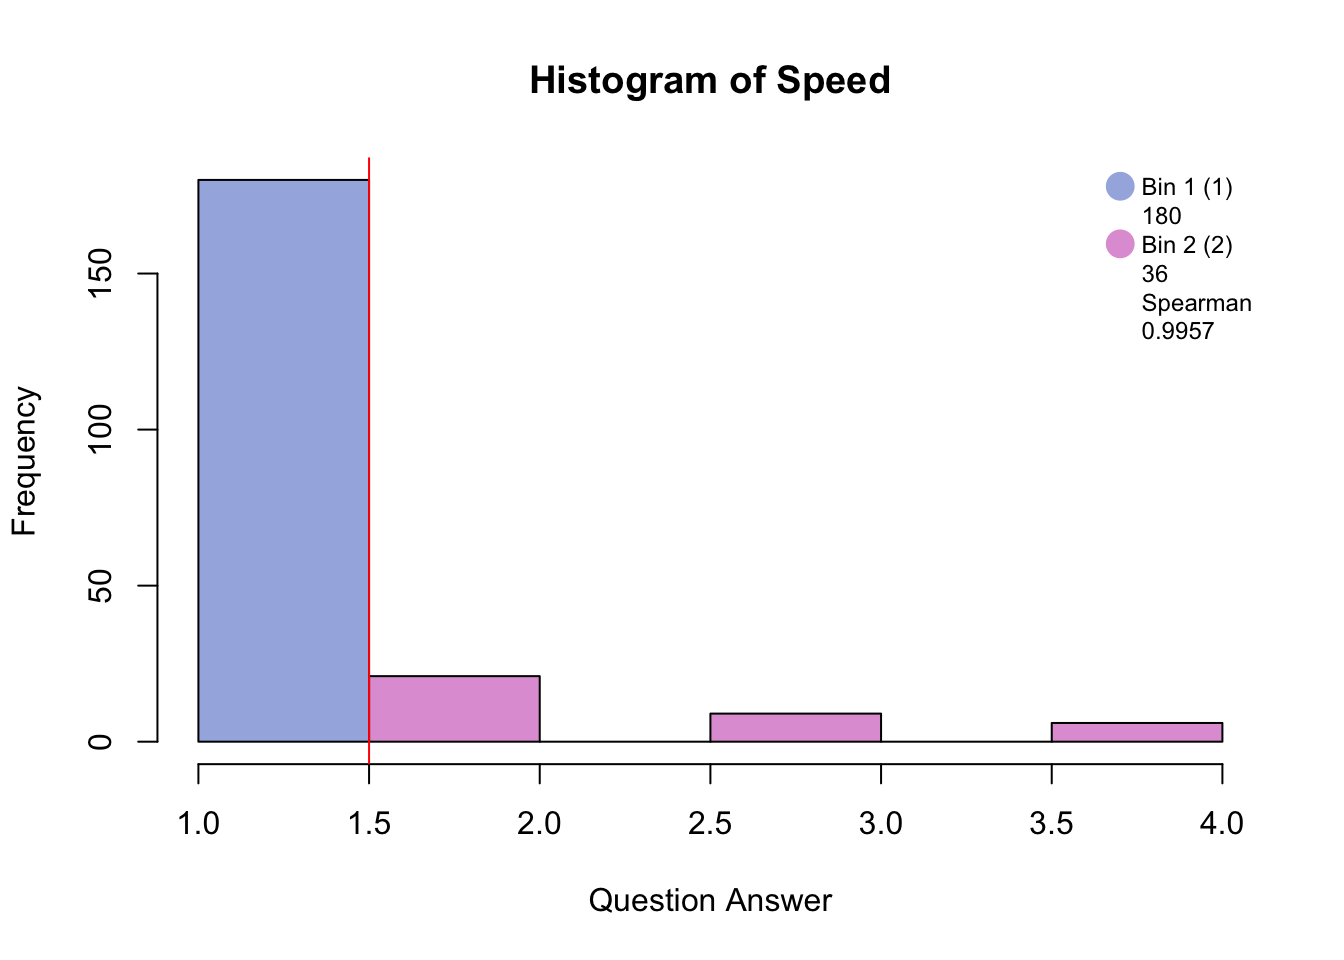
5.1 Binning
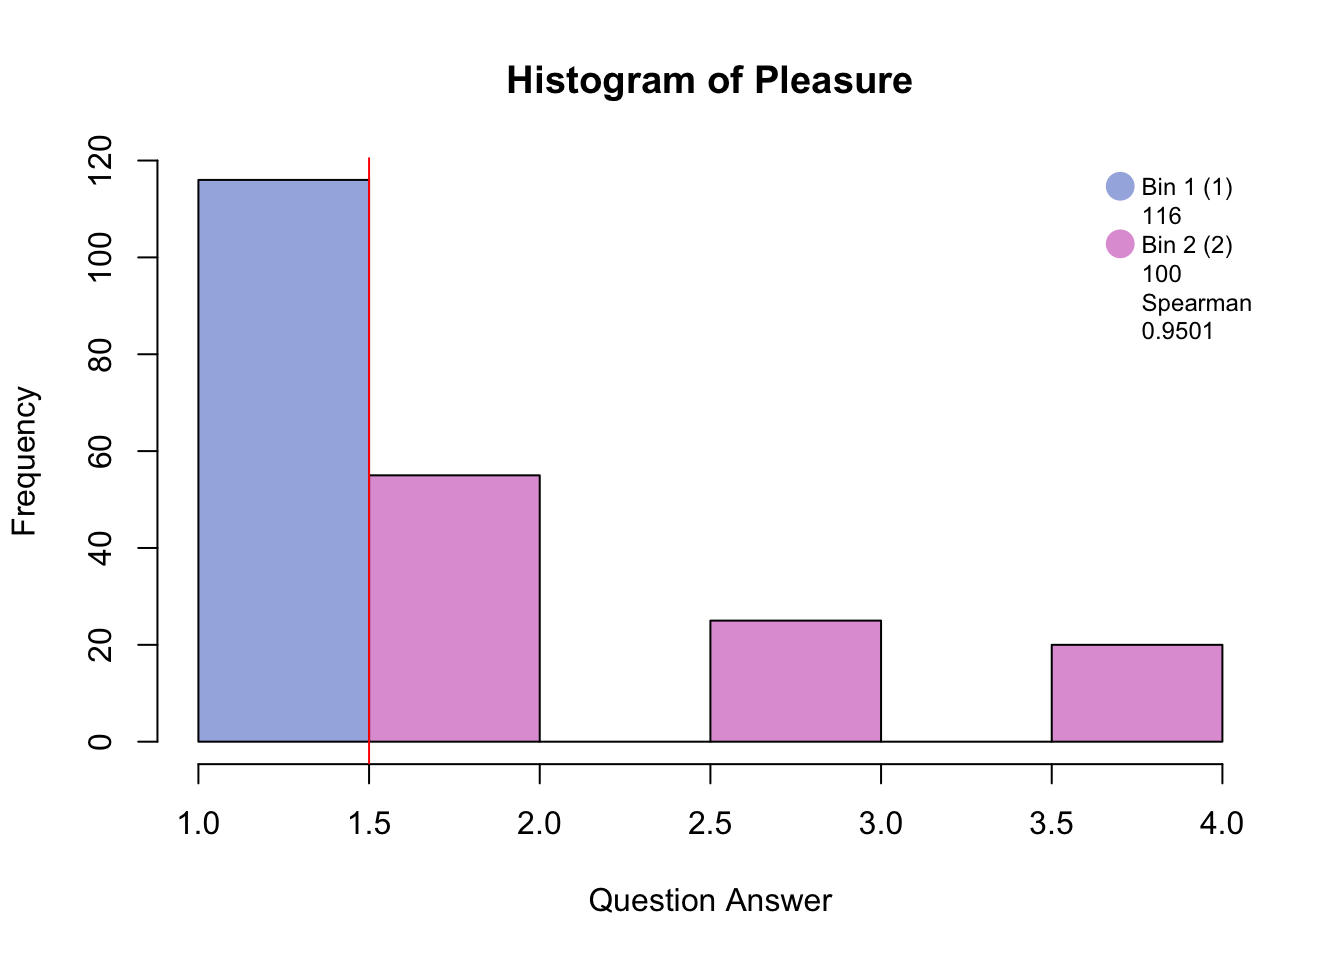
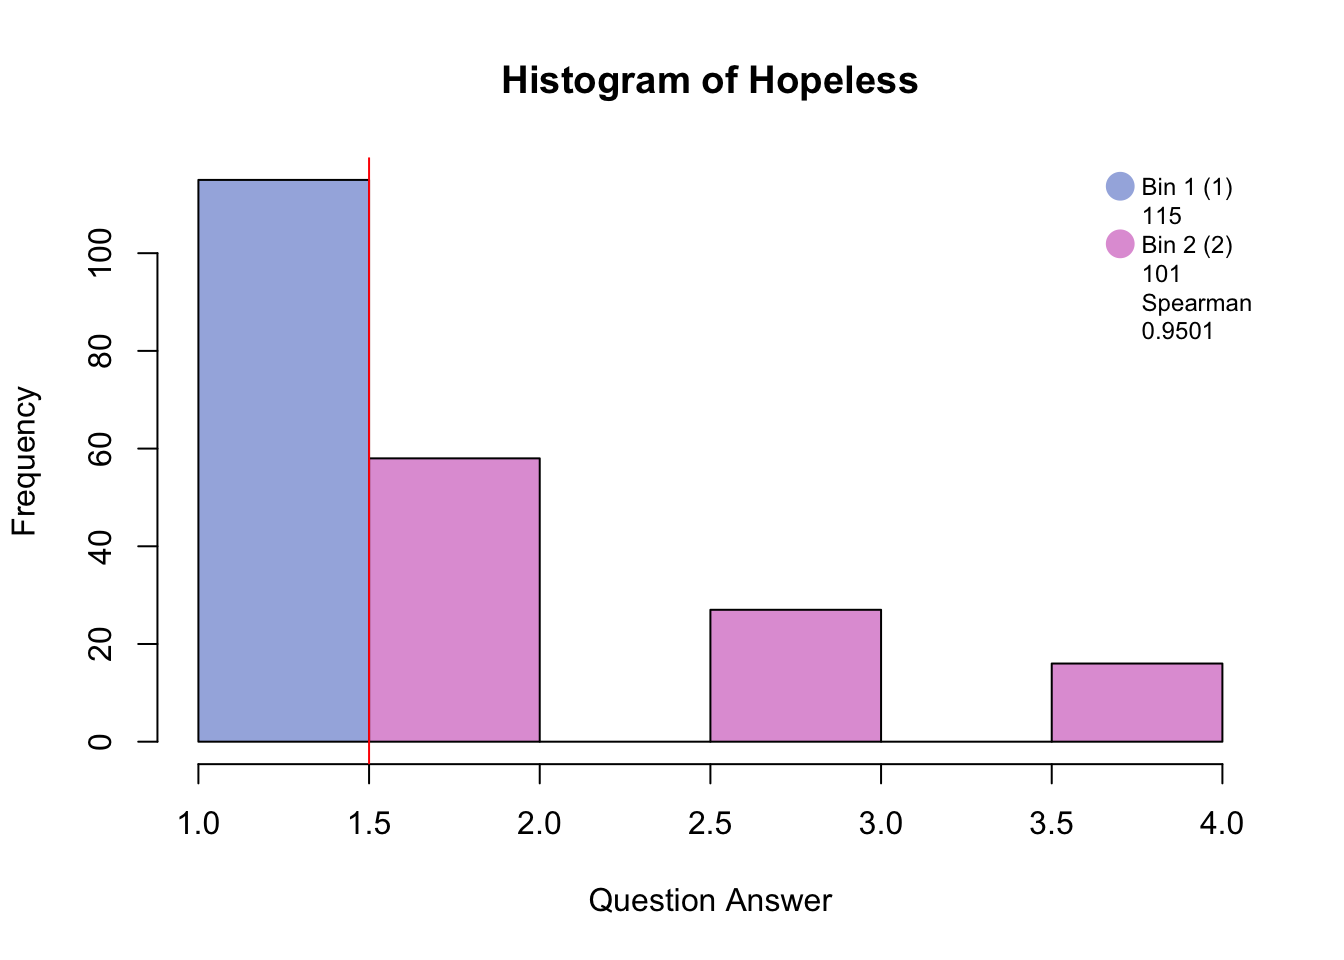
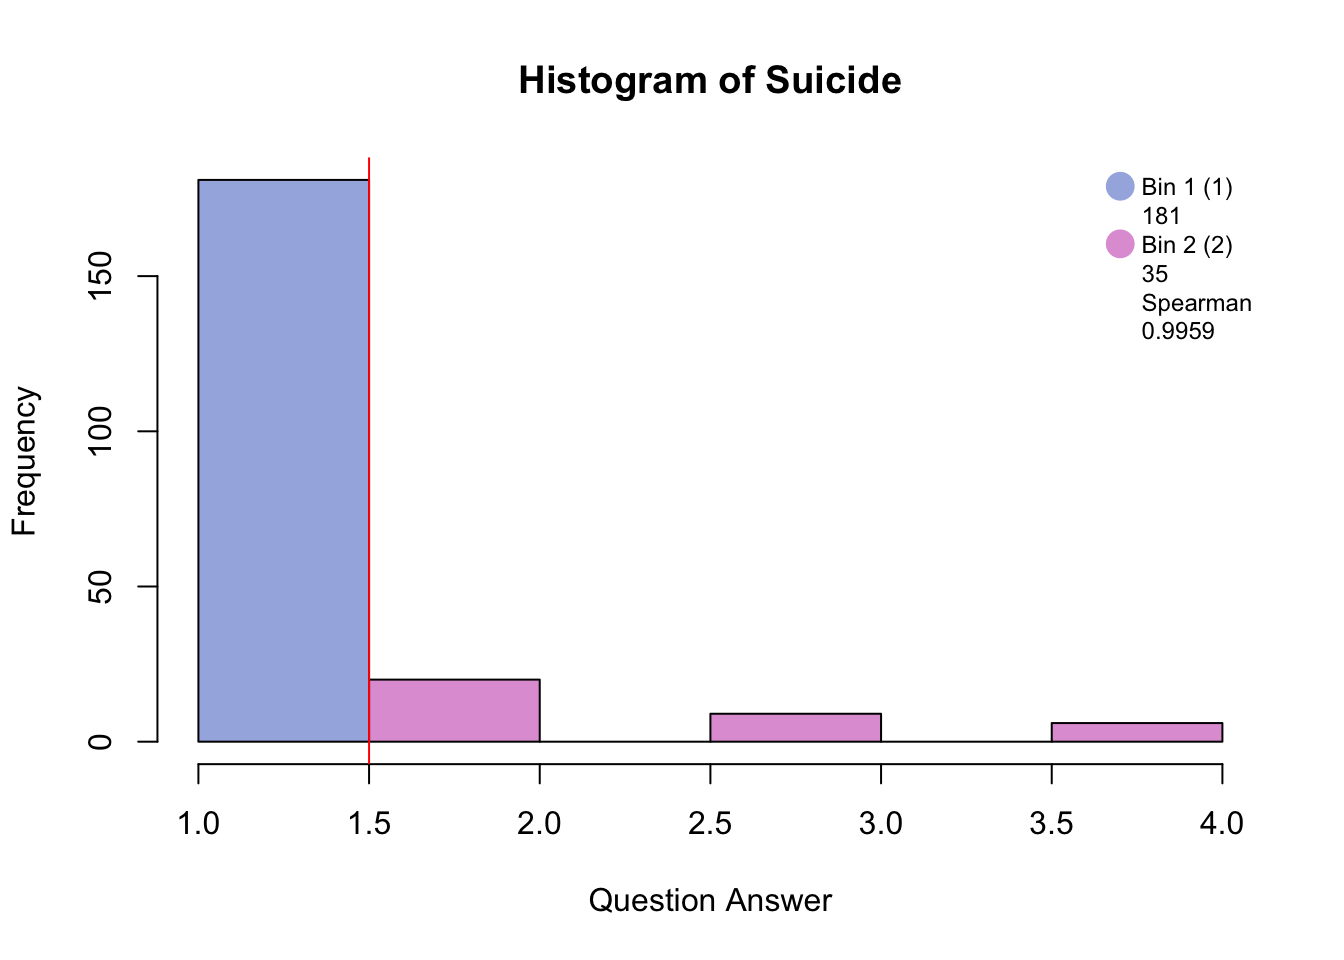
5.2 Data set: PHQ
The Patient Health Questionnaire is a survey that is a preliminary measurement for depression severity.
There are 9 questions (columns) measured on 225 participants (rows).
The descriptors of the pariticpants are memory group, sex, and age. For this analysis I will be using memory group that is either high, normal, or low memory.
5.3 Analysis
MCAdata <- makeNominalData(MCAdata)
resDiCA <- tepDICA(MCAdata,
                make_data_nominal = FALSE,
                DESIGN = GroupingVaribles$memoryGroups,
                graphs = FALSE)

resDiCA.inference <- tepDICA.inference.battery(MCAdata, DESIGN = GroupingVaribles$memoryGroups, graphs = FALSE, make_data_nominal = FALSE )
## [1] "It is estimated that your iterations will take 0.07 minutes."
## [1] "R is not in interactive() mode. Resample-based tests will be conducted. Please take note of the progress bar."
## ===========================================================================5.4 The Data Pattern
5.5 Scree Plot
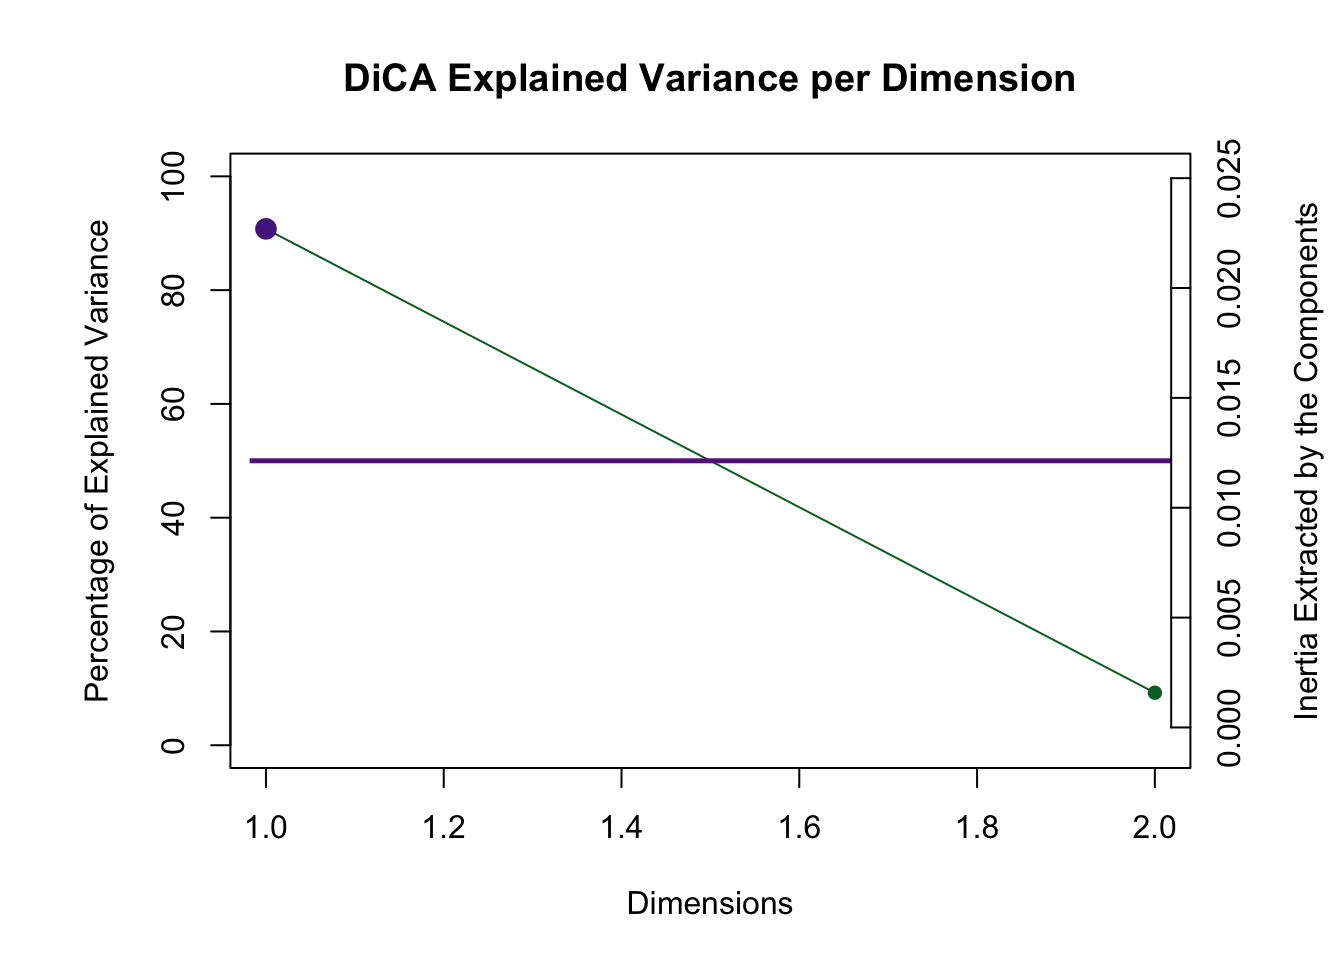
From the scree we can see that the first dimension is reliable and above the Kaiser line.
5.5.1 Row Factor Scores
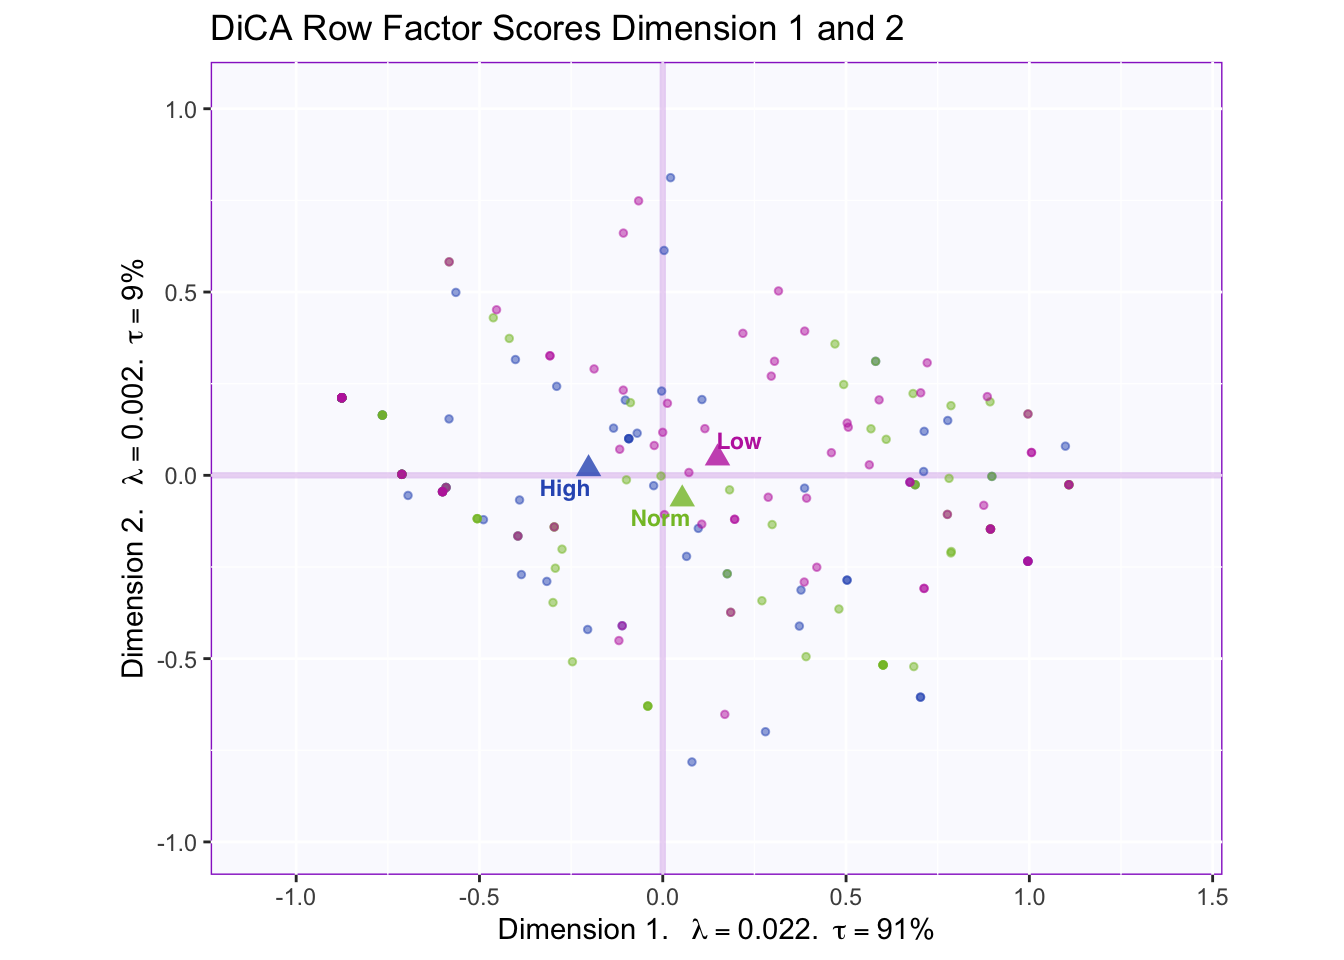
The row factor score map displays a reliable separation between high (-) and low (+) memory groups, but not the normal memory group.
5.5.2 Column Loadings

The column loadings plot shows that Energy.2 (several days) is more likely to be choosen along with “no days” on most of the other questions. Sleep.2 (several days) and Sleep.3 (more than half days or higher) is more likely to be choosen with “more than half the days or higher” on most of the other questions.
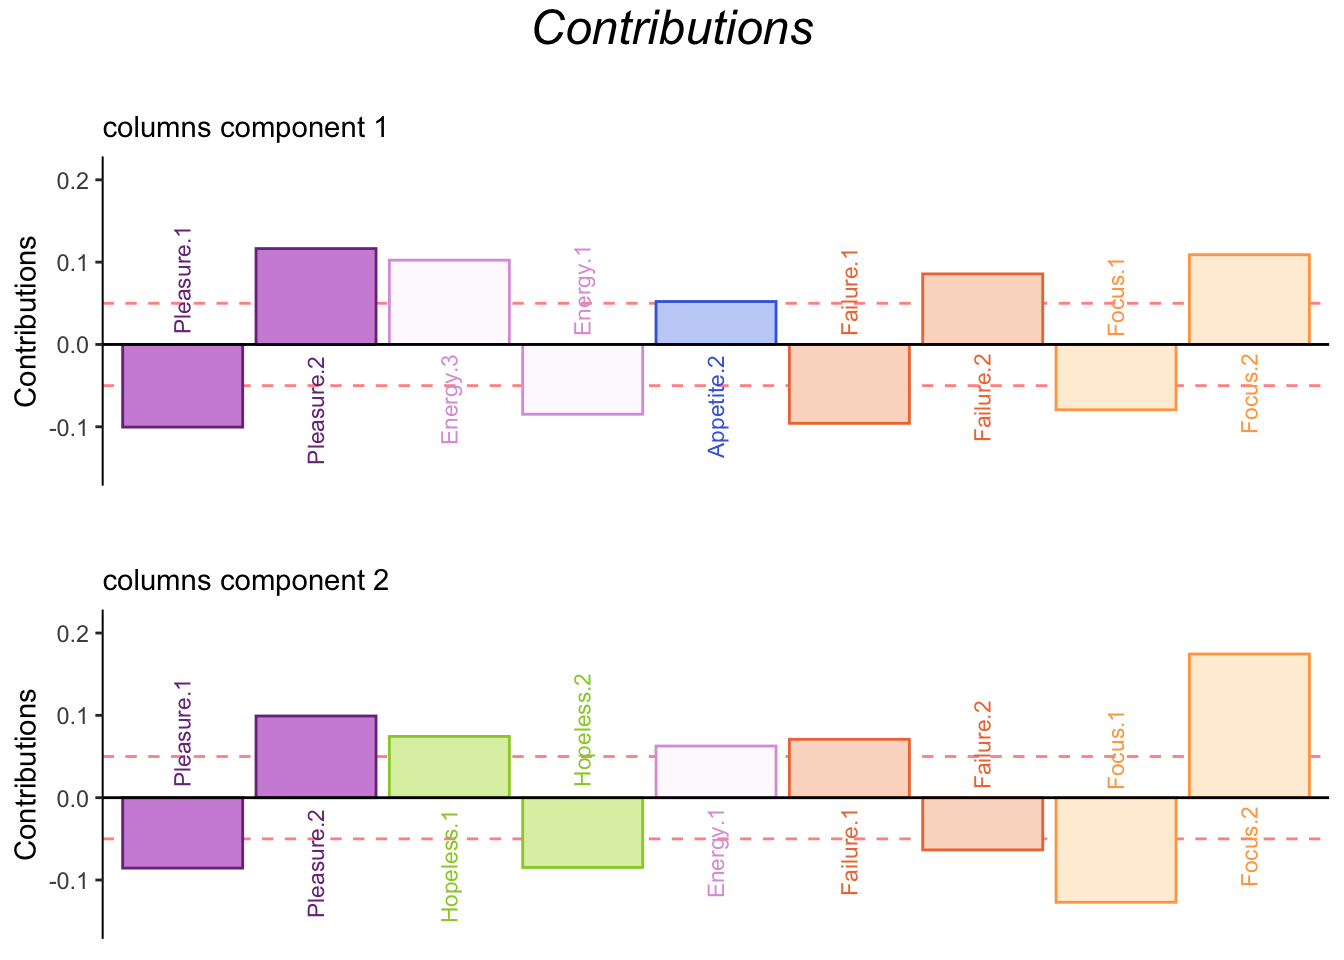
5.5.3 Contributions
5.5.4 Bootstrap Ratios
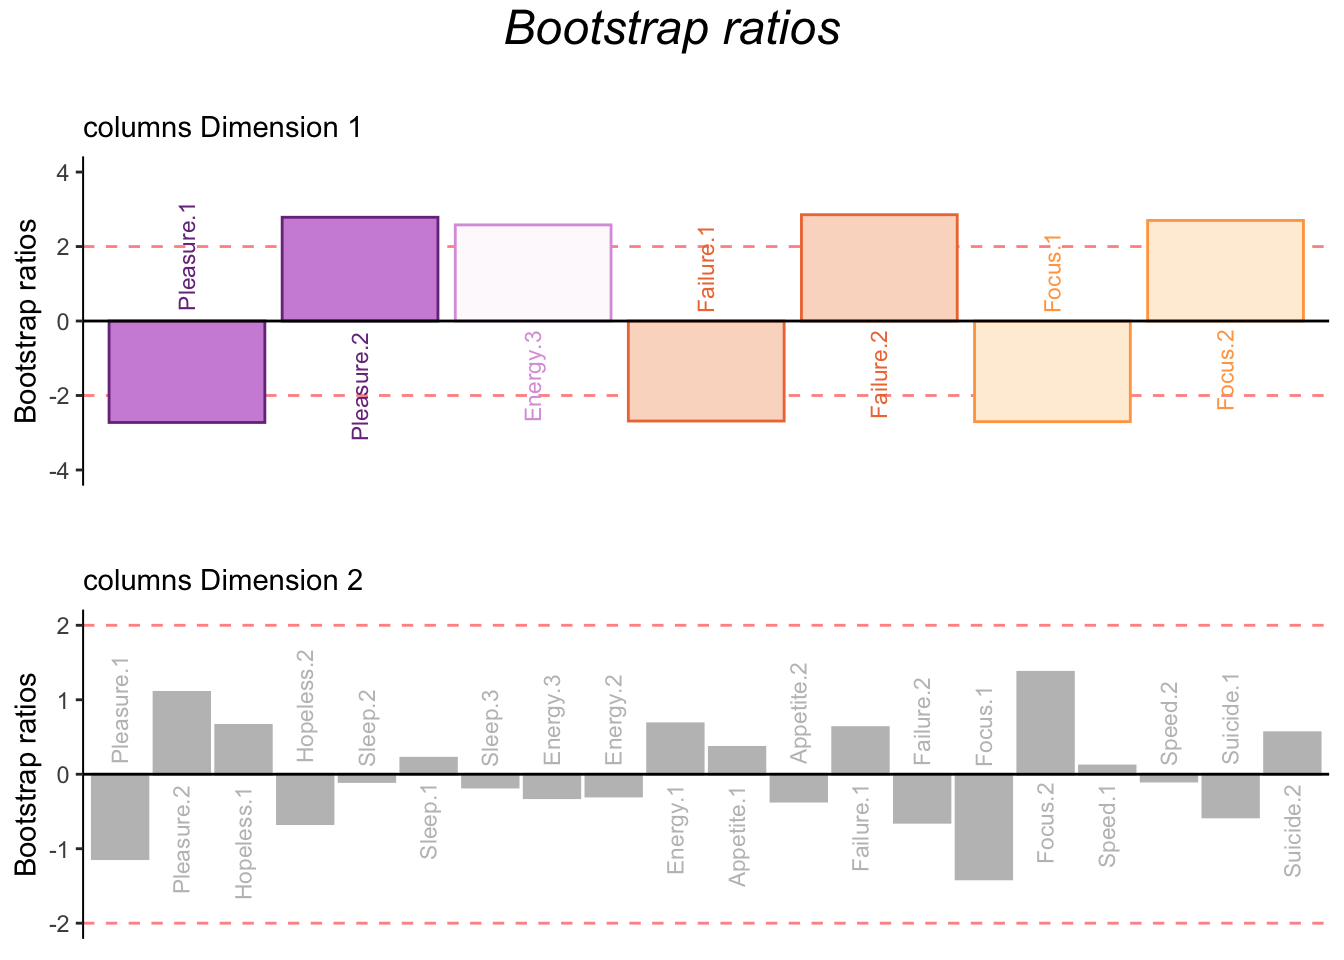
The bootstraps show that the second dimension is not reliable, but the first is.
5.6 DiCA Accuracy
##       .High .Norm .Low
## .High    44    33   24
## .Norm    11    15   11
## .Low 17 24 37## [1] 0.4444444## .High.actual .Norm.actual .Low.actual
## .High.predicted 39 33 25
## .Norm.predicted 16 7 16
## .Low.predicted 17 32 31## [1] 0.3564815The extreme difference between the fixed effect model and the random effect model (leave-one-out) could be a signal of overfitting in the fixed effect model sinc the random effect model essentially drops to chance.
5.7 Summary
When we interpret the factor scores and loadings together, the DiCA revealed:
Dimension 1:
Rows: High memory (-) vs low memory (-)
Columns interpretation: High memory scores “no days” on pleasure, energy, failure, and focus vs low memory scoring “half days or higher” for pleasure, energy, appetite, failure, and focus. Normal memory groups sees a mixture low and high memory scores.
Component 2
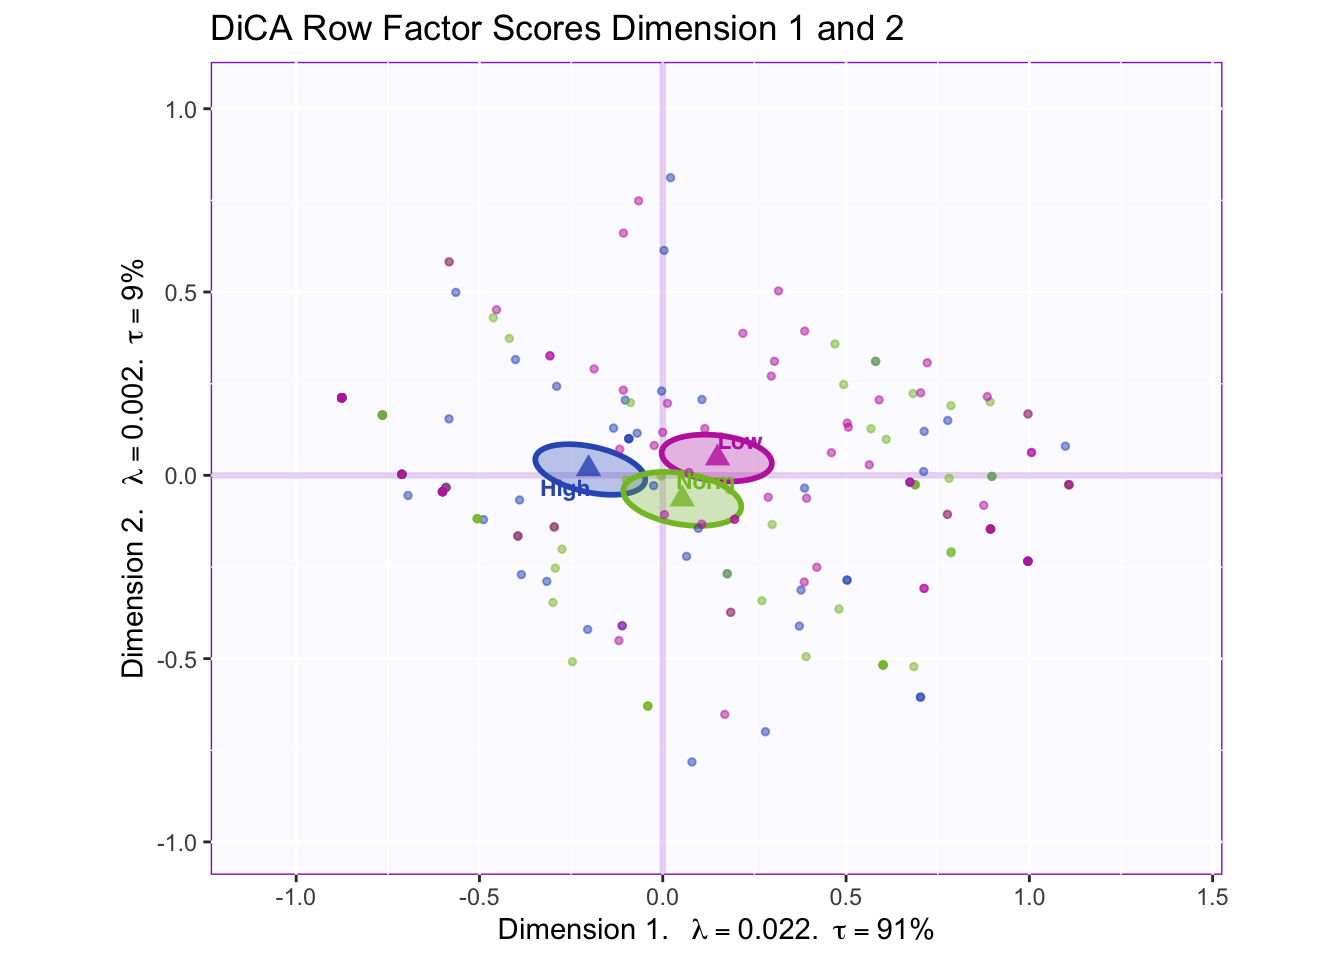
Rows: Confidence intervals overlap I.e. not reliable
Columns interpretation: bootstraps show that nothing contributing in this dimension is reliable