Chapter 2 Barycentric Discriminant Analysis
Used to assign (classify) participants to a-priori assigned groups using quantitative data. It first performs PCA on the Barycenters and then projects the observations and variables back into the same space. The Barycenters are the means of groups’ observations.
It is similar to a perceptron in terms of prediction effectiveness. It handles the “p>>n” problem where the data has many more variables than observations.
2.1 Data set: PHQ
The Patient Health Questionnaire is a survey that is a preliminary measurement for depression severity.
There are 9 questions (columns) measured on 225 participants (rows).
The descriptors of the pariticpants are memory group, sex, and age. For this analysis I will be using memory group that is either high, normal, or low memory.
2.2 Analysis
resBADA <- tepBADA(PHQ, DESIGN = GroupingVaribles$memoryGroups, scale = FALSE,
                   graphs = FALSE)

# Inferences ----
#set.seed(70301) # we have a problem with the inference part
  # it will be addressed soon. In the meantime we fix the seed
  # for random
nIter = 50
resBADA.inf <- tepBADA.inference.battery(PHQ, scale = FALSE,
                  DESIGN = GroupingVaribles$memoryGroups,
                  test.iters = nIter,
                  graphs = FALSE)
## [1] "It is estimated that your iterations will take 0.06 minutes."
## [1] "R is not in interactive() mode. Resample-based tests will be conducted. Please take note of the progress bar."
## ===========================================================================2.2.1 Scree Plot
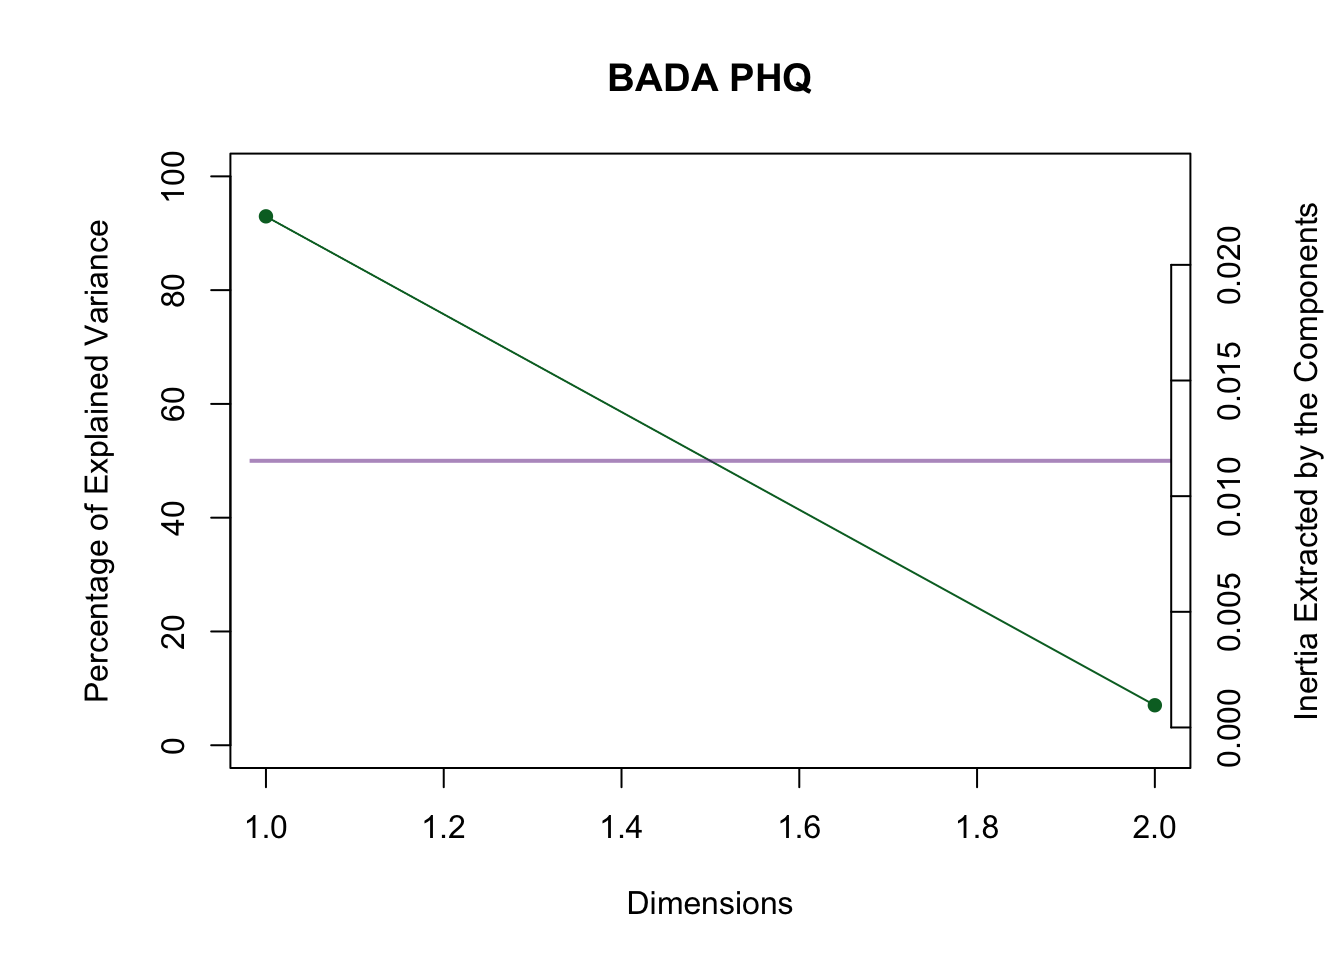
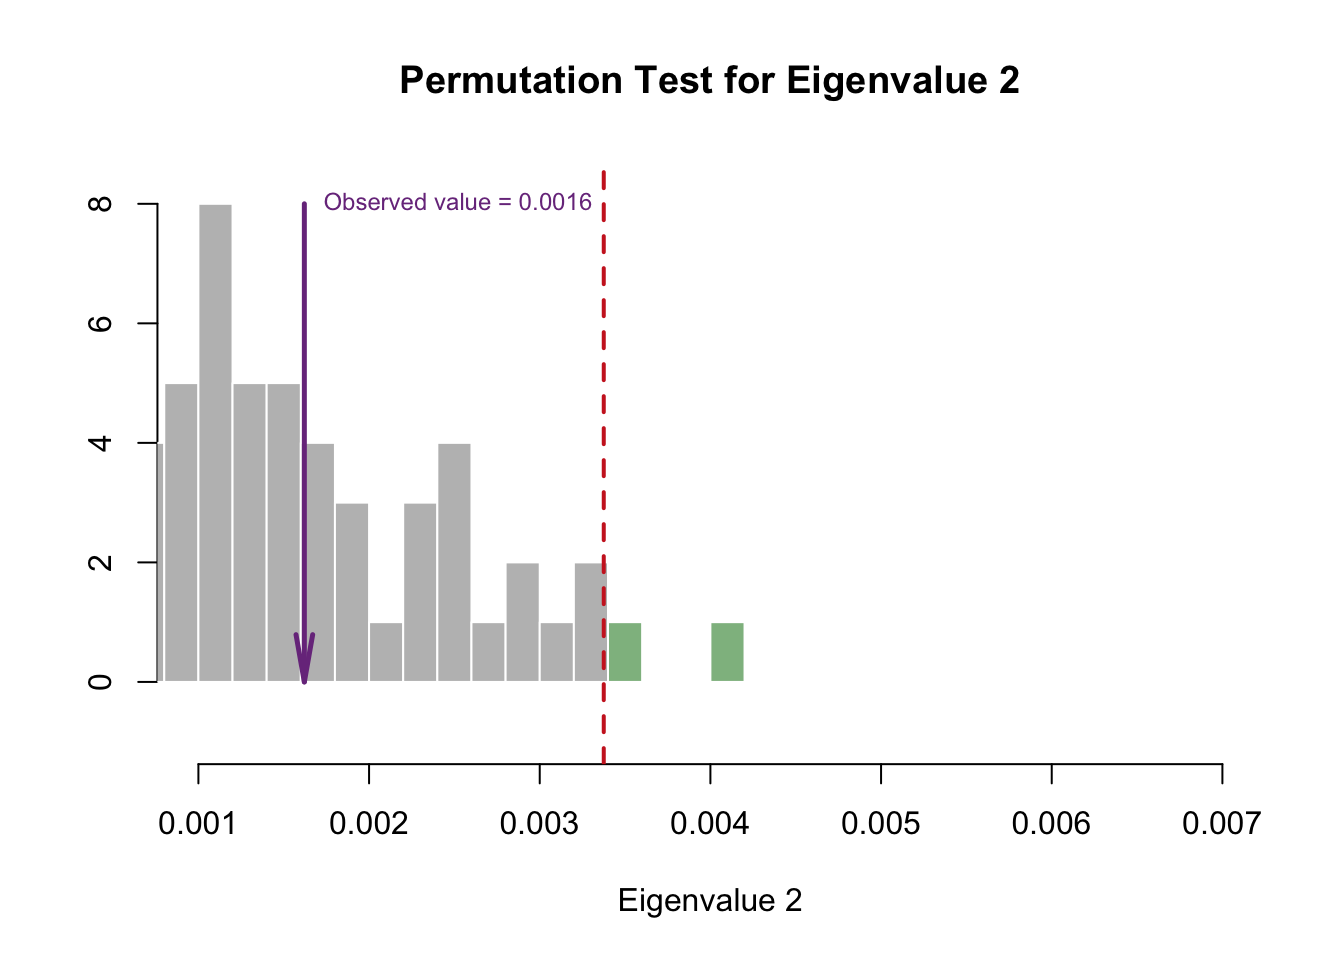
2.2.2 Permutation Tests for Significant Eigenvalues
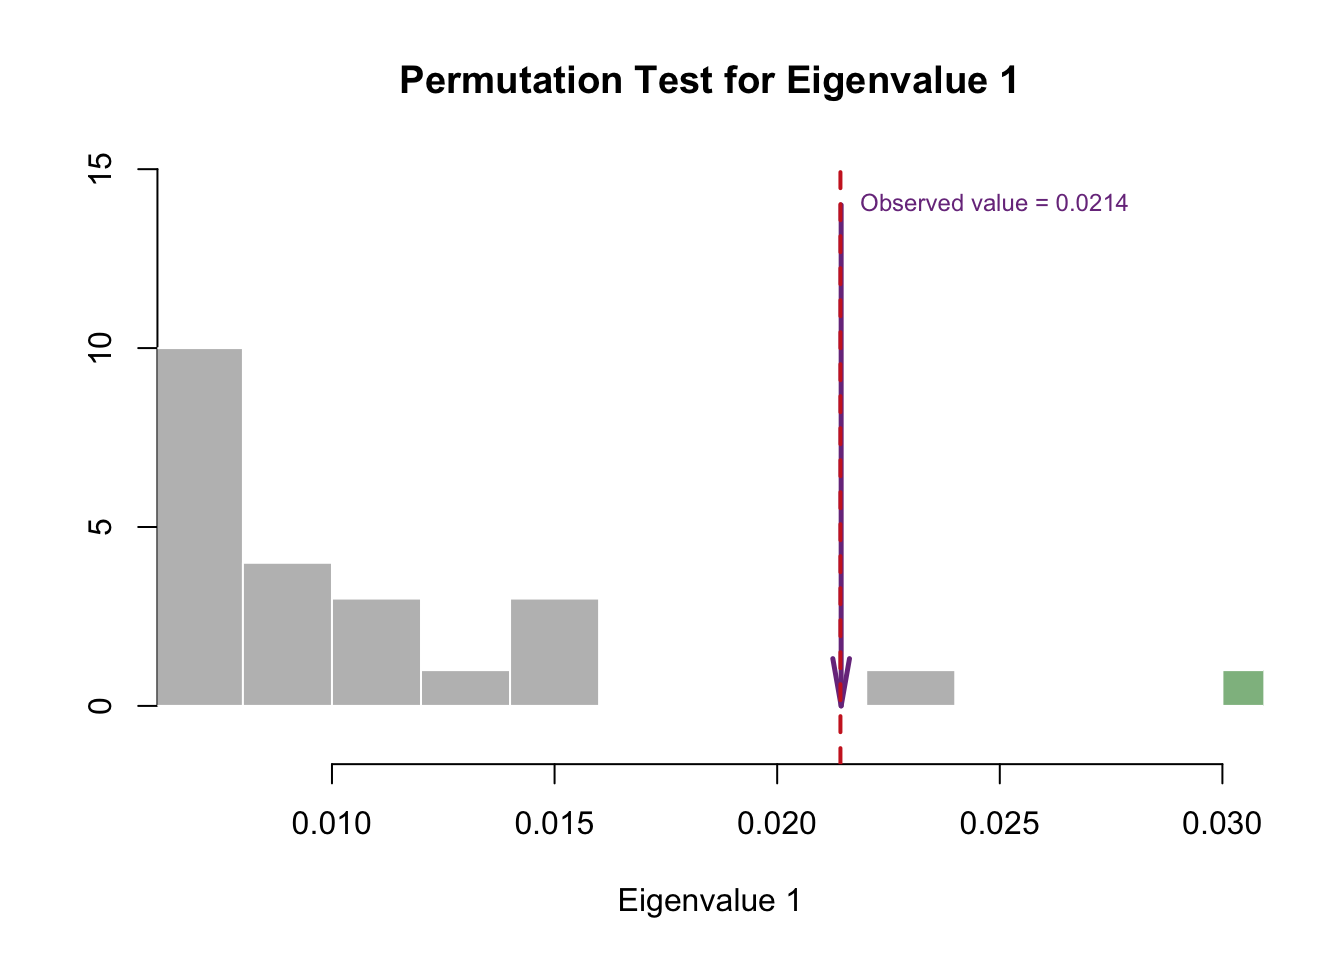
The first dimension is reliable and above the Kaiser line.
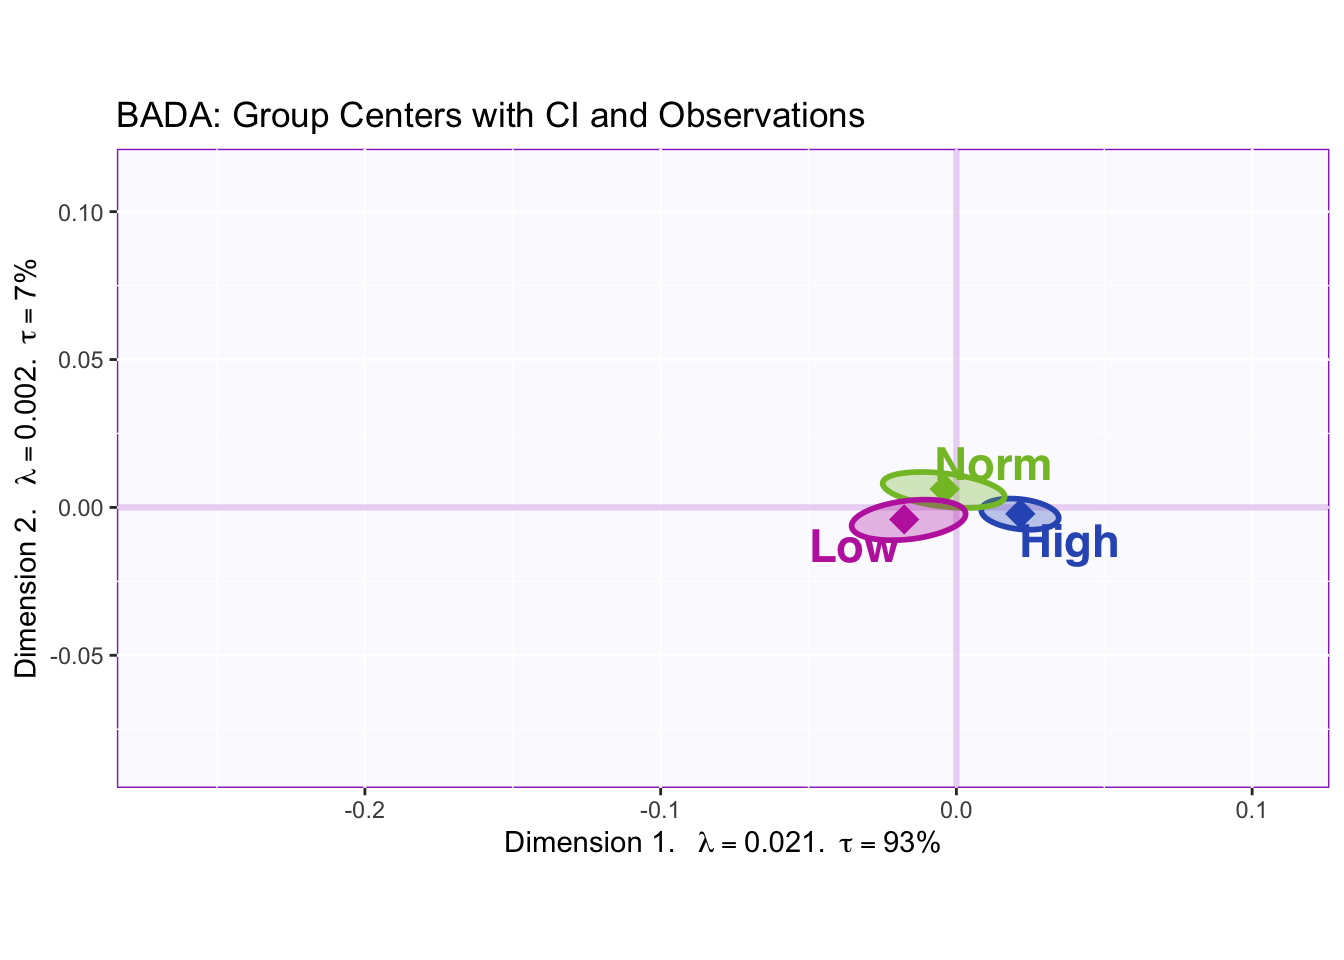
2.2.3 Barycenters with Observations
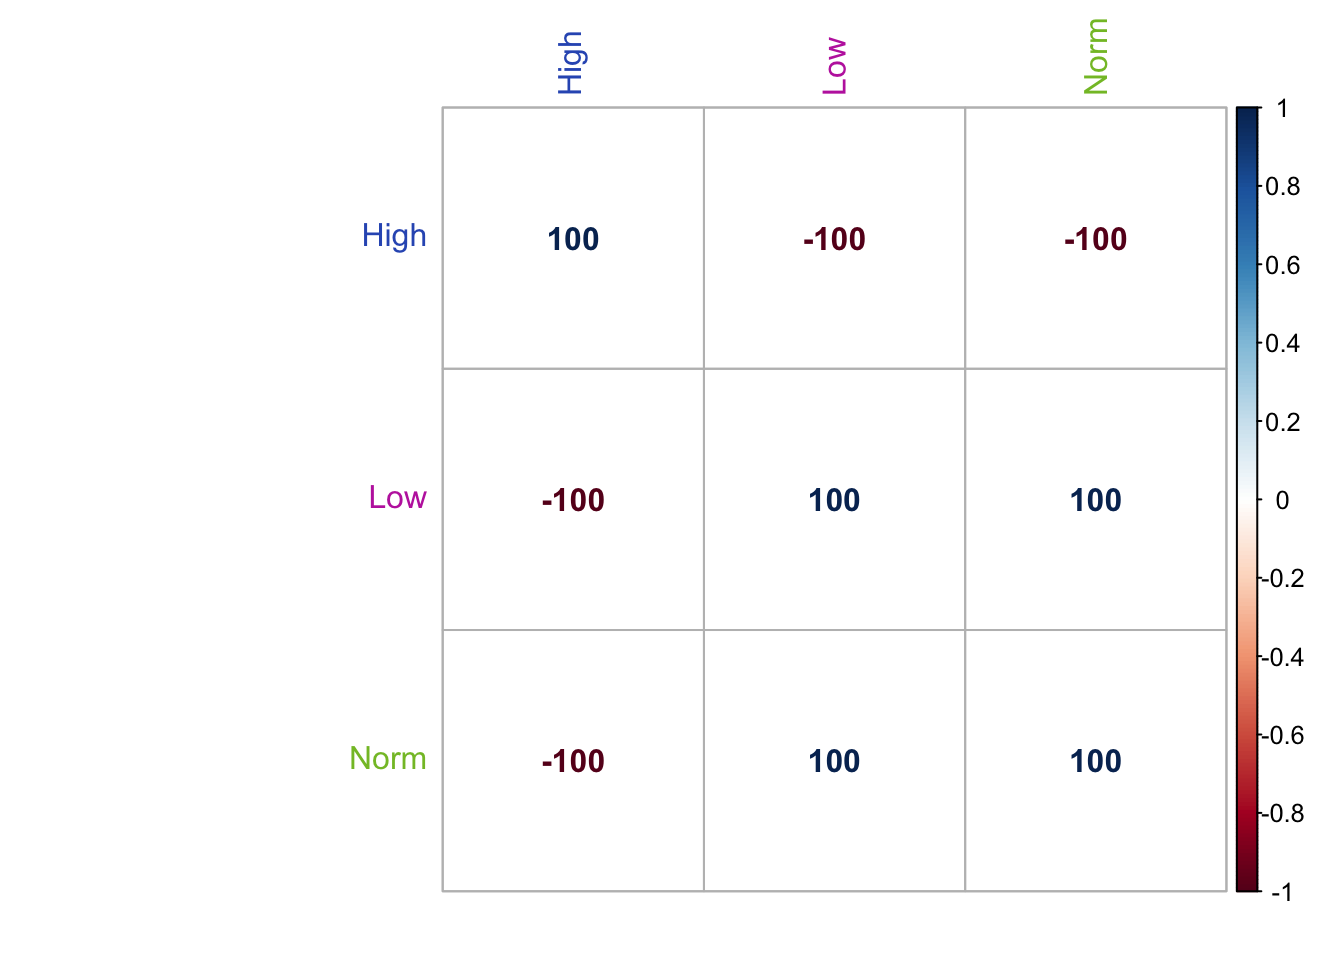
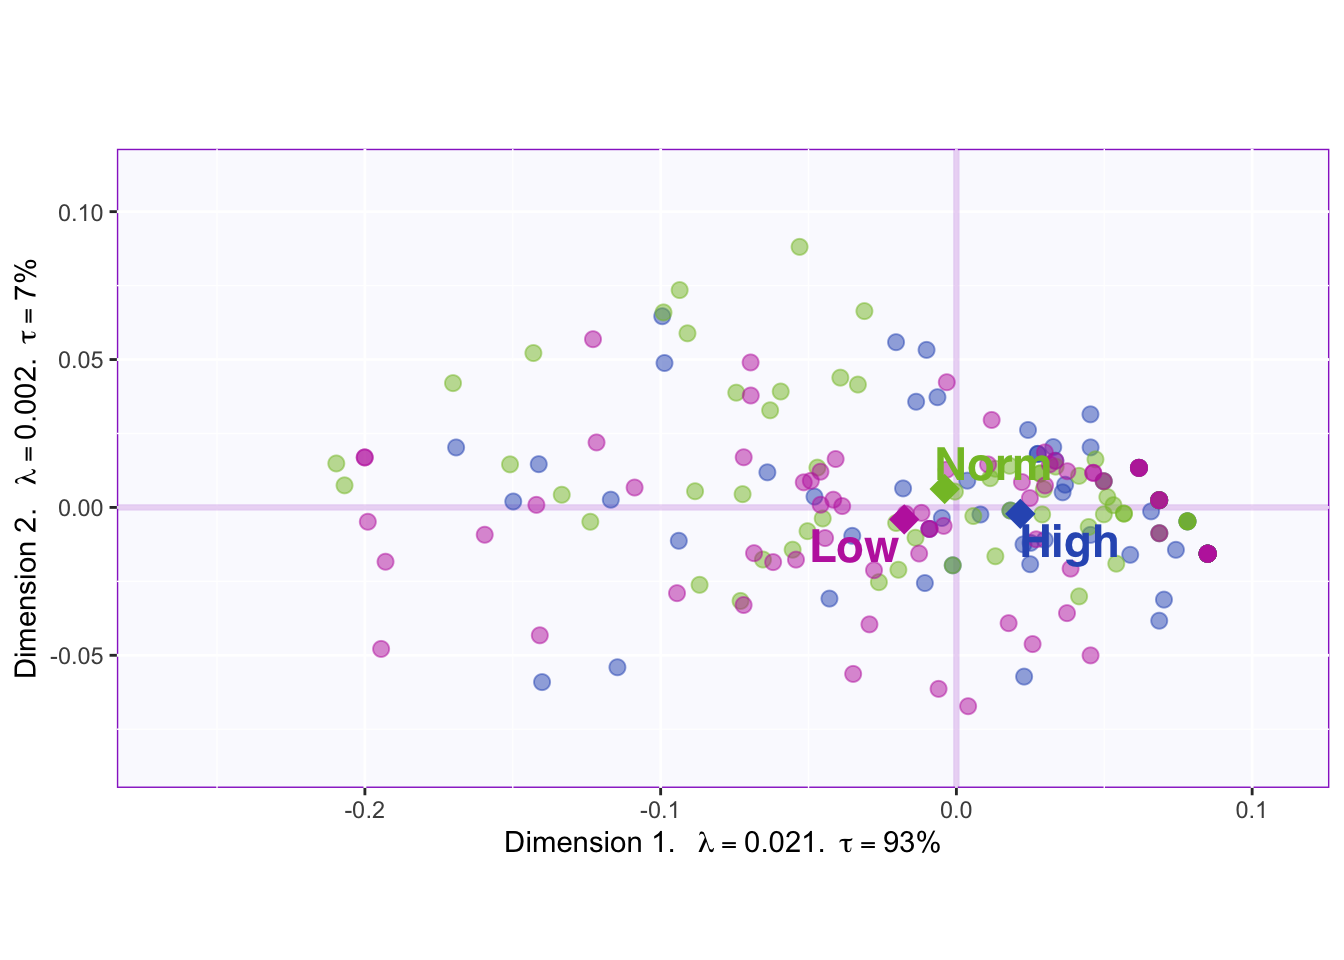
The correlation plot of the design variable shows that high memory is completely negatively correlated with low and normal memory. Low and normal memory are completely positively correlated.
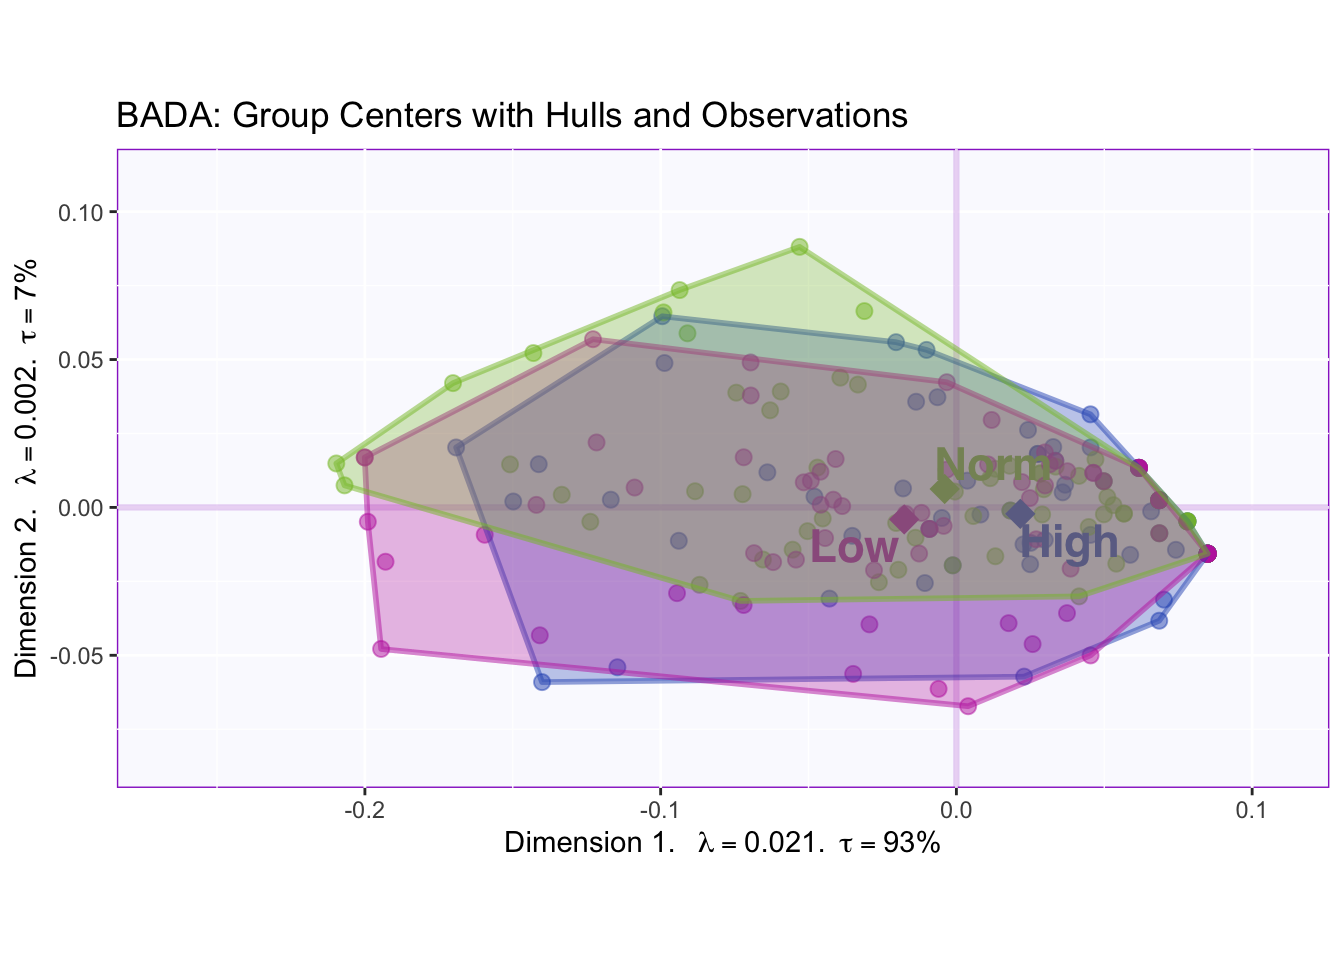
The bootstraps of the barycenters shows that low (-) and high (+) memory are reliably separated, but the hulls overlap meaing that there is a lot variance in all three groups (makes classification harder).
2.2.4 Column Loadings
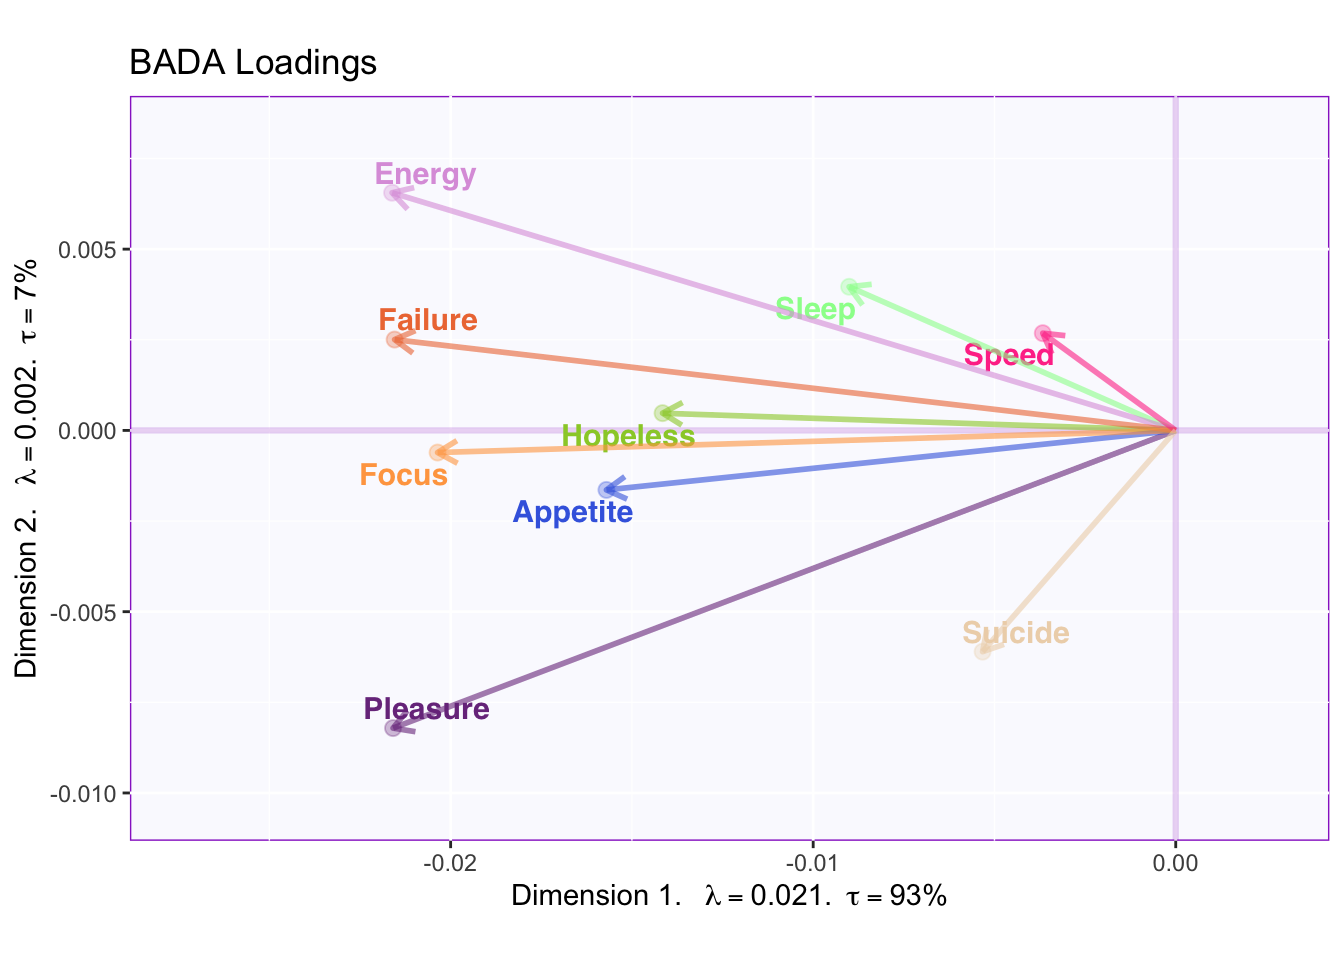
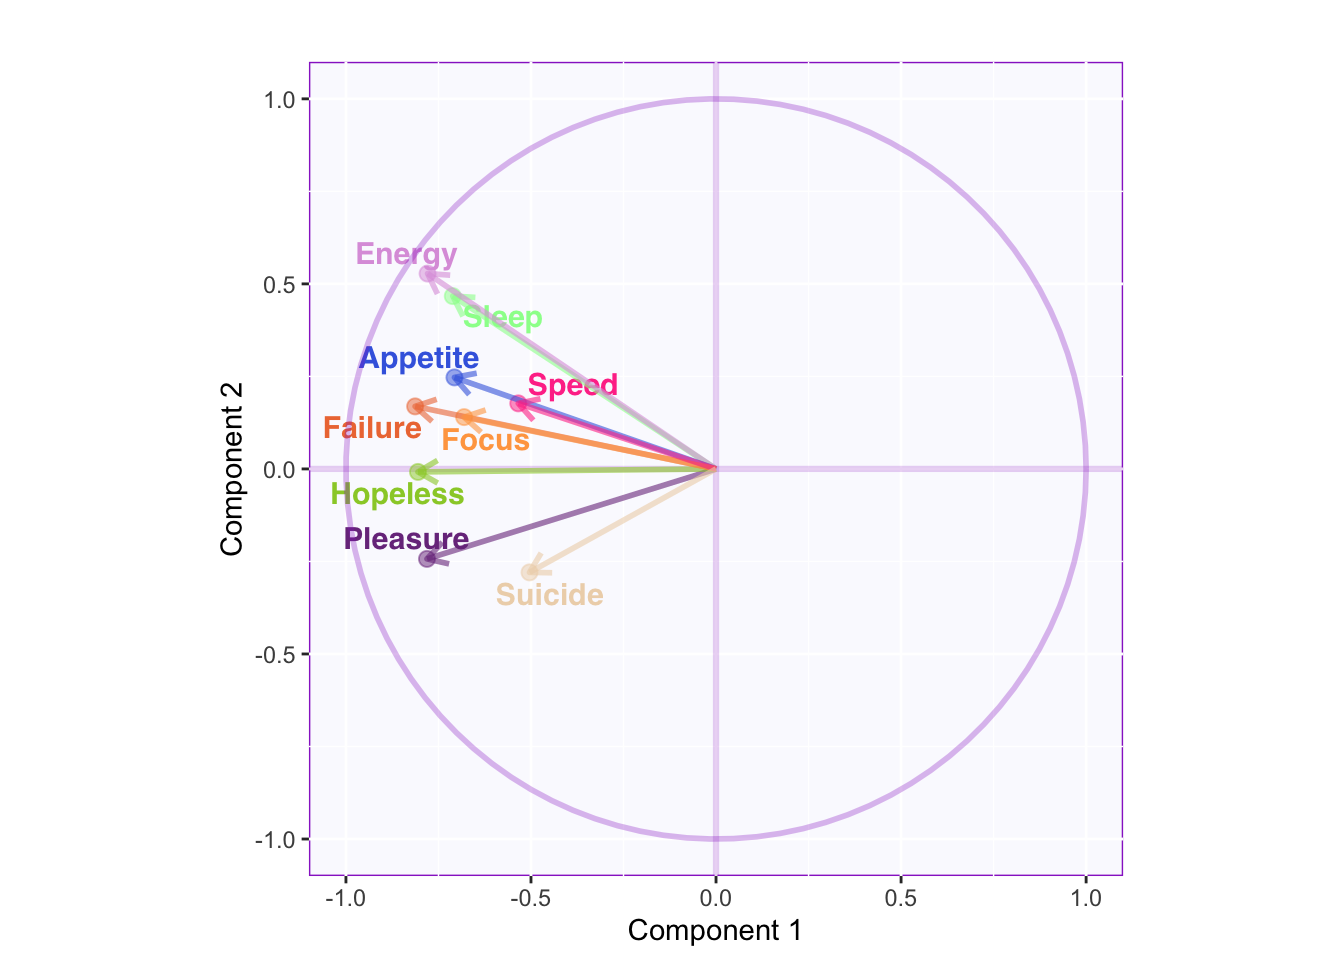
The circle of correlation shows that the variance of speed and suicide is hardly captured in the first two dimensions. However, energy and sleep are almost completely accounted for in the first two dimensions.
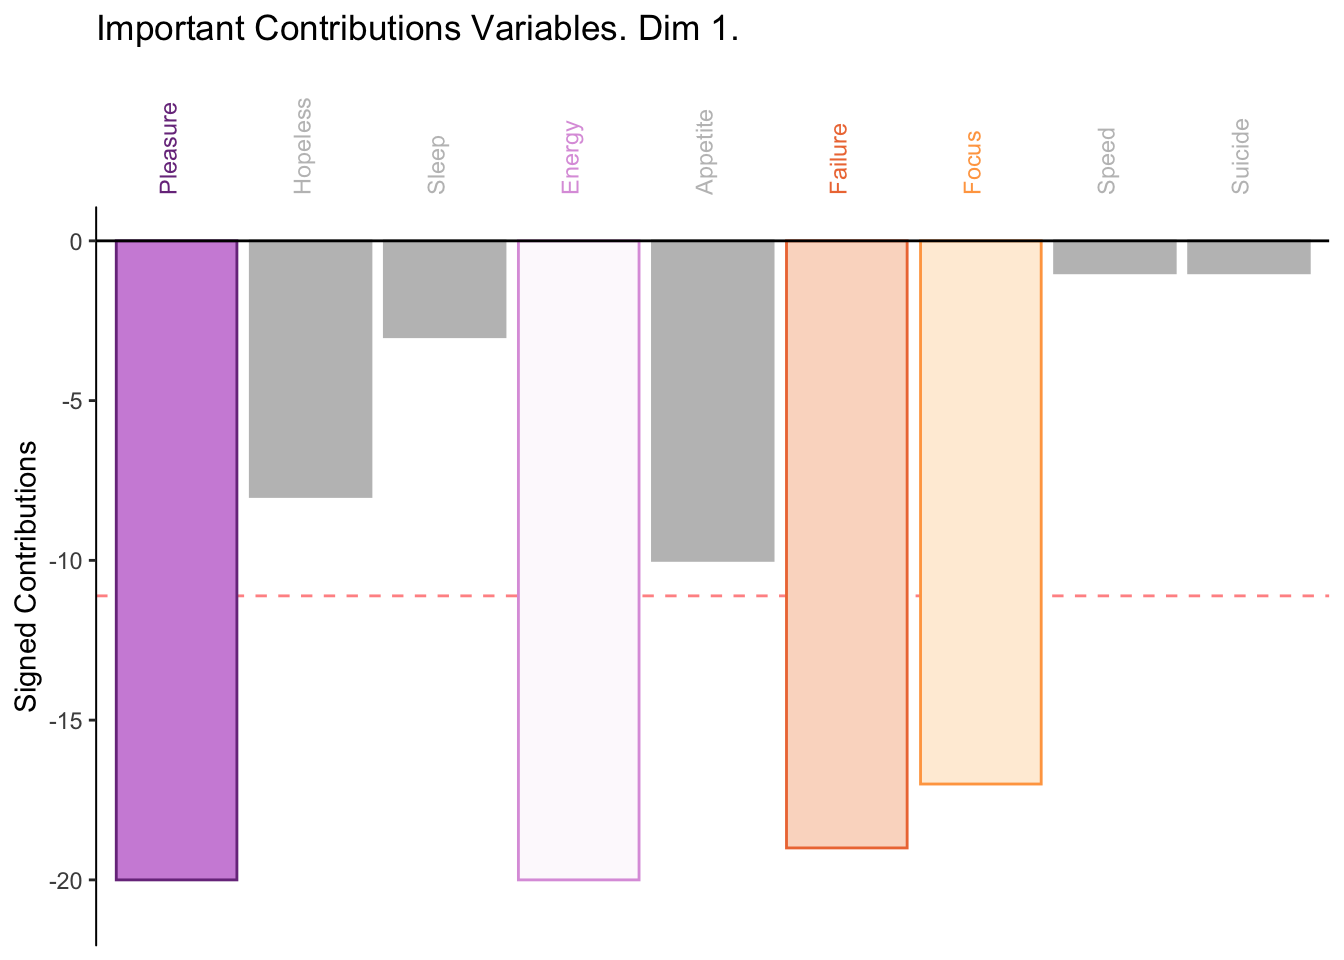
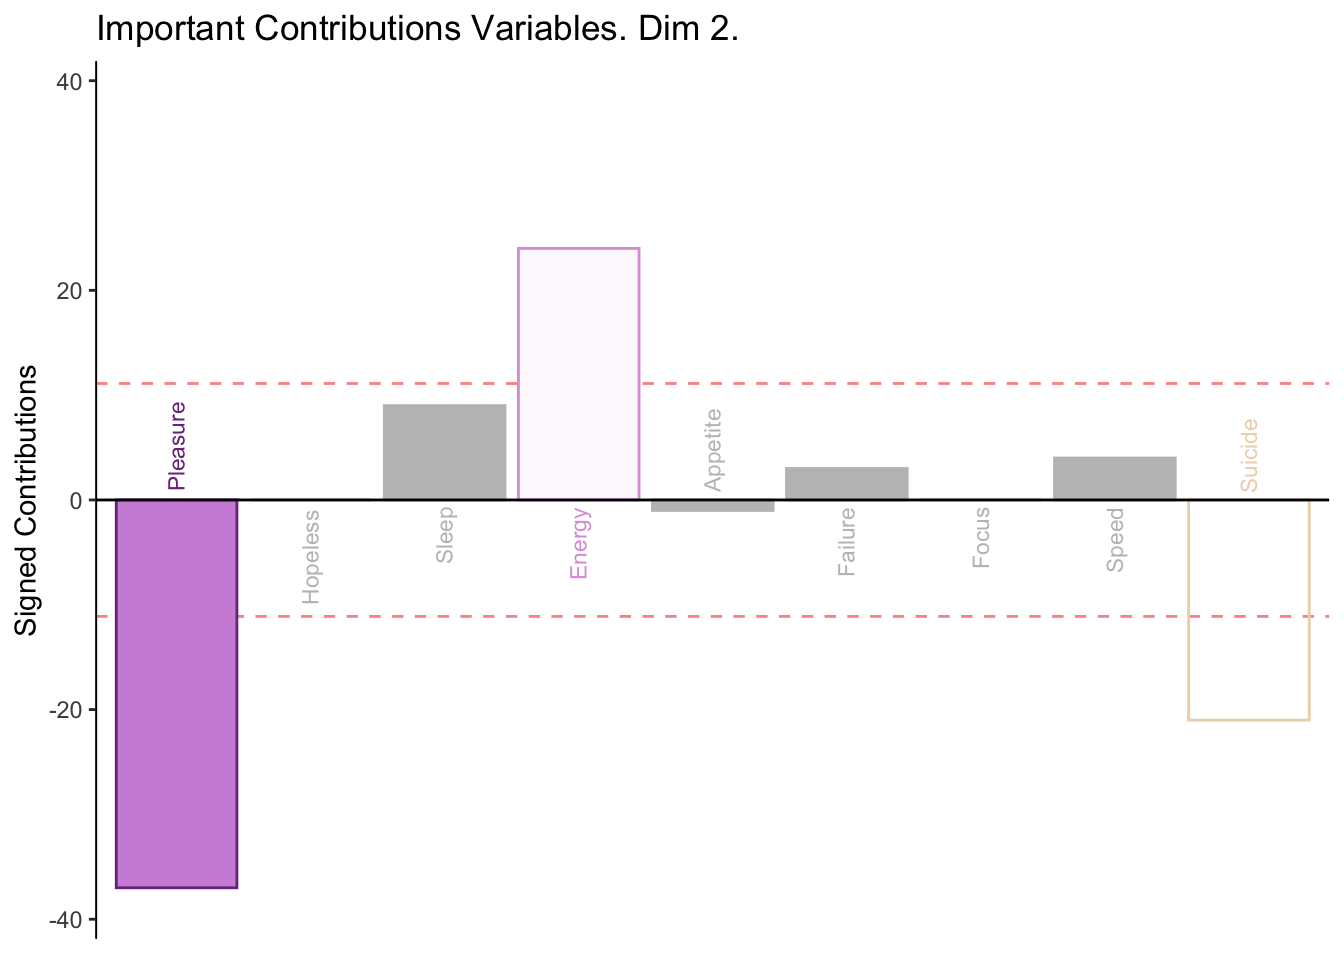
2.2.5 Contributions
2.2.6 Bootstrap Ratios
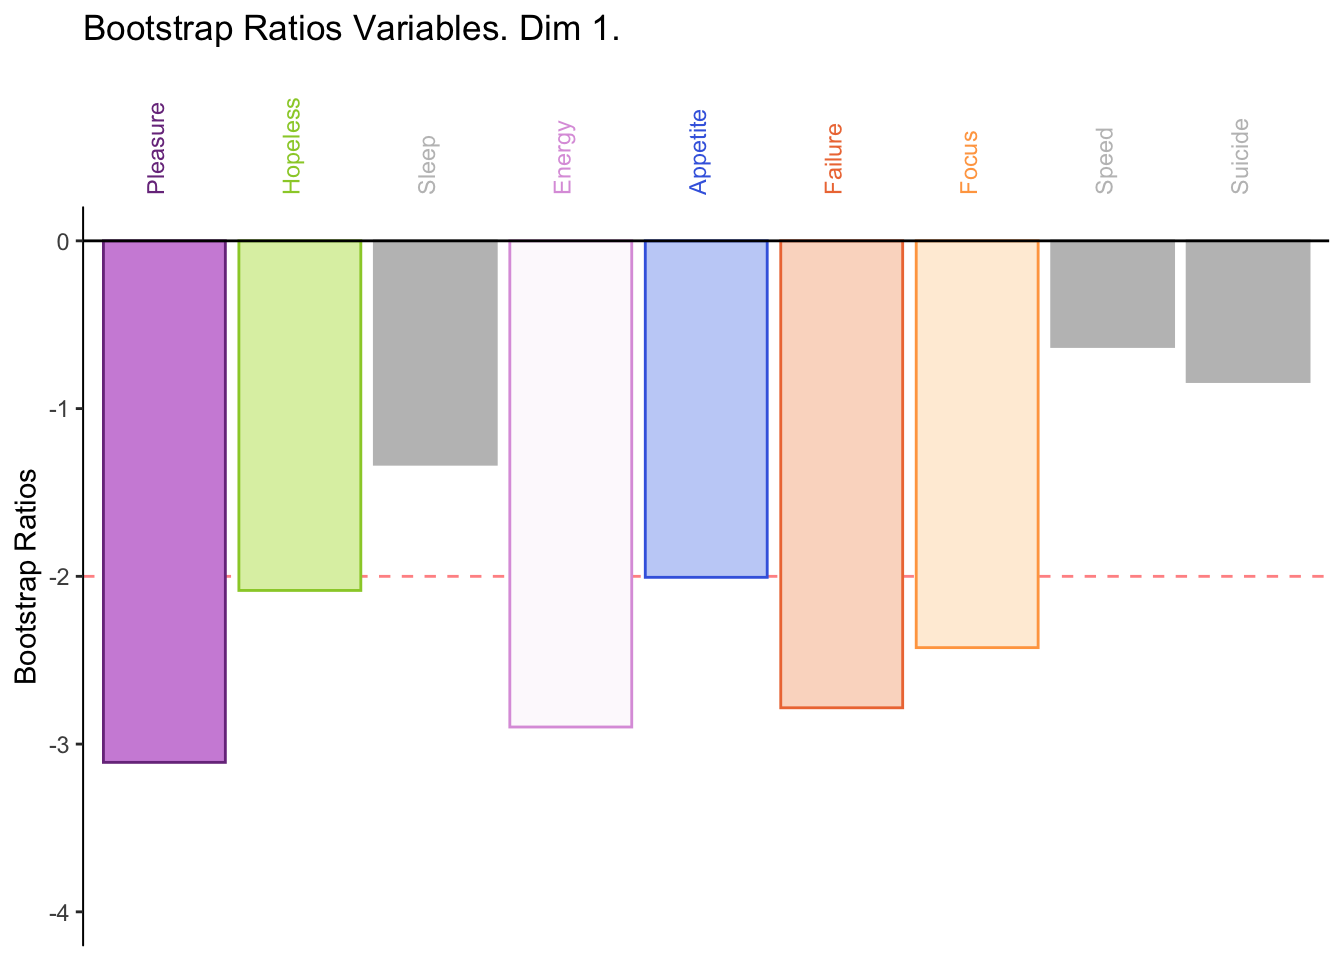
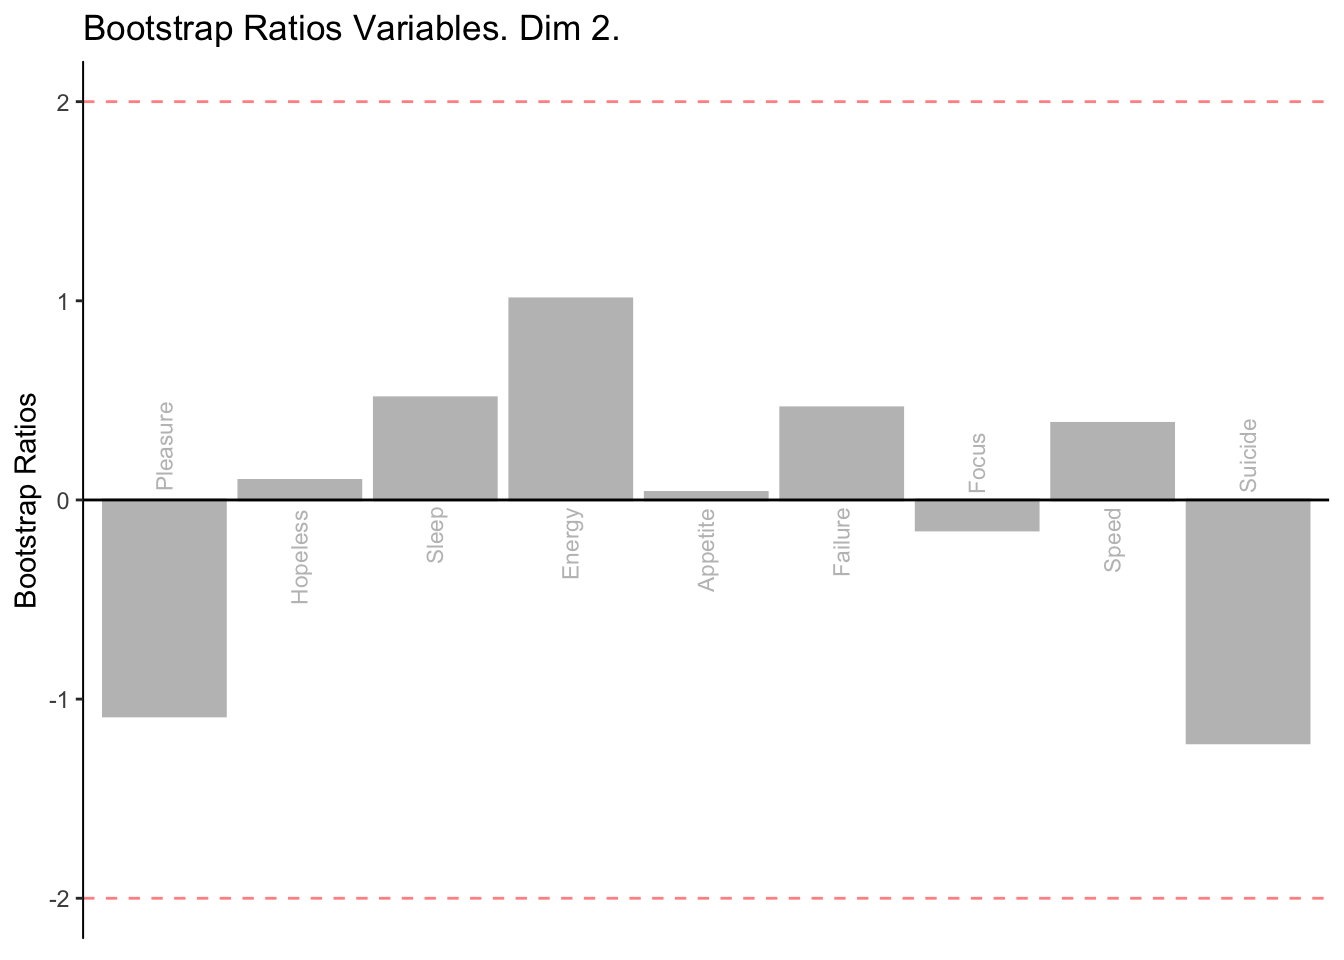
The bootstraps show that the second dimension is not reliable. However, the significant contributions in dimesion 1 are reliable.
2.3 Accuracy
#Fixed Model
row.names(resBADA.inf$Inference.Data$loo.data$fixed.confuse) <- c("High", "Norm", "Low")
colnames(resBADA.inf$Inference.Data$loo.data$fixed.confuse) <- c("High", "Norm", "Low")
resBADA.inf$Inference.Data$loo.data$fixed.confuse
## High Norm Low
## High 44 34 27
## Norm 15 15 14
## Low 13 23 31## [1] 0.4166667#Random Model
row.names(resBADA.inf$Inference.Data$loo.data$loo.confuse) <- c("High", "Norm", "Low")
colnames(resBADA.inf$Inference.Data$loo.data$loo.confuse) <- c("High", "Norm", "Low")
resBADA.inf$Inference.Data$loo.data$loo.confuse## High Norm Low
## High 44 34 27
## Norm 15 14 18
## Low 13 24 27## [1] 0.3935185The classification accuracy between the fixed effect model and the random effect model seems stable meaning that this model could be used for generalization considering the accuracy is above chance.
2.4 Summary
When we interpret the factor scores and loadings together, the BADA revealed:
Component 1
Rows: Low (-) vs high (+) memory
Columns interpretation: Low memory scores higher on pleasure, energy, failure, and focus.
Component 2
Rows: Confidence intervals overlap I.e. not reliable
Columns: bootstraps show that nothing contributing in this dimension is reliable