Chapter 6 Effects on winners
if(!require("broom")){install.packages("broom");  library(broom)}
if(!require("haven")){install.packages("haven");  library(haven)}
if(!require("here")){install.packages("here");  library(here)}
if(!require("knitr")){install.packages("knitr");  library(knitr)}
options(kableExtra.latex.load_packages = FALSE)
if(!require("kableExtra")){install.packages("kableExtra");  library(kableExtra)}
if(!require("naniar")){install.packages("naniar");  library(naniar)}
if(!require("tidyverse")){install.packages("tidyverse");  library(tidyverse)}
# The analysis uses custom functions included in the compendium. Install the included pkg with `devtools::install()` or just install from github with:
if (!require(wiggle)) {  devtools::install_github("mikajoh/wiggle")}

set.seed(2016)
## Utils.
source("goodloser-utils.R")

d <- read_sav("Data/Goodloser-exp1.sav")

knitr::opts_chunk$set(echo = TRUE, knitr.kable.NA = "", cache = FALSE, warning = FALSE)
##Prepare data
Select only respondents who receive a favorable outcome
d <- d %>%
  filter(favorability == "Favorable") %>%
  mutate(treatment = lvls_reorder(treatment, c(3, 2, 1)))
##Fairness
res_main <-  lm(fairness ~ treatment, data = d)
res_main <- broom::tidy(res_main)

labels <- data.frame(
  term = c(
    "treatmentLamenting politician",
    "treatmentGeneral prime"

  ),
  label = c( "Lamenting politician",
             "General prime")
)
#Figure
fig <-   res_main %>%
  filter(term != "(Intercept)") %>%
  left_join(labels, by = "term") %>%

  ggplot(aes(x = estimate, y = label,
             xmin = estimate - (2 * std.error),
             xmax = estimate + (2 * std.error))) +
   geom_errorbarh(height = 0) +
  geom_point() +
  geom_vline(aes(xintercept = 0), linetype = "dotted") +
  scale_x_continuous(limits = c(-1.3, 1.3),
                     breaks = round(seq(-1, 1, .25), 2),
                     expand = c(0, 0)) +
  labs(x = "Change in fairness perception",
       y = "Decision process attributes") +
  theme_bw() +
  theme(plot.margin = unit(c(2, 2, 2, 2), "mm"), axis.text.x=element_text(size=rel(0.6))) +
  theme(panel.spacing = unit(0.5, "lines"))
fig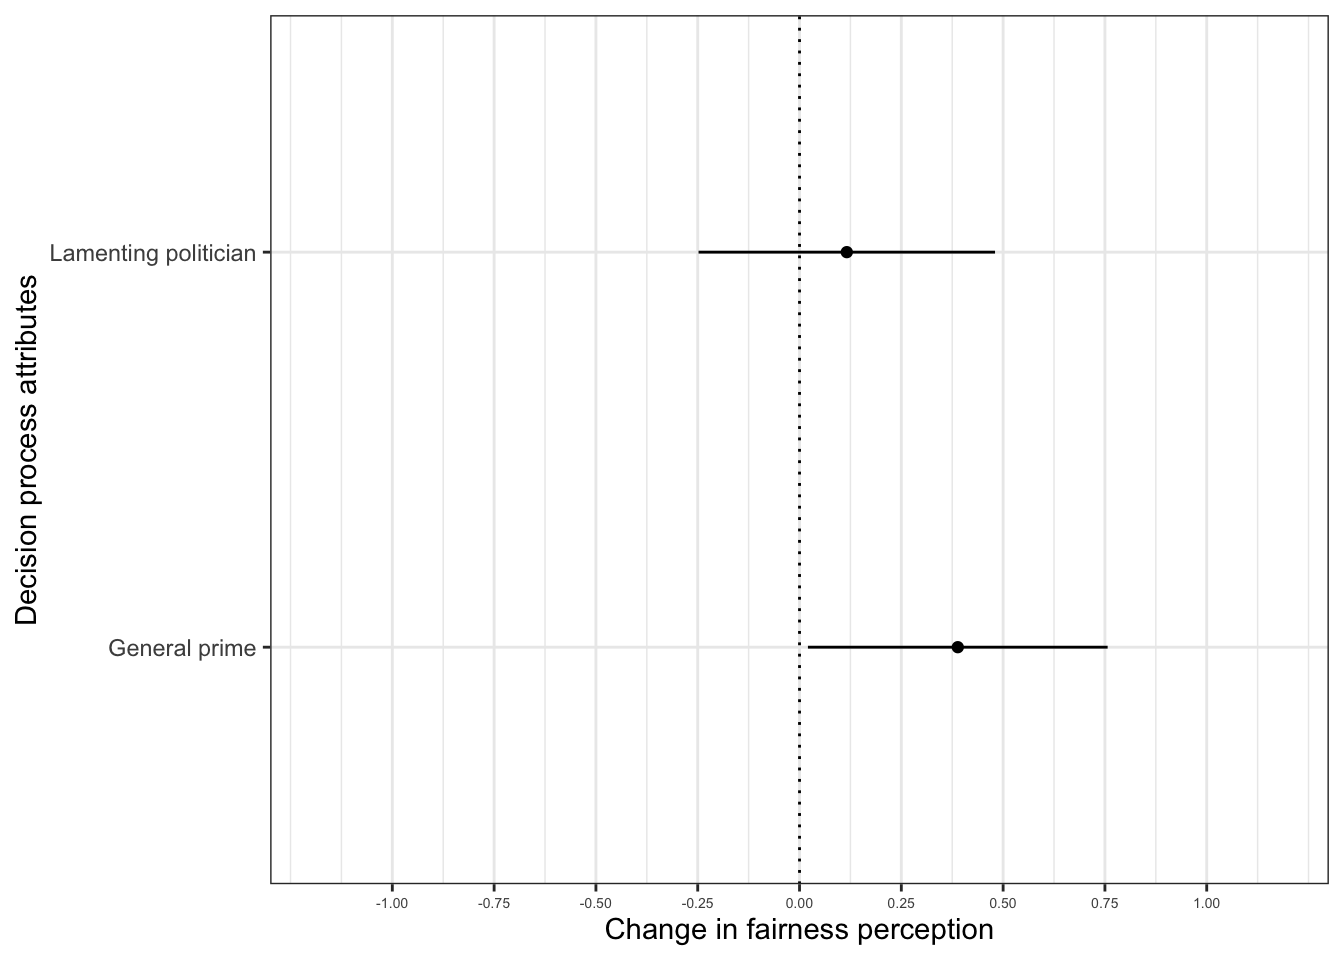
ggsave(
  here("output", "swevig", "figs", "pngs", "exp1-fairness-winners.png"),
  plot = fig,
  width = 5.5, height = 2.75
)

ggsave(
  here("output", "swevig", "figs", "pdfs", "exp1-fairness-winners.pdf"),
  plot = fig,
  width = 5.5, height = 2.75
)


#Table
table <- res_main %>%
  select(term, estimate, std.error, statistic, p.value) %>%
  mutate(term = case_when( term == "(Intercept)" ~ "Not shown",
                    term == "treatmentLamenting politician" ~ "Lamenting politician",
                   term == "treatmentGeneral prime" ~ "General prime")
         )

kable(table, booktabs = TRUE, caption = "Treatment effects on fairness perceptions of decision, Study 1 -- Swedish vignette", col.names = linebreak(c("Treatment value", "Estimate", "Std. Error", "t-statistic", "p value"))) %>%
kable_styling(bootstrap_options = c("striped", "hover", "responsive")) | Treatment value | Estimate | Std. Error | t-statistic | p value |
|---|---|---|---|---|
| Not shown | 4.2849162 | 0.1325376 | 32.3298249 | 0.0000000 |
| Lamenting politician | 0.1160739 | 0.1820228 | 0.6376888 | 0.5239319 |
| General prime | 0.3886589 | 0.1840059 | 2.1122088 | 0.0351021 |
##Justice
res_main <-  lm(justice ~ treatment, data = d)
res_main <- broom::tidy(res_main)

labels <- data.frame(
  term = c(
    "treatmentLamenting politician",
    "treatmentGeneral prime"

  ),
  label = c( "Lamenting politician",
             "General prime")
)
#Figure
fig <-   res_main %>%
  filter(term != "(Intercept)") %>%
  left_join(labels, by = "term") %>%

  ggplot(aes(x = estimate, y = label,
             xmin = estimate - (2 * std.error),
             xmax = estimate + (2 * std.error))) +
   geom_errorbarh(height = 0) +
  geom_point() +
  geom_vline(aes(xintercept = 0), linetype = "dotted") +
  scale_x_continuous(limits = c(-1, 1),
                     breaks = round(seq(-1, 1, .25), 2),
                     expand = c(0, 0)) +
  labs(x = "Change in justice perception",
       y = "Decision process attributes") +
  theme_bw() +
  theme(plot.margin = unit(c(2, 2, 2, 2), "mm"), axis.text.x=element_text(size=rel(0.6))) +
  theme(panel.spacing = unit(0.5, "lines"))
fig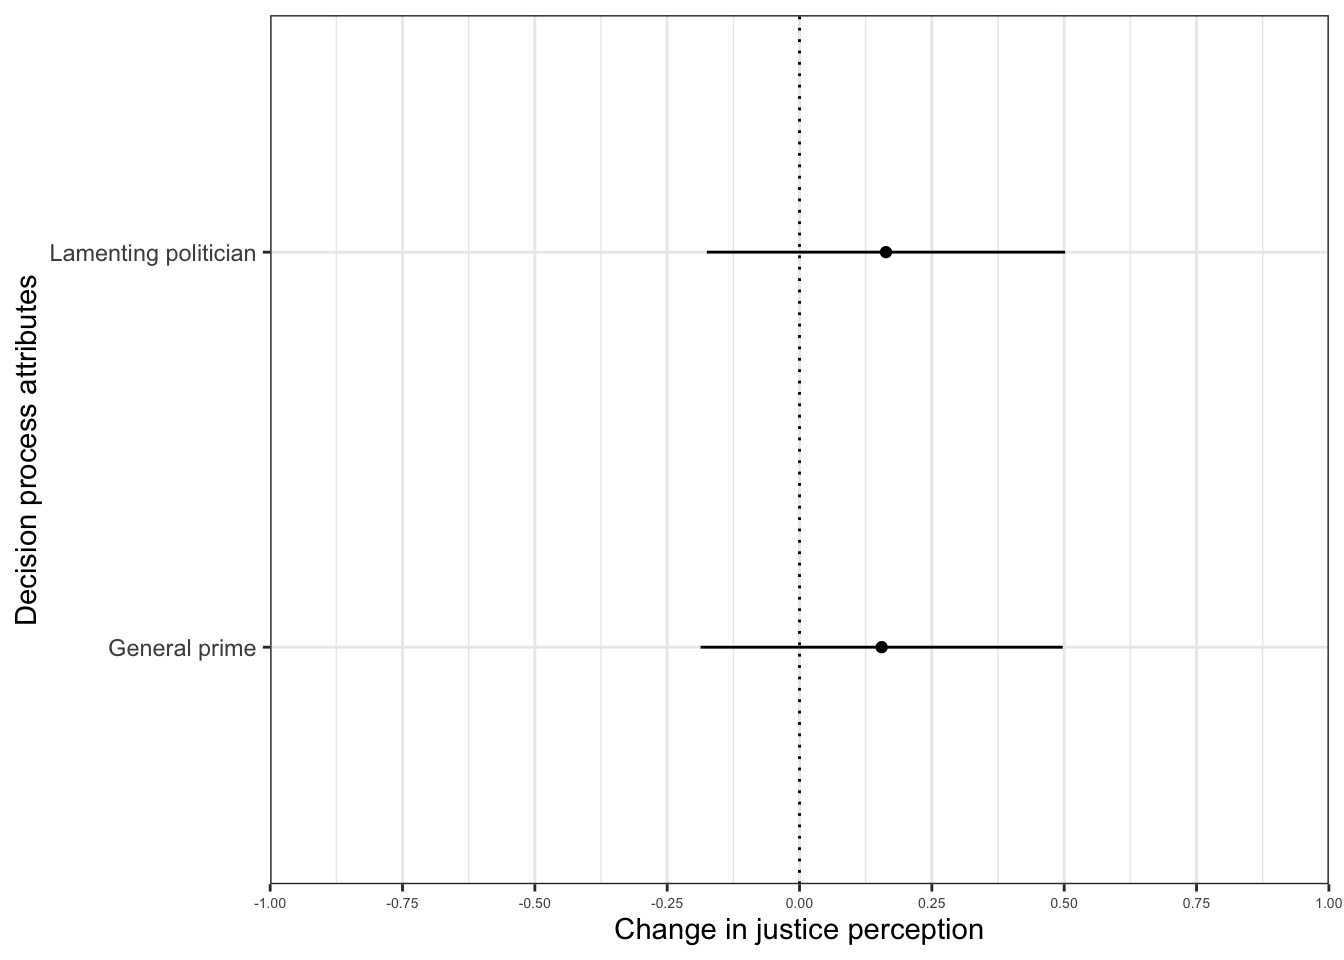
ggsave(
  here("output", "swevig", "figs", "pngs", "exp1-justice-winners.png"),
  plot = fig,
  width = 5.5, height = 2.75
)

ggsave(
  here("output", "swevig", "figs", "pdfs", "exp1-justice-winners.pdf"),
  plot = fig,
  width = 5.5, height = 2.75
)


#Table
table <- res_main %>%
  select(term, estimate, std.error, statistic, p.value) %>%
  mutate(term = case_when( term == "(Intercept)" ~ "Not shown",
                    term == "treatmentLamenting politician" ~ "Lamenting politician",
                   term == "treatmentGeneral prime" ~ "General prime")
         )

kable(table, booktabs = TRUE, caption = "Treatment effects on justice perceptions of decision, Study 1 -- Swedish vignette", col.names = linebreak(c("Treatment value", "Estimate", "Std. Error", "t-statistic", "p value"))) %>%
kable_styling(bootstrap_options = c("striped", "hover", "responsive")) | Treatment value | Estimate | Std. Error | t-statistic | p value |
|---|---|---|---|---|
| Not shown | 4.2178771 | 0.1231976 | 34.2366943 | 0.0000000 |
| Lamenting politician | 0.1633110 | 0.1691955 | 0.9652206 | 0.3348429 |
| General prime | 0.1551799 | 0.1710389 | 0.9072784 | 0.3646423 |
##Decision evaluation
res_main <-  lm(eval ~ treatment, data = d)
res_main <- broom::tidy(res_main)

labels <- data.frame(
  term = c(
    "treatmentLamenting politician",
    "treatmentGeneral prime"

  ),
  label = c( "Lamenting politician",
             "General prime")
)
#Figure
fig <-   res_main %>%
  filter(term != "(Intercept)") %>%
  left_join(labels, by = "term") %>%

  ggplot(aes(x = estimate, y = label,
             xmin = estimate - (2 * std.error),
             xmax = estimate + (2 * std.error))) +
   geom_errorbarh(height = 0) +
  geom_point() +
  geom_vline(aes(xintercept = 0), linetype = "dotted") +
  scale_x_continuous(limits = c(-1, 1),
                     breaks = round(seq(-1, 1, .25), 2),
                     expand = c(0, 0)) +
  labs(x = "Change in decision evaluation",
       y = "Decision process attributes") +
  theme_bw() +
  theme(plot.margin = unit(c(2, 2, 2, 2), "mm"), axis.text.x=element_text(size=rel(0.7))) +
  theme(panel.spacing = unit(0.5, "lines"))
fig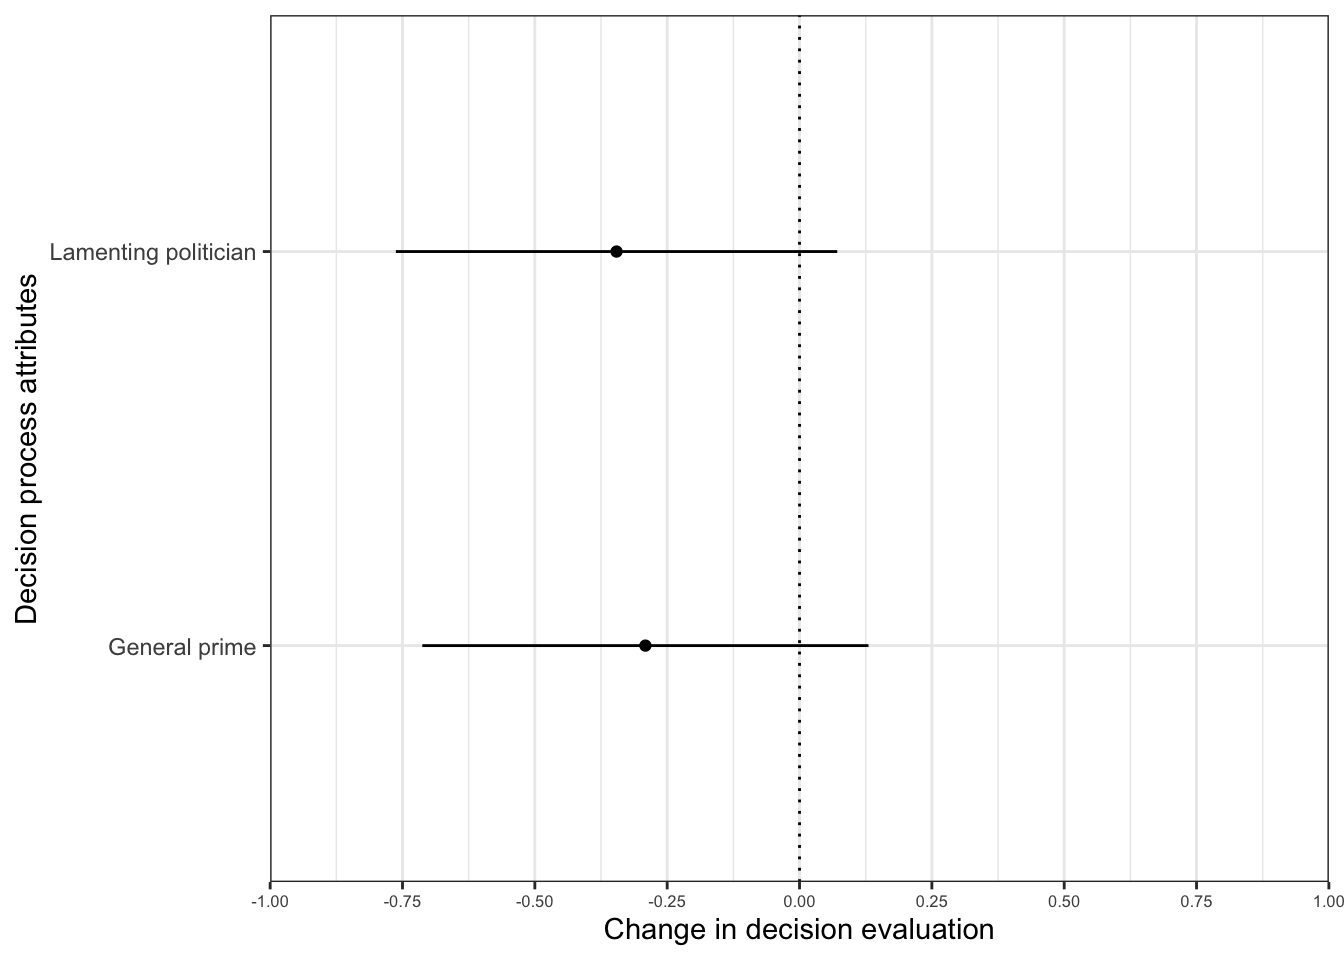
ggsave(
  here("output", "swevig", "figs", "pngs", "exp1-eval-winners.png"),
  plot = fig,
  width = 5.5, height = 2.75
)

ggsave(
  here("output", "swevig", "figs", "pdfs", "exp1-eval-winners.pdf"),
  plot = fig,
  width = 5.5, height = 2.75
)


#Table
table <- res_main %>%
  select(term, estimate, std.error, statistic, p.value) %>%
  mutate(term = case_when( term == "(Intercept)" ~ "Not shown",
                    term == "treatmentLamenting politician" ~ "Lamenting politician",
                   term == "treatmentGeneral prime" ~ "General prime")
         )

kable(table, booktabs = TRUE, caption = "Treatment effects on decision evaluation, Study 1 -- Swedish vignette", col.names = linebreak(c("Treatment value", "Estimate", "Std. Error", "t-statistic", "p value"))) %>%
kable_styling(bootstrap_options = c("striped", "hover", "responsive")) | Treatment value | Estimate | Std. Error | t-statistic | p value |
|---|---|---|---|---|
| Not shown | 4.5139665 | 0.1517737 | 29.741418 | 0.0000000 |
| Lamenting politician | -0.3456496 | 0.2084412 | -1.658260 | 0.0978142 |
| General prime | -0.2911686 | 0.2107121 | -1.381831 | 0.1675639 |
##Willingness to accept
res_main <-  lm(accept ~ treatment, data = d)
res_main <- broom::tidy(res_main)

labels <- data.frame(
  term = c(
    "treatmentLamenting politician",
    "treatmentGeneral prime"

  ),
  label = c( "Lamenting politician",
             "General prime")
)
#Figure
fig <-   res_main %>%
  filter(term != "(Intercept)") %>%
  left_join(labels, by = "term") %>%

  ggplot(aes(x = estimate, y = label,
             xmin = estimate - (2 * std.error),
             xmax = estimate + (2 * std.error))) +
   geom_errorbarh(height = 0) +
  geom_point() +
  geom_vline(aes(xintercept = 0), linetype = "dotted") +
  scale_x_continuous(limits = c(-1, 1),
                     breaks = round(seq(-1, 1, .25), 2),
                     expand = c(0, 0)) +
  labs(x = "Change in willingness to accept outcome",
       y = "Decision process attributes") +
  theme_bw() +
  theme(plot.margin = unit(c(2, 2, 2, 2), "mm"), axis.text.x=element_text(size=rel(0.6))) +
  theme(panel.spacing = unit(0.5, "lines"))
fig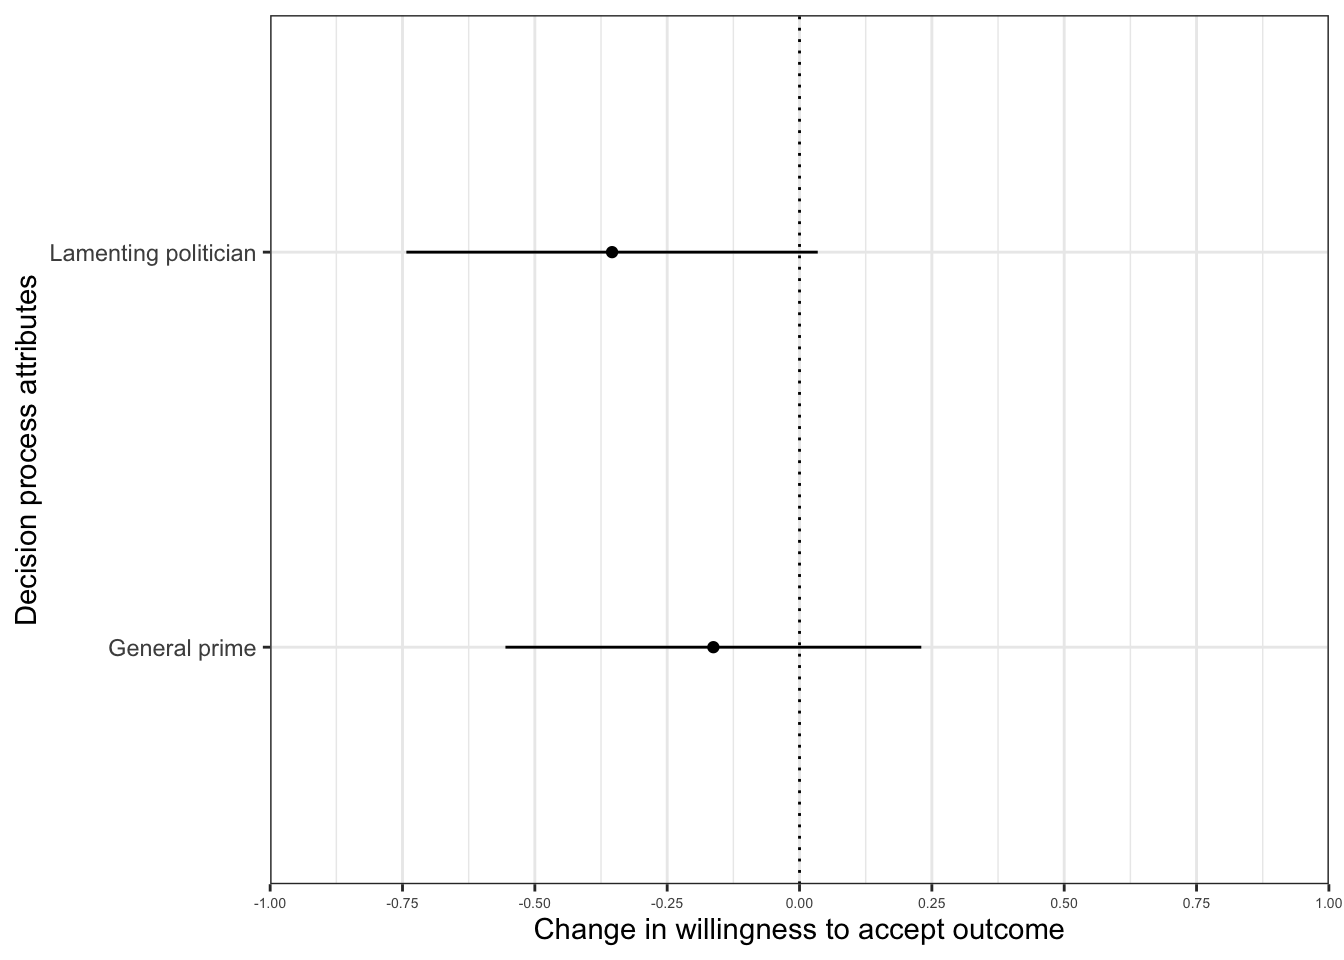
ggsave(
  here("output", "swevig", "figs", "pngs", "exp1-accept-winners.png"),
  plot = fig,
  width = 5.5, height = 2.75
)

ggsave(
  here("output", "swevig", "figs", "pdfs", "exp1-accept-winners.pdf"),
  plot = fig,
  width = 5.5, height = 2.75
)


#Table
table <- res_main %>%
  select(term, estimate, std.error, statistic, p.value) %>%
  mutate(term = case_when( term == "(Intercept)" ~ "Not shown",
                    term == "treatmentLamenting politician" ~ "Lamenting politician",
                   term == "treatmentGeneral prime" ~ "General prime")
         )

kable(table, booktabs = TRUE, caption = "Treatment effects on willingness to accept decision, Study 1 -- Swedish vignette", col.names = linebreak(c("Treatment value", "Estimate", "Std. Error", "t-statistic", "p value"))) %>%
kable_styling(bootstrap_options = c("striped", "hover", "responsive")) | Treatment value | Estimate | Std. Error | t-statistic | p value |
|---|---|---|---|---|
| Not shown | 5.4581006 | 0.1414642 | 38.5829139 | 0.0000000 |
| Lamenting politician | -0.3541402 | 0.1942823 | -1.8228120 | 0.0688547 |
| General prime | -0.1627638 | 0.1963990 | -0.8287402 | 0.4075977 |
##Compliance
res_main <-  lm(comply ~ treatment, data = d)
res_main <- broom::tidy(res_main)

labels <- data.frame(
  term = c(
    "treatmentLamenting politician",
    "treatmentGeneral prime"

  ),
  label = c( "Lamenting politician",
             "General prime")
)
#Figure
fig <-   res_main %>%
  filter(term != "(Intercept)") %>%
  left_join(labels, by = "term") %>%

  ggplot(aes(x = estimate, y = label,
             xmin = estimate - (2 * std.error),
             xmax = estimate + (2 * std.error))) +
   geom_errorbarh(height = 0) +
  geom_point() +
  geom_vline(aes(xintercept = 0), linetype = "dotted") +
  scale_x_continuous(limits = c(-1, 1),
                     breaks = round(seq(-1, 1, .25), 2),
                     expand = c(0, 0)) +
  labs(x = "Change in decision compliance",
       y = "Decision process attributes") +
  theme_bw() +
  theme(plot.margin = unit(c(2, 2, 2, 2), "mm"), axis.text.x=element_text(size=rel(0.6))) +
  theme(panel.spacing = unit(0.5, "lines"))
fig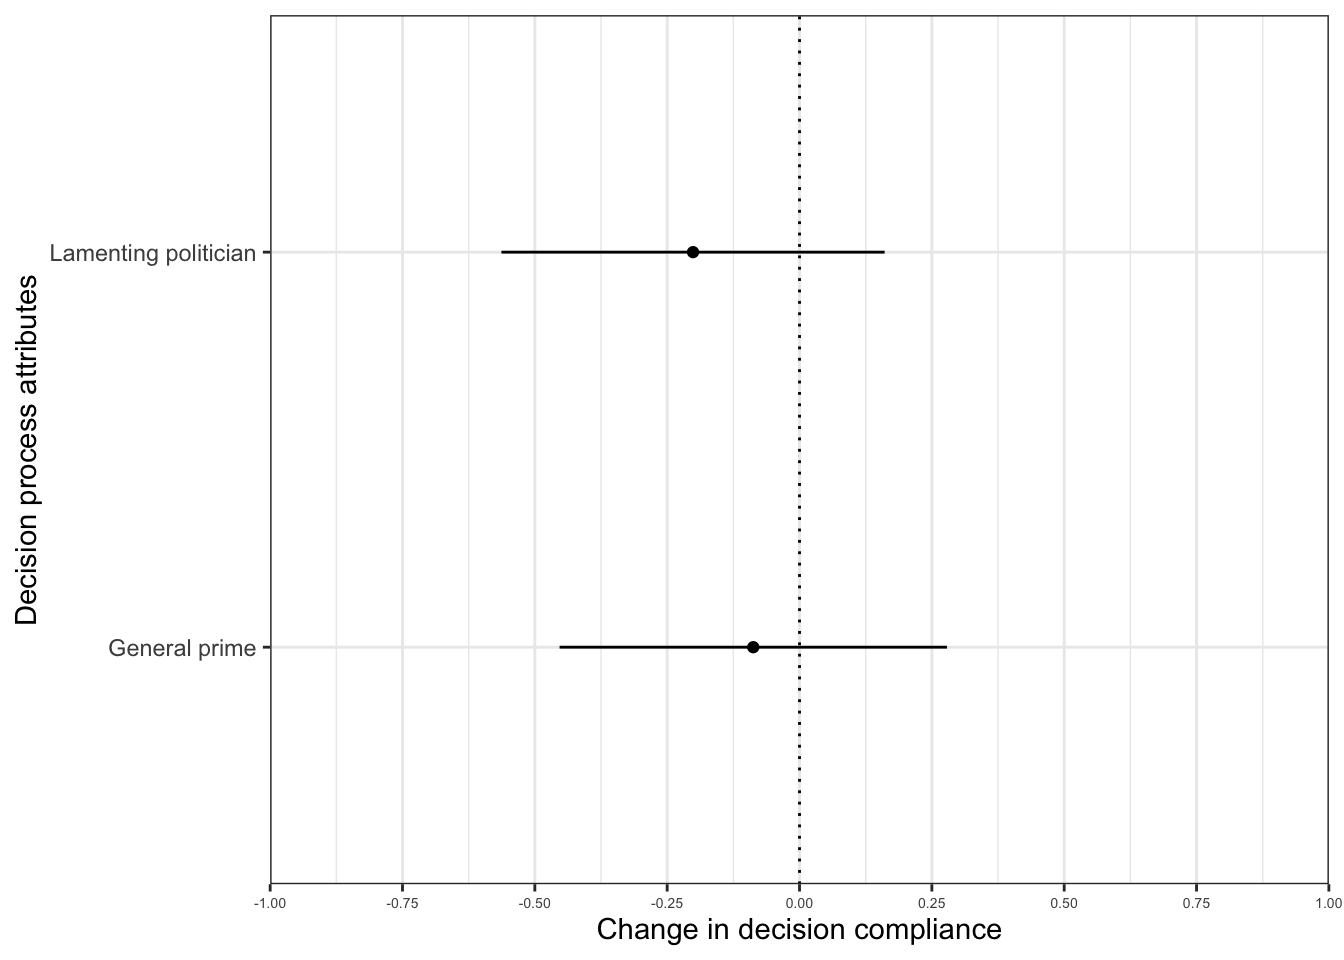
ggsave(
  here("output", "swevig", "figs", "pngs", "exp1-comply-winners.png"),
  plot = fig,
  width = 5.5, height = 2.75
)

ggsave(
  here("output", "swevig", "figs", "pdfs", "exp1-comply-winners.pdf"),
  plot = fig,
  width = 5.5, height = 2.75
)


#Table
table <- res_main %>%
  select(term, estimate, std.error, statistic, p.value) %>%
  mutate(term = case_when( term == "(Intercept)" ~ "Not shown",
                    term == "treatmentLamenting politician" ~ "Lamenting politician",
                   term == "treatmentGeneral prime" ~ "General prime")
         )

kable(table, booktabs = TRUE, caption = "Treatment effects on decision compliance, Study 1 -- Swedish vignette", col.names = linebreak(c("Treatment value", "Estimate", "Std. Error", "t-statistic", "p value"))) %>%
kable_styling(bootstrap_options = c("striped", "hover", "responsive")) | Treatment value | Estimate | Std. Error | t-statistic | p value |
|---|---|---|---|---|
| Not shown | 5.4189944 | 0.1317730 | 41.1237227 | 0.0000000 |
| Lamenting politician | -0.2011726 | 0.1809727 | -1.1116186 | 0.2667700 |
| General prime | -0.0873882 | 0.1829444 | -0.4776763 | 0.6330634 |
## Loading required package: utf8#Stimulus material
Video voice over text: “Imagine that your municipality is about to decide whether begging on the streets should be banned or allowed within the municipal borders in the future. This is a controversial decision: Some inhabitants and politicians strongly support the ban, while other inhabitants and politicians are equally strongly against such a ban on begging. Some parties propose a ban on begging. The decision will be made in the municipal council, and follows the normal decision-making procedure. The proposal is rst debated in the council, where all members are welcome to express their position and their arguments. The debate is public, and journalists are present to report on the debate. In the end, the politicians vote on the proposal.”
| Preference | Treatment | Text |
|---|---|---|
| Pro ban on begging | No prime | The majority votes against a ban on begging. That means the council will not ban begging in your municipality. |
| Lamenting politician | The majority votes against a ban on begging. That means the council will not ban begging in your municipality.After the decision, the leader of one of the parties who where in favor of a ban states that they are disappointed and that the decision was wrong. | |
| General prime | ||
| Specific prime | ||
| Winner | The majority votes for a ban on begging. That means the council will ban begging in your municipality. | |
| Against ban on begging | No prime | The majority votes for a ban on begging. That means the council will ban begging in your municipality. |
| Lamenting politician | The majority votes for a ban on begging. That means the council will ban begging in your municipality. After the decision, the leader of one of the parties who where in favor of a ban states that they are disappointed and that the decision was wrong. | |
| General prime | ||
| Specific prime | ||
| Winner | The majority votes against a ban on begging. That means the council will not ban begging in your municipality. |