Data Journalism - A Quick & Practical Guide
Rob Wells, Ph.D.
Associate Professor, School of Journalism and Strategic Media
rswells@uark.edu | 479.575.6305 Section 1: Introduction to data analysis
–Introduction to data analysis, including math for journalists
Basics of Data Analysis
Numbers in the Newsroom
Excel Exercise: Transit Data and Calculating a Rate
Review: Mac OSX Basics
Numbers in the Newsroom
Excel Exercise: Transit Data and Calculating a Rate
Review: Mac OSX Basics
–Organizing your data
Best practices in data management
Organizational tips for files
Data documentation skills
Organizational tips for files
Data documentation skills
–Data cleaning
Filtering
Reading Data Dictionaries
Data Cleaning Exercises
Reading Data Dictionaries
Data Cleaning Exercises
–Data Visualization
Principles of Data Visualization
Cleveland McGill Scale
Important Resources for Surveying the Data Visualization Options
Color Choices
Build a Cover Image Using Canva or InDesign or Powerpoint
Higher Resolution Graphics in Tableau
Cleveland McGill Scale
Important Resources for Surveying the Data Visualization Options
Color Choices
Build a Cover Image Using Canva or InDesign or Powerpoint
Higher Resolution Graphics in Tableau
–Writing About Data
Writing Style Notes
Common Errors – Math
AP Style with Numbers
Common Errors – Math
AP Style with Numbers
–Excel Bootcamp
Review four corners
How to Filter in Excel
Basics and Sorting in Excel
Practice Rates and Ratios
Excel formulas
Pivot Tables
Countif Function
How to Filter in Excel
Basics and Sorting in Excel
Practice Rates and Ratios
Excel formulas
Pivot Tables
Countif Function
Section 2: Data Analysis Tools

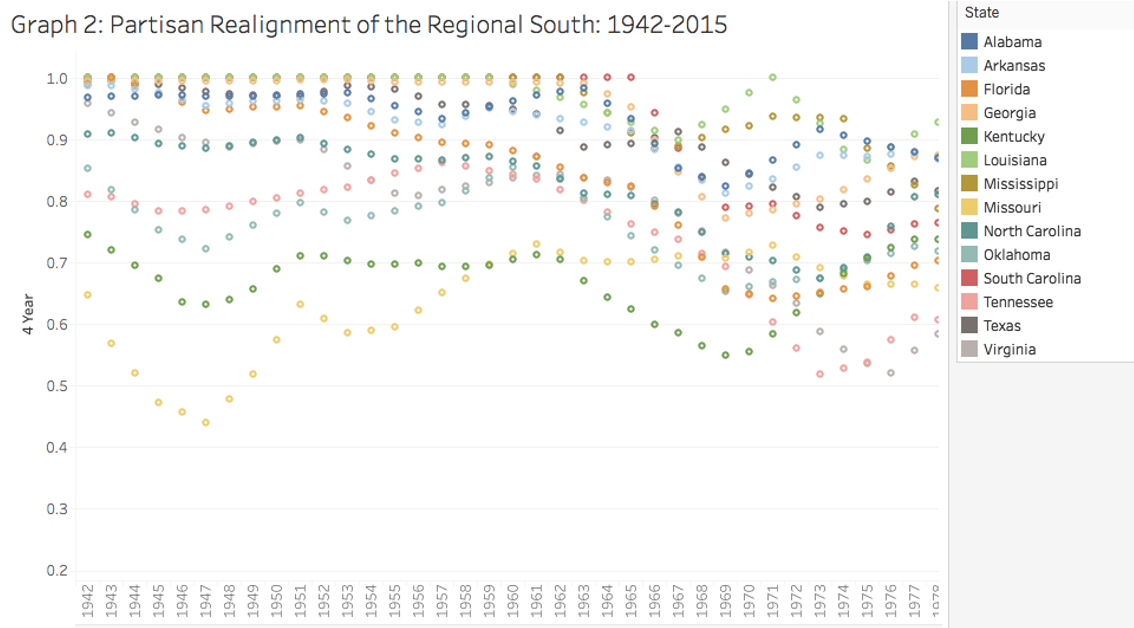
–Graphic by Jessica Kloss, 2018 Honors thesis
–Basic Tableau
Downloading instructions for Tableau
Getting started tutorial with video
Building a basic COVID data chart with video and transcript
Using filters and calculations with video and transcript
Tutorial on Tableau calculations with video
Proper formatting of a filter bar in Tableau, video
Links to additional Tableau Tutorials
Getting started tutorial with video
Building a basic COVID data chart with video and transcript
Using filters and calculations with video and transcript
Tutorial on Tableau calculations with video
Proper formatting of a filter bar in Tableau, video
Links to additional Tableau Tutorials
–Tableau - Maps
Mapping tutorial & sample dataset
Build a Map COVID-19 Positivity in Arkansas Counties
Video
Dual Mapping - Bubble Maps
Build a Map COVID-19 Positivity in Arkansas Counties
Video
Dual Mapping - Bubble Maps
–Basic Flourish
Videos to Get Started
Beginning Documents
Flourish Design Tips
More Resources
Adam Marton Cheat Sheet
Flourish newsrooms plan
Flourish - Stories
Examples from Fall Class
Basic Map
Flourish Links
Beginning Documents
Flourish Design Tips
More Resources
Adam Marton Cheat Sheet
Flourish newsrooms plan
Flourish - Stories
Examples from Fall Class
Basic Map
Flourish Links
–Basic Datawrapper
First Datawrapper Chart
Tutorials
Adam Marton Datawrapper Training
Automatic chart updates
Maps in Datawrapper
Tutorials
Adam Marton Datawrapper Training
Automatic chart updates
Maps in Datawrapper
Section 3: R for Data Journalists
–Introduction to R
Install R and R Studio.
Basic tutorial on R
R1_Intro-to-R exercises
Reading
Reproducible research Repetitive tasks in modern newsrooms
Popular R Libraries
Data Types and R
Reference: Logical Operators in R
Packages
Important Reference Materials
R and R Studio
Basic tutorial on R
R1_Intro-to-R exercises
Reading
Reproducible research Repetitive tasks in modern newsrooms
Popular R Libraries
Data Types and R
Reference: Logical Operators in R
Packages
Important Reference Materials
R and R Studio

–R data visualization
Basic GGPLOT
Using color
Formatting PNG for export
Scatterplots
Histograms
Box plots
Line graphs
ggplot cookbook 4-26-20.rmd
Using color
Formatting PNG for export
Scatterplots
Histograms
Box plots
Line graphs
ggplot cookbook 4-26-20.rmd
–R data cleaning
Data cleaning exercises using SF police data
Clean names, Process dates
top_n: table with just the top five counties’ crime rate
Grouping by Disposition
Filters
A more complex filter
String manipulation
Rename specific strings: str_replace_all
Using a lookup table to replace all the values
gsub - delete space
convert all text to lowercase
Make into html table
Make bubble chart
Data cleaning exercises, homeless children in Arkansas
–Cookbook of common tasks
A searchable list of useful command I have compiled.