16 Finance-Marketing Interface
Market-based assets are: relational and intellectual.
Relational market-based assets are “outcomes of the relationship between a firm and key external stakeholders, including distributors, retailers, end customers, other strategic partners”. (Srivastava, Shervani, and Fahey 1998)
For example, brand equity = relational assets between firms and their customers, while channel equity - relational assets between firms and their channel partners.
Intellectual market-based assets are “the types of knowledge a firm possesses about the environment, such as the emerging and the potential state of market conditions and the entities in it, including competitors, customers, channels, suppliers, and social and political interest group.” (Srivastava, Shervani, and Fahey 1998)
Marketing actions (e.g, adverting, product innovation) can build long-term assets (e.g., brand equity, customer equity), in turn increase short-term profitability (e.g., increase marketing effectiveness for dollars spent on advertising) (Rust et al. 2004)
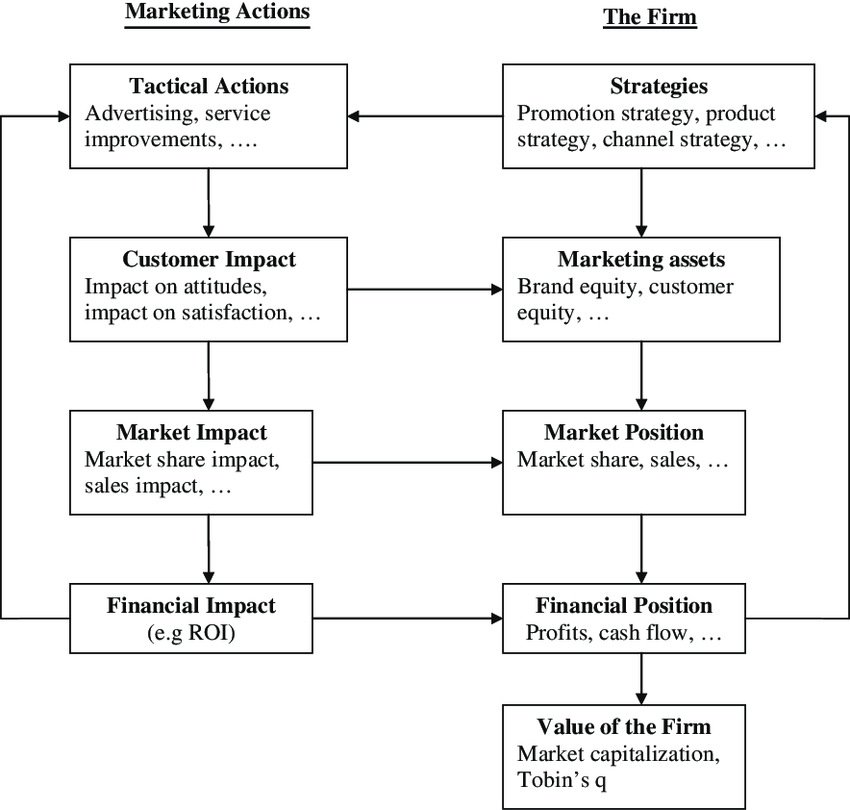
The Chain of Marketing Productivity (source (Rust et al. 2004))
Relationship between marketing and finance (Srivastava, Shervani, and Fahey 1998)
Stage 1: Market-based Assets
- Customer relationships: Brands, installed base.
- Partner Relationship: channels, co-branding network.
Stage 2:
- Faster Market penetration
- Price premium
- share premium
- extensions
- reduce sales/service costs
- Loyalty/ Retention
Stage 3: Shareholder value:
- Accelerate Cash Flows
- Enhance Cash Flows
- Reduce Volatility and Vulnerability of Cash flows
- Enhance Residual Value of Cash Flows.
(Grewal, Chandrashekaran, and Citrin 2010; McAlister et al. 2016; Morgan and Rego 2009) used Tobin’s Q in marketing research. since it is “forward-looking, risk-adjusted, and less easily manipulated by managers” (Wies et al. 2019). When probing factors affecting Tobin’s Q, it was suggested to control for financial leverage, and cash flows
S. J. Anderson, Chandy, and Zia (2018) found that there is a significant improvements from increasing both business skills (marketing and finance). However, the pathway to improve profits from marketing skills is via growth focus (e.g., higher sales, more investments in products, and employees). The pathway to improve profits from the finance skills is via efficiency or cost focus. Hence, the recommendation is that marketing/sales skills have better fit for startups, while finance/accounting skills are more needed in mature companies.
Cheong, Hoffmann, and Zurbruegg (2021) found that advertising investments is not only beneficial in terms of customers, but also in terms of investors since it reduces stock price synchronicity (i.e., a firm stock price follows closely to its industry moving)
Lacka et al. (2021) define price impact as” the impact on the variance of stock price.” They estimate the permanent and temporary price impacts of the firm-generated Twitter content of S&P 500 IT firms: firm-generated tweets induce both permanent and temporary price impacts, depending on valence and subject matter. Tweets reflecting only valence or subject matter concerning consumer or competitor orientation only have temporary price impacts, while those with both attributes generate permanent price impact. Moreover, negative valence tweets about competitors generate the largest permanent price impacts.
16.1 Marketing Value
(Hanssens and Pauwels 2016) argue for marketing value in a firm and how to appropriate assess its effectiveness and efficiency.
16.2 M&A
(H. Singh and Montgomery 1987)
-
Variable of interest:
DV: cumulative portfolio abnormal returns
IV: relatedness between acquirer and target
Similarity is the presence of technological or product-market relationships between acquirer and target
Data: 106 mergers (1975 - 1980)
Related firms create more value when merging
-
Variable of interest:
DV: merger dollar gains
IV: product-market fit (between acquirer and target)
Similarity is the presence of similar target markets, similar products, or both.
Data: 218 mergers (1962 - 1983)
Related firms create more value when merging
(Datta, Pinches, and Narayanan 1992)
-
Variable of interest:
DV: wealth effects
IV: # of bids, type of financing, and acquisition
Similarity is overlap in served markets
Data: 41 primary studies
Similar firms create more value when merging
-
Variable of interest:
DV: ROA
IV: Similarity in R&D, capital, and administrative intensities
Complementary is differences between acquirers and targets in R&D, capital, debt, and administrative intensity
R&D complementarity boosted unrelated acquisitions.
-
Variable of interest:
DV: ROA
IV: similarity in market coverage, operational efficiency, marketing activity, client mix, and risk propensity
Difference between acquirers and targets was based on a distance metric
Sample: 46 horizontal mergers (banking)
Differences impede horizontal banking merger success.
-
Variable of interest:
DV: ROA
IV: product-market relatedness and resource complementarities
Complementarity is the presence of related assets
Data: 24 mergers (case study)
Resource complementarities contribute to merging success
(Larsson and Finkelstein 1999)
-
Variable of interest
DV: Synergy realization
IV: combination potential, degree of integration achieved, lack of employee resistance
Data: 112 mergers (case study)
Complementary operations increase synergy, especially with organizational integration.
(Swaminathan, Murshed, and Hulland 2008) found that when merging organizations have poor strategic emphasis alignment, diversity improves value. In contrast, when merging organizations have strong strategic emphasis alignment, value is enhanced when the merger goal is consolidation.
For a summary of M&A research in marketing up until 2008 (see table 1, p. 34)
-
Contributions:
Strategic emphasis alignment is an important variable in merger value creation
Both resource similarity and resource complementarity create value (but under different merger motives)
marketing resources (e..g, advertising relative to R&D) affect M&A value creation.
-
Merger motives (p. 40):
Consolidation: to gain power by combining two firms with similar products and serving similar markets
related diversification: two firms that operate in completely non-overlapping businesses.
-
unrelated diversification: two firms in closely related industries
“related diversification in which firms gain access to and acquire a related technology”
“related diversification in which firms acquire a related product for product line filling”
Data: 206 M&A (electronics, chemicals, foods).
Method: event studies
Strategic emphasis was operationalized by substracting the firm’s R&D expenditures from its advertising expenditures and dividing it by the total assets of the firm in the year preceding the merger (following (Mizik and Jacobson 2003))
Strategic emphasis alignment: absolute value fo the difference between the acquirer strategic emphasis and that of the target.
(Swaminathan and Moorman 2009)
-
Contribution:
alliance annoucenments create value for firm
When network efficiency and density are moderate, they have the most favorable influence.
Network reputation and network centrality have no effect
marketing alliance capability (firm’s ability to management a network of previous marketing alliances), positively influence value creation.
-
Network features:
Network centrality: whether the company has partnerships (# of firms with which a firm is directly connected)
Network efficiency: The company’s network offers new capabilities (the degree to which the firm’s network of alliances involves firms that possess non-redundant knowledge, skills, and capabilities)
Network density: the firm’s network involves interconnections among firms (the degree of interconnectedness among various actors in a network)
Network reputation: the firm has a strong reputation (aggregate-level quality ascribed to firms in a firm’s network).
Marketing alliance capability: The company may handle marketing relationships
To construct the network variables, they were used from the period of 5 years before, but other research use 7 years (Gulati and Gargiulo 1999; Schilling and Phelps 2007)
-
How firm networks influence firm abnormal returns?
Networks multiply alliance benefits
Networks facilitate alliance compliance
Networks signal firms and alliance quality
-
Control variables:
Following (Dutta, Narasimhan, and Rajiv 1999), installed base of customers (firm sales), firm resources devoted to building customer relationships (firm receivables), marketing expenditures (firm selling, general, and administrative expenses), firm advertising expenditures. Then, add technical know-how (R&D expenditure). All of these variables use Koyck lag function, then combine under principal components analysis to avoid multicollinearity.
firm alliance experience
size of alliance partenrs (ratio of market cap of the firm to the partner)
Intraindusty alliances vs. interindustry alliances (following (Rindfleisch and Moorman 2001))
Repeat partnering
partner network characteristics (same network variables)
Selection model and value creation model because partnership may be based on referrals (following (Verbeek and Nijman 1992)
Umashankar, Bahadir, and Bharadwaj (2021) found that M&A decreases customer satisfaction that cannibalize firm value despite potential efficiencies (due to a shift by executives from customers attention to financial issues). The presence of marketing experts in upper echelons can mitigate this negative effect. Customer dissatisfaction with M&As might offset any synergy and efficiency advantages.
16.3 Stock Return Response Modeling
Valuation model
\[ MarketCap_{it} = \sum_{T = t}^\infty (\frac{1}{1 + r_{it}})^{T-t} E(CF_T) \]
Equivalently,
\[ MarketCap_{it} = (1 + Eret_{it}) MarketCap_{it-1}+ \sum_{T=t}^\infty (\frac{1}{1+r_{it}})^{T-t} \Delta E(CF_{iT}) \]
where
\(Eret\) = expected rate of return for an asset
\(\Delta E(CF_{iT})\) = change in the expected cash flows
Hence, the stock return can be written as
\[ StockReturn_{it} = \]