27 Where to from here?
You’ve just started your journey into the world of data analysis in a coding environment, and now know some methods for working in the programming language R (and even a bit of Python).
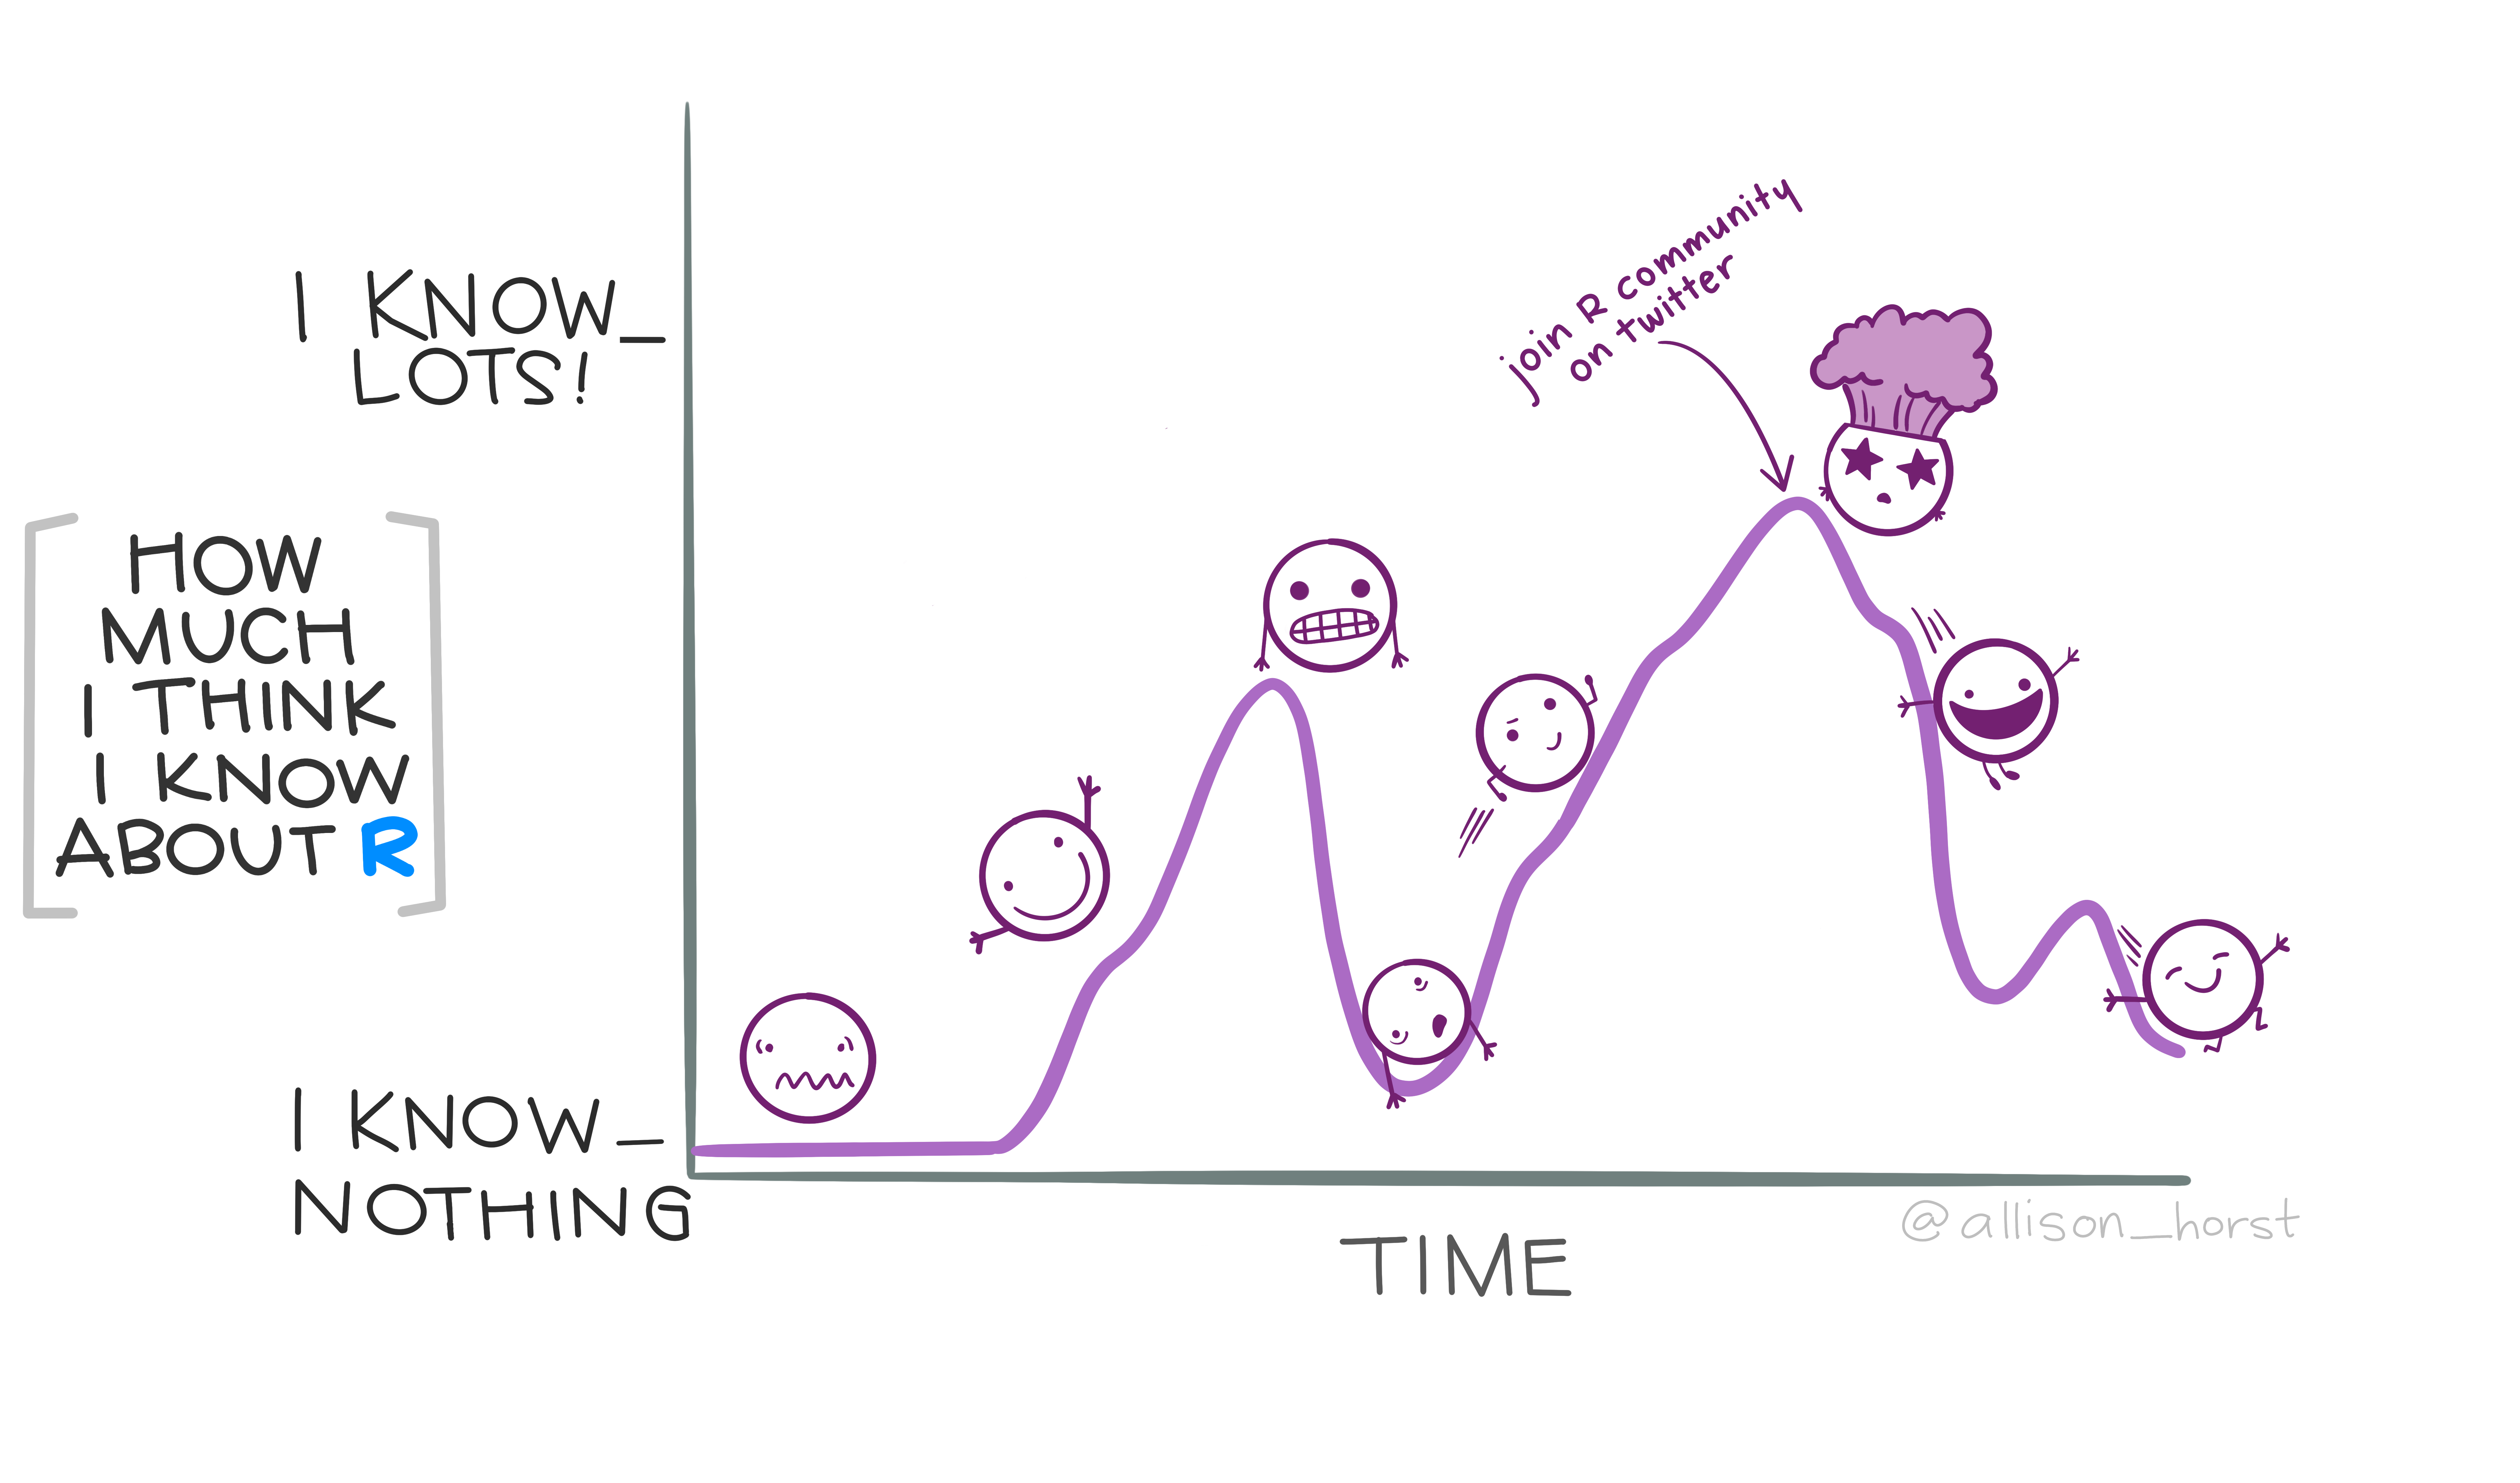
“R rollercoaster”: artwork by Allison Horst
So…where to from here?
With the foundation you now have, you can go in a variety of directions. And remember, they are not mutually exclusive! And this is not an exhaustive list.
27.1 More R for Data Science and beyond
We didn’t cover everything in R for Data Science. Here’s a short summary of those topics, and some next-steps to go beyond what’s in the book.
27.1.1 Workflow
We didn’t spend much time on the “Workflow” chapters of R for Data Science, but before you dive much deeper into R, particularly away from the cozy confines of the rstudio.cloud course space, I strongly recommend you review Workflow: projects.
(A slightly different version of this same content is hosted by RStudio at Using Projects)
There is also information on creating an RStudio project in the R Cookbook (2nd ed.), “Creating a New RStudio Project”.
The definitive guide to good working practices is What They Forgot to Teach You About R by Jenny Bryan and Jim Hester. (Jim Hester Jennifer Bryan 2020) From how to name files (and objects!) to debugging, this guide is an essential next step. I can’t recommend it enough.
Part of those project-oriented workflow methods is a little R package called {here}; the article “Using here with rmarkdown”
Another aspect of workflow is version control (think “track changes” for programming). This is often achieved using Git, and saved to GitHub. Getting familiar with that environment as part of your workflow will be valuable. The online book Happy Git and GitHub for the useR (Jim Hester Jennifer Bryan the STAT 545 TAs 2020) is a good introduction to that world.
27.1.2 Modeling
We covered two of the four chapters on statistical modeling that are included in R for Data Science. There’s a lot more!
See “Part IV Model” in R for Data Science, starting at 22 “Model: Introduction”
To go still further with modeling, you may wish to explore tidymodels:
The tidymodels framework is a collection of packages for modeling and machine learning using tidyverse principles.
Some other texts dealing with modeling methodologies using R include:
-
Scott Cunningham, Causal Inference: The Mixtape (Cunningham 2021)
Richard McElreath, Statistical Rethinking: A Bayesian Course with Examples in R and Stan (McElreath 2016)
-
Gareth James, Daniela Witten, Trevor Hastie, and Robert Tibshirani, An Introduction to Statistical Learning (Gareth James 2014)
27.1.3 Data visualization
We spent quite a bit of time working with {ggplot2}, adding more features to our plots. Some of you may have added {gganimate} functions to your capstone projects…which is one of (currently) 82 different packages that extend {ggplot2}. From plot types (like treemaps and mosaics) to themes and colour palettes these extensions are worth exploring.
The R Graph Gallery is another resource that can inspire and help you make the specific chart you want.
27.1.3.1 Mapping
There are also tools for working with spatial data, creating maps and working with GIS files in R…but that is well beyond the scope of this course! If you are interested in exploring this topic, here are some resources:
Robin Lovelace, Jakub Nowosad, and Jannes Muenchow, Geocomputation with R (1st ed.)
r-spatial, a collection of blog posts on using R to work with spatial data
Using Spatial Data with R, a workshop for working with spatial data
27.1.4 Functional programming
R, at its heart, is a functional programming (FP) language. This means that it provides many tools for the creation and manipulation of functions. –Hadley Wickham, Advanced R (Wickham 2015)
R, and specifically the package {purrr}, supports a concept called “functional programming”. This means that things like for-loops can be turned into functions; the {purrr} package has functions that do just that.
Of course, someone has to write loops. It doesn’t have to be you. — Jenny Bryan
See “Iteration” in R for Data Science, starting at 21.4 “For loops vs. functionals”
When we learned the concept of a for-loop earlier, we combined three Excel files. Here’s how we would do that using the map_() functions within the {purrr} package, with the added twists of:
getting all the data from all the sheets as well as all the files,
creating variables with the file name and the sheet name.
all_files <- dir("data_monthly/", pattern = "\\.xls*", full.names = TRUE)

result <- map_df(all_files, function(x) {
             #Get all the sheet names
             all_sheets <- readxl::excel_sheets(x)
             #read the excel file with one sheet at a time
             map_df(all_sheets, ~readxl::read_excel(x, sheet = .x) %>%
                       #add columns for filename and sheetname
                       dplyr::mutate(filename = basename(x), sheetname = .x))
})
To go even deeper into programming with R, I would suggest the book Advanced R by Hadley Wickham (Wickham 2019)
27.2 Data cleaning
“Data scientists spend 80% of their time cleaning data rather than creating insights” –unknown
There doesn’t seem to be much research to back up this assertion. But it’s true that the data you normally have won’t necessarily “work” to answer the research question you are trying to answer.
And having the skills to clean data is enormously valuable. Some of the things we’ve covered in this course will give you a running start.
- Randy Au, “Why’s it hard to teach data cleaning?”
This article explains that data cleaning is a project-specific challenge. But there are techniques that can be generalized (to some degree) to help you tackle the data cleaning challenges you confront.
I have started to write a book that introduces these techniques. The Data Preparation Journey: Finding Your Way with R will be published by CRC Press as part of “The R Series”. I am hoping to get this completed by mid-2022.
27.3 R Programming
If you are looking to move deeper into using R as a programming tool, I recommend two very different books:
-
Hadley Wickham, Advanced R. This is my first recommendation for anyone taking the step into programming R…moving beyond using it for data analysis.
The second edition is available online here: https://adv-r.hadley.nz/
It is published by CRC Press https://www.routledge.com/Advanced-R-Second-Edition/Wickham/p/book/9780815384571
-
Colin Gillespie & Robin Lovelace, Efficient R Programming: A Practical Guide to Smarter Programming. This book is aimed squarely at people who are writing R packages and putting R into production, where handling large volumes of data as efficiently as possible. Some of the specifics are now out-of-date (such as the speed benchmarks for different packages), but the principles remain useful.
Available online at https://csgillespie.github.io/efficientR/
Published by O’Reilly: https://www.oreilly.com/library/view/efficient-r-programming/9781491950777/
27.3.1 Writing R Packages
For some people, their way of contributing to the R open source community is to develop extensions to R’s functionality. There is a small team working on the core of base R, but there is a large and dynamic community that develops, extends, and maintains packages. As of right now, there are over 15,000 different packages on CRAN, and more available through Github repositories.
One of the first steps down this path is to create your own package, with your own functions. The single best resource for writing R packages is this book:
-
Hadley Wickham & Jenny Bryan, R Packages: Organize, Test, Document and Share Your Code
- The 2nd edition has not yet gone to print (another O’Reilly book), but the work-in-progress is available online: https://r-pkgs.org/index.html
27.4 Community
The R community is a universe of diverse people, using the tool for a variety of applications.
In particular, a sub-set of the community is a group of users that are learning and exploring the techniques in the book R for Data Science.
27.4.1 R for Data Science book club
There is an online book club that works its way through R for Data Science. If you’re interested in a combination of a refresher of BIDA302 and a deeper dive into some of the topics (see below), this self-directed and supported learning might be for you.
Information about the book club can be found at the GitHub repo github.com/r4ds/bookclub-R_for_Data_Science.
27.4.2 R4DS Learning Community
27.4.2.1 Tidy Tuesday
Focus on improving your craft, even if you end up with something simple!
–from the TidyTuesday page
There’s nothing like some practice to keep your skills sharp.
If you don’t have enough R at work or school, you might want to participate in Tidy Tuesday, a weekly event hosted by the R4DS learning community:
Every week we post a raw dataset, a chart or article related to that dataset, and ask you to explore the data. While the dataset will be “tamed”, it will not always be tidy! As such you might need to apply various R for Data Science techniques to wrangle the data into a true tidy format. The goal of TidyTuesday is to apply your R skills, get feedback, explore other’s work, and connect with the greater #RStats community! As such we encourage everyone of all skills to participate!
Recent Tidy Tuesday data sets have included the cost of transit, art collections, the national census from Kenya, and plastic pollution.
In addition, the R4DS learning community hosts a Slack channel - with Office Hours to assist people tackling challenges.
Some more information about the R4DS learning community hosts can be found in this slide deck from the 2019 useR! conference: How can we help?
27.4.3 In-person / virtual community
A list of R conferences and meetings—“This site attempts to list R conferences and local useR groups”
R User Groups
Conferences
-
useR! is an internation conference hosted by the R Foundation
RStudio hosts a large annual conference; the rstudio::global(2021) conference was online
regional conferences (including Cascadia R which has a focus on R users in Alaska, British Columbia, Washington, Oregon, and California)
EARL (London UK and occasional USA)—Enterprise Applications of the R Language, focussed on the use of R in industry and government
-
BC Government employees:
- Data Science Community (R and Python users)
27.5 Keep up with the latest changes
The R ecosystem is continuously changing. The core of R changes slowly and steadily, but the package universe continues to expand.
But how can you keep up with all of this? The answer is “you can’t”. But the most effective strategy is to become part of the R user community. Connecting to the R user community will help you learn more, and one day, you’ll be one of the people contributing.
The twitter hashtag #rstats provides a steady stream of questions and answers, links to new packages, and other news. You can find me at (monkmanmh?).
Conferences, meet-ups, and other events (listed above). Most conferences are posting their proceedings, including videos of talks. Some of these will be about new packages and techniques, or novel applications of existing techniques.
Blog articles. R-bloggers is an aggregator of blog articles written about R.
27.6 Other courses & training
27.6.1 BIDA at UVic
Of course, the other courses in the BIDA series at UVic!
BIDA 301 Business Intelligence and Data Analytics Fundamentals
BIDA 404 Data Visualization and Reporting
BIDA 405 Data Analytics Provisioning, Importing, Extracting and Manipulation
BIDA 406 Predictive Data Analytics and Modelling