28 Introduction
28.1 Project description
A small project that will require the application of all of the concepts introduced
importing data
data wrangling—all the necessary data tidying and transformations
data modeling and summarization
communication (including tabular and plotting visualization)
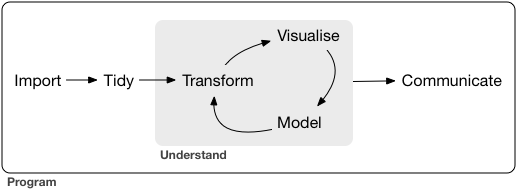
The data science process
To do this, you will have the end already defined: a summary table and/or a plot of some data that has been published.
- In the defined projects, you are to replicate a summary table and plot—you will have all the necessary data, and the end-goal. It’s up to you to use your data analytics coding skills to create that summary table, plot.
The project will be introduced in Week 4.
Some projects will be available for you to choose, but you may also bring your own data. Talk to the instructor to ensure that your project goals are suitable; past experience has indicated that “projects from home” are likely to be more than is required for this course! We can work to ensure that the scope is feasible for the time available, and will set you up for further development if you want to continue.
28.2 Project assessment
| MARKS | OUTCOME |
|---|---|
| 5 | data import, including defining the variable types |
| 10 | tidying and manipulation |
| 10 | visualization—tables and plots |
| 5 | going beyond—this might included adding an additional table, plot, or statistical model, or using functions so that your code isn’t as WET |
| 10 | documentation throughout, explaining what the following R code chunk is doing |
| 40 | TOTAL |