5 Assignment 1 - data wrangling
Package load:
5.1 Introduction
For this homework assignment, please write your answer for each question after the question text but before the line break before the next one.
In some cases, you will have to insert R code chunks, and run them to ensure that you’ve got the right result.
Use all of the R Markdown formatting you want! Bullets, bold text, etc. is welcome.
Once you have submitted your assignment, I will be hitting the “Knit” button—please ensure that the output renders correctly.
5.2 Questions
1. Assign a variable
(1 mark)
Why does this code chunk not work?
stringlenght <- 10

stringlength
Look carefully! (This may seem like an exercise in pointlessness, but training your brain to notice even the tiniest difference will pay off when programming.)
2. Reducing the size of your data set
(3 marks)
Starting with the {mpg} data frame, use filter() and select() to create a single table that contains the following records and variables:
compact and subcompact Volkswagens from the model year 1999
manufacturer, model, mileage in both city and highway
mpg## # A tibble: 234 × 12
## manufacturer model displ year cyl trans drv cty hwy fl class mpg_per_cubic_l…
## <chr> <chr> <dbl> <int> <int> <chr> <chr> <int> <int> <chr> <chr> <dbl>
## 1 audi a4 1.8 1999 4 auto(l5) f 18 29 p comp… 16.1
## 2 audi a4 1.8 1999 4 manual(… f 21 29 p comp… 16.1
## 3 audi a4 2 2008 4 manual(… f 20 31 p comp… 15.5
## 4 audi a4 2 2008 4 auto(av) f 21 30 p comp… 15
## 5 audi a4 2.8 1999 6 auto(l5) f 16 26 p comp… 9.29
## 6 audi a4 2.8 1999 6 manual(… f 18 26 p comp… 9.29
## 7 audi a4 3.1 2008 6 auto(av) f 18 27 p comp… 8.71
## 8 audi a4 quattro 1.8 1999 4 manual(… 4 18 26 p comp… 14.4
## 9 audi a4 quattro 1.8 1999 4 auto(l5) 4 16 25 p comp… 13.9
## 10 audi a4 quattro 2 2008 4 manual(… 4 20 28 p comp… 14
## # … with 224 more rows3. Selecting variables
(1 mark)
What happens if you include the name of a variable twice in a select() call? Demonstrate using the {gapminder} data. (The package is installed in the workspace, but you will have to load it to access it…)
4. R Markdown
(1 mark)
The following chunk of code produces a chart. When this notebook is previewed, the R code inside the chunk is also rendered.
Enter a chunk option so that the chart shows in the output, but the code does not.
(Hint: use the RMarkdown cheatsheet to find the solution!)
# hide this code!
ggplot(data = mpg) +
  geom_point(mapping = aes(x = displ, y = hwy))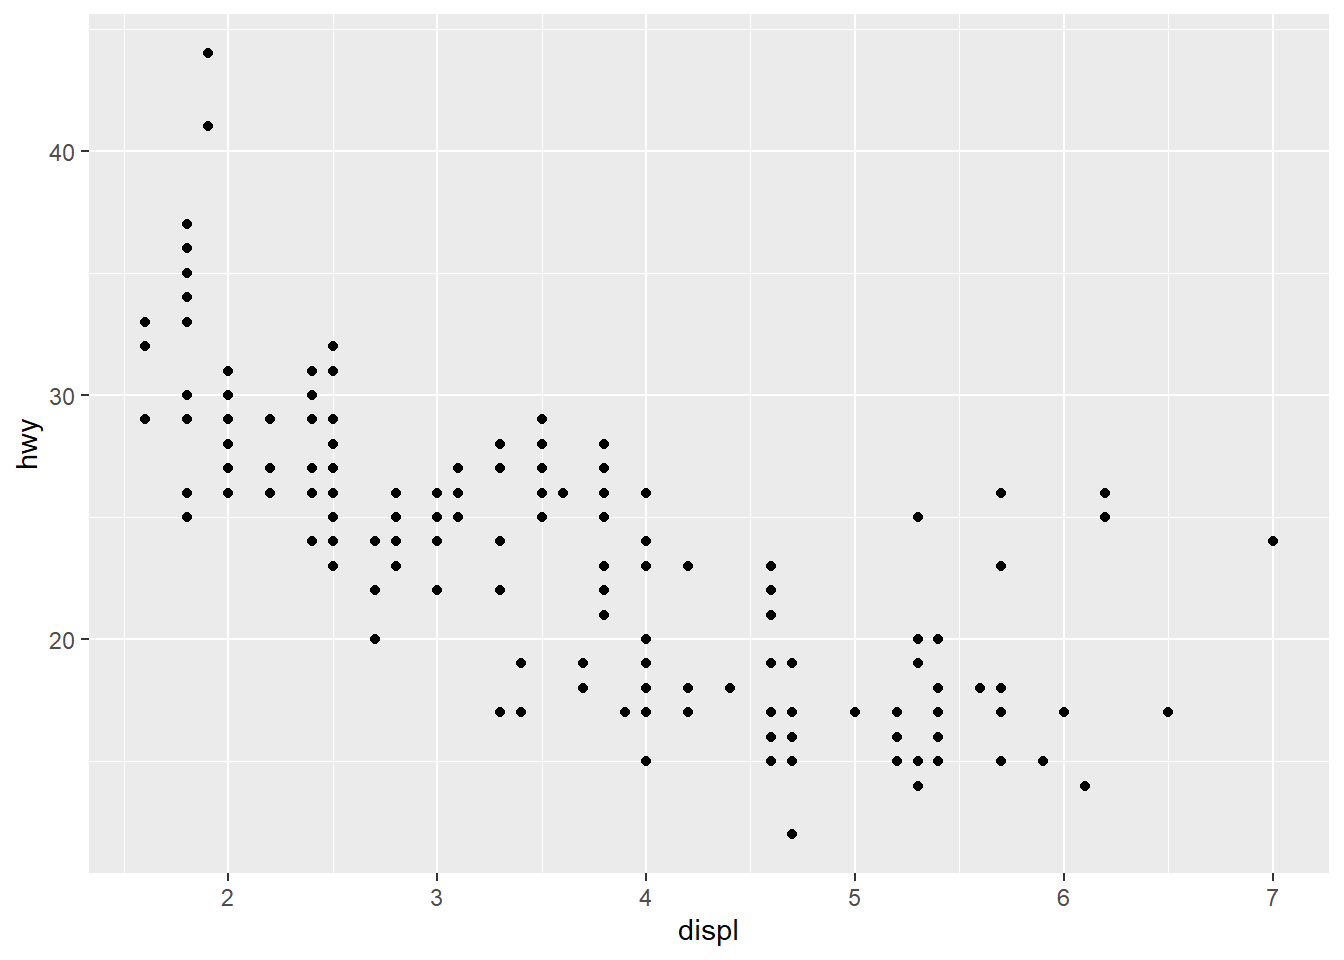
5. Flight data
(6 marks)
For Q3a-3d, use the data nycflights13::flights
Pay close attention to how the variables are coded.
Using the data in the nycflights13::flights table, find all flights that:
Had an arrival delay of two or more hours
Flew to Houston (there are two airports, with the codes IAH or HOU)
Were operated by United, American, or Delta (you may want to review the separate airlines table to check the codes for each airline)
Departed in summer (July, August, and September)
-30-