Chapter 1 Introduction
1.1 The origin of data
Data is proliferating, collected as part of scientific research (whether measuring sub-atomic particles or galaxies in the early universe, plant growth or the migration of animals, people’s socio-economic characteristics or where they live and work in cities), and by the tools that are used to conduct the business of the world.
Today, data about you might be collected when you:
Buy a cup of coffee at a café. This generates at least three types of data: about the type of drink you ordered, about your coffee habits through the rewards program, and about the financial transaction—which are used by the store to measure sales and by you to manage your personal budget.
Use a streaming service to watch a movie or listen to some music. The service provider builds a profile about your preferences, which it can then use to make recommendations as to what you might also enjoy. The service can also use the aggregated data from all subscribers to evaluate the success of the content on their platform, and pay the creators of the content.
Renew your driver’s license. Information about you such as date of birth, height, weight, and current address is recorded, which you can then use as a piece of identification to authenticate who you are. The licensing agency can also use the data in aggregate to estimate how many people will be renewing their licenses each month, and often share the data (securely, of course!) with other agencies. In British Columbia, the agency that licenses drivers shares elements of the database, such as your current address, with the provincial electoral agency who uses that information to maintain an up-to-date list of eligible voters in the province. (Elections BC 2018, 70)
Travel to your place of work or study, captured through the movement of your cell phone. Aggregated location and movement can be used for a variety of purposes, including use by GPS systems to indicate areas of road congestion, or to let you know when the next bus will arrive at your stop.
Respond to a survey, perhaps asking for your opinions about the platforms of various political parties and the people who represent those parties.
1.2 Analyzing data: the data science process
A lot has been written about the benefits of organizations being “data-driven”, when good data analysis leads to better decisions. There is no limit to the contexts where data analysis is being applied. In the private sector, businesses can compete on analytics (Davenport and Harris 2007), including retailers (Colson et al. 2017) and supply chain management (Ashton 2018). It can also be used in the public sector: data analysis can inform public health strategies during a pandemic (Polonsky et al. 2019).
The process of going from raw data, collected during processes like those described above, to support decision making is often called data science. Data science combines the academic disciplines of statistics, computer programming, and the subject matter (be it astronomy, psychology, economics, or business). (Conway 2010)
The typical data science process has been described in this model (Wickham, Çetinkaya-Rundel, and Grolemund 2023):
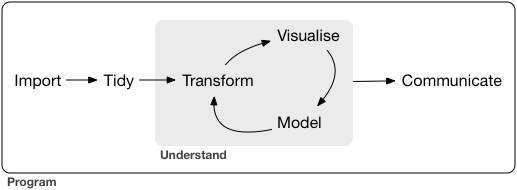
The generalist data scientist has a hand in all the steps through this workflow (Monkman 2019); in this book we will focus on the Import to Tidy to Transform steps. We will also see how “Visualise” is an important part of Exploratory Data Analysis, a strategy for identifying potential problems with the data prior to cleaning.
1.3 Data in the wild
Most data science and statistics textbooks use example data sets that are nicely formatted and easy to import. Anscombe’s Quartet (Anscombe 1973) is a famous example of a small data set that was designed to produce specific statistical results; it is included in the base version of R (R Core Team 2021). Other data sets might be excerpted to use as teaching examples (Bryan 2017), chosen for their statistical properties (A. M. Horst, Hill, and Gorman 2022), compiled as examples to demonstrate a methodology or technique (Kuhn 2020), or used to clean, validate, and aggregate still-larger data collections (Friendly et al. 2020).
But in real life the data we find ourselves working with is, more often than not, entirely different from those text book examples.
Classroom data are like teddy bears; real data are like a grizzly with salmon blood dripping out of its mouth. 1
Data can be stored in different formats–spreadsheets, databases, software-specific file formats, websites, and PDF files. We need to have tools to access the data, no matter the file format.
The data might be stored in an untidy layout (Wickham 2014), or inconsistently structured.
We might receive data from multiple sources, so we end up with two files that have the same value but are coded in different ways. For example, my home province in Canada can be represented as “British Columbia”, “B.C.”, or “BC”. All three are accurate, but these variations can cause problems if they are inconsistent across the data sources (or even more problematically, in the same variable). And don’t get me started on date formats—we’ll save that for later.
Data might have as-of-yet undetected errors. It might be incomplete, inconsistent, or it might have data entry mistakes and typos.
It might have bias…and there are many different types of bias.
The data may come from an administrative source, and collected for a purpose other than research. In these cases, you may need to transform that data to fit the requirements of the research question.
This book will introduce steps necessary to ensure that you can assemble your data in a way that allows you to undertake the rest of the data science process, including sharing the data with other data analysts who might seek to use the data in further analysis.
1.4 Data collection
Before we can start our data science workflow—before we get to the “Import” step—someone has to collect the data. This book won’t cover the process of collecting data, a topic both broad and deep. Included in that would be determining the research question (or hypothesis) or business need that the data will support, designing the experiment or the business process to be captured (both could include a survey questionnaire), and undertaking the experiment (including fieldwork) or implementing the business data collection. The details of the data collection process are often domain-specific, so I encourage you to seek out reference materials that are tailored for your chosen subject area.
References
quote attributed to Jenny Bryan, “Teach Data Science and They Will Come,” Joint Statistical Meetings, 2015↩︎