5 1991 full system analyses
5.1 Total leaf area of the front and back shoots in 1991.
This analysis uses all systems that have a non-NA value for total leaf area of the front and back in 1991, excluding those systems for which 1990 leaf area was NA.
5.1.1 Data & visualization
Read in data
# set na.strings="." to recode '.' to NA
mayappleDatasetFull<-readxl::read_excel("Datasets/mayapple_1990_updated.xlsx", na=".")
Select the total leaf area variable, and the independent variables. Also filtering out rows that don’t have a leaf area record in 1990. We need to do this in order to be able to compare models from model set A (which don’t include leaf area, and so wouldn’t naturally be affected by the missing data) with models from model set B (which do include leaf area and would be affected by the missing data). In other words, removing these rows means that model set A and model set B will run using the exact same dataset, which is necessary in order for us to compare the models.
# select variables for analysis and filter out rows that don't have a leaf area recorded in 1990
mayappleData <- mayappleDatasetFull %>%
  dplyr::select(COLONY,Lf_90,Sex_90,Sever,Time,Lftot_91) %>%
  mutate(Lftot_91=parse_double(Lftot_91)) %>%
  filter(!is.na(Lf_90)) %>%
  filter(!is.na(Lftot_91))

ggplot(data=mayappleData, aes(x=Sever, y=Lftot_91, fill = Time)) +
   stat_summary(fun = mean, geom = "bar",position="dodge") +
  stat_summary(fun.data = mean_se, geom = "errorbar", position="dodge")+
  facet_wrap(~Sex_90) +
  ylab("Mean total leaf area \n in front and back shoots in 1991") +
  scale_fill_brewer(palette="Set1")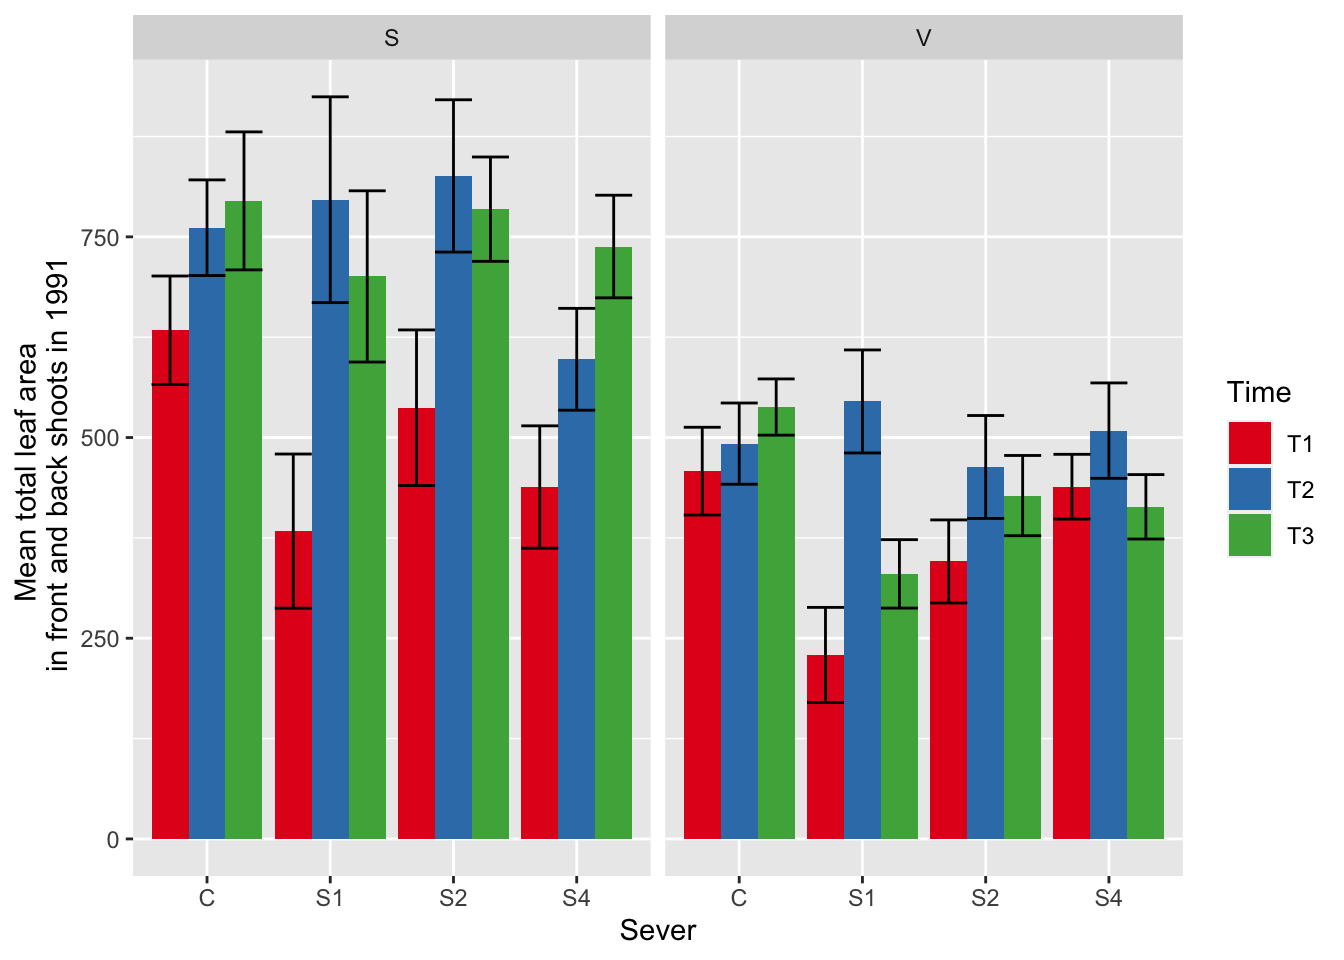
5.1.2 Model selection with leaf area
t_mod91la.0l<-lmer(Lftot_91~Sex_90*Sever*Time +Lf_90+(1|COLONY), data = mayappleData, na.action ="na.fail",REML=FALSE)


#this is the global model
#MuMIn::getAllTerms(t_mod91la.0l) #this lets us see how to specify terms in the model

dr<-dredge(t_mod91la.0l, fixed=~Lf_90)
knitr::kable(head(dr, n=10)) %>%
  kable_styling() %>%
scroll_box(width = "100%", box_css = "border: 0px;")| (Intercept) | Lf_90 | Sever | Sex_90 | Time | Sever:Sex_90 | Sever:Time | Sex_90:Time | Sever:Sex_90:Time | df | logLik | AICc | delta | weight | |
|---|---|---|---|---|---|---|---|---|---|---|---|---|---|---|
| 40 | 107.34845 | 0.8316480 |
|
|
|
NA | NA |
|
NA | 12 | -3150.540 | 6325.795 | 0.0000000 | 0.25574814 |
| 48 | 112.91565 | 0.8353311 |
|
|
|
|
NA |
|
NA | 15 | -3147.488 | 6326.085 | 0.2897554 | 0.22125490 |
| 6 | 94.22383 | 0.9132808 |
|
NA |
|
NA | NA | NA | NA | 9 | -3154.320 | 6327.050 | 1.2546874 | 0.13657166 |
| 8 | 143.39677 | 0.8459421 |
|
|
|
NA | NA | NA | NA | 10 | -3153.615 | 6327.732 | 1.9365805 | 0.09711568 |
| 16 | 147.30686 | 0.8504631 |
|
|
|
|
NA | NA | NA | 13 | -3150.463 | 6327.763 | 1.9684227 | 0.09558174 |
| 39 | 52.22870 | 0.8364827 | NA |
|
|
NA | NA |
|
NA | 9 | -3154.980 | 6328.369 | 2.5742828 | 0.07060152 |
| 5 | 46.60224 | 0.9103604 | NA | NA |
|
NA | NA | NA | NA | 6 | -3158.655 | 6329.499 | 3.7043271 | 0.04012620 |
| 2 | 117.22338 | 0.9554603 |
|
NA | NA | NA | NA | NA | NA | 7 | -3157.669 | 6329.593 | 3.7974889 | 0.03829995 |
| 7 | 89.47014 | 0.8505375 | NA |
|
|
NA | NA | NA | NA | 7 | -3158.095 | 6330.445 | 4.6495135 | 0.02501402 |
| 12 | 148.06192 | 0.9258488 |
|
|
NA |
|
NA | NA | NA | 11 | -3154.160 | 6330.924 | 5.1285510 | 0.01968619 |
From this round of model selection, when Lf_90 is required to be in the models that are considered, there are five models within two AICc units: (1) Lf_90, Sever, Sex_90, Time, and the Sex_90 x Time interaction (AICc 6325.8) (2) Lf_90, Sever, Sex_90, Time, the Sex_90 x Time interaction, and the Sever x Sex_90 interaction (AICc 6326.1) (3) Lf_90, Sever, and Time (AICc 6327.0) (4) Lf_90, Sever, Sex_90, and Time (AICc 6327.7) (5) Lf_90, Sever, Sex_90, Time, and the Sever x Sex_90 interaction (AICc 6327.8)
5.1.3 Model selection without leaf area
## Fixed term is "(Intercept)"knitr::kable(head(dr, n=10)) %>%
kable_styling() %>%
scroll_box(width = "100%", box_css = "border: 0px;")| (Intercept) | Lf_90 | Sever | Sex_90 | Time | Sever:Sex_90 | Sever:Time | Sex_90:Time | Sever:Sex_90:Time | df | logLik | AICc | delta | weight | |
|---|---|---|---|---|---|---|---|---|---|---|---|---|---|---|
| 80 | 107.34844 | 0.8316480 |
|
|
|
NA | NA |
|
NA | 12 | -3150.540 | 6325.795 | 0.0000000 | 0.25574814 |
| 96 | 112.91565 | 0.8353311 |
|
|
|
|
NA |
|
NA | 15 | -3147.488 | 6326.085 | 0.2897554 | 0.22125490 |
| 12 | 94.22383 | 0.9132808 |
|
NA |
|
NA | NA | NA | NA | 9 | -3154.320 | 6327.050 | 1.2546874 | 0.13657166 |
| 16 | 143.39676 | 0.8459421 |
|
|
|
NA | NA | NA | NA | 10 | -3153.615 | 6327.732 | 1.9365805 | 0.09711568 |
| 32 | 147.30686 | 0.8504631 |
|
|
|
|
NA | NA | NA | 13 | -3150.463 | 6327.763 | 1.9684227 | 0.09558174 |
| 78 | 52.22870 | 0.8364827 | NA |
|
|
NA | NA |
|
NA | 9 | -3154.980 | 6328.369 | 2.5742828 | 0.07060152 |
| 10 | 46.60224 | 0.9103604 | NA | NA |
|
NA | NA | NA | NA | 6 | -3158.655 | 6329.499 | 3.7043271 | 0.04012620 |
| 4 | 117.22338 | 0.9554603 |
|
NA | NA | NA | NA | NA | NA | 7 | -3157.669 | 6329.593 | 3.7974889 | 0.03829995 |
| 14 | 89.47014 | 0.8505375 | NA |
|
|
NA | NA | NA | NA | 7 | -3158.095 | 6330.445 | 4.6495135 | 0.02501402 |
| 24 | 148.06192 | 0.9258488 |
|
|
NA |
|
NA | NA | NA | 11 | -3154.160 | 6330.924 | 5.1285510 | 0.01968619 |
From this round of model selection, when Lf_90 is not required to be in the models that are considered, the same five best models are returned.
5.1.4 Conclusion
The simplest and best model here is contains Lf_90, Sever, and Time.
5.1.5 Estimated marginal means
the main effect of sever
g1 <- ggplot(data=mayappleData, aes(x=Sever, y=Lftot_91)) +
  geom_bar(stat="summary", fun.y = "mean", position = "dodge") +
  ylab("Mean total leaf area \n in front and back shoots in 1991")

emmeans(t_mod91la.bm, pairwise~Sever, type="response")
## $emmeans
## Sever emmean SE df lower.CL upper.CL
## C 592 26.4 134 539 644
## S1 515 30.4 191 455 575
## S2 559 29.2 178 501 616
## S4 501 27.3 147 447 555
##
## Results are averaged over the levels of: Time
## Degrees-of-freedom method: satterthwaite
## Confidence level used: 0.95
##
## $contrasts
## contrast estimate SE df t.ratio p.value
## C - S1 76.7 36.3 431 2.117 0.1493
## C - S2 33.0 35.3 431 0.934 0.7868
## C - S4 91.0 33.7 428 2.697 0.0364
## S1 - S2 -43.8 38.3 433 -1.141 0.6642
## S1 - S4 14.3 37.0 436 0.385 0.9806
## S2 - S4 58.0 36.1 433 1.608 0.3749
##
## Results are averaged over the levels of: Time
## Degrees-of-freedom method: satterthwaite
## P value adjustment: tukey method for comparing a family of 4 estimates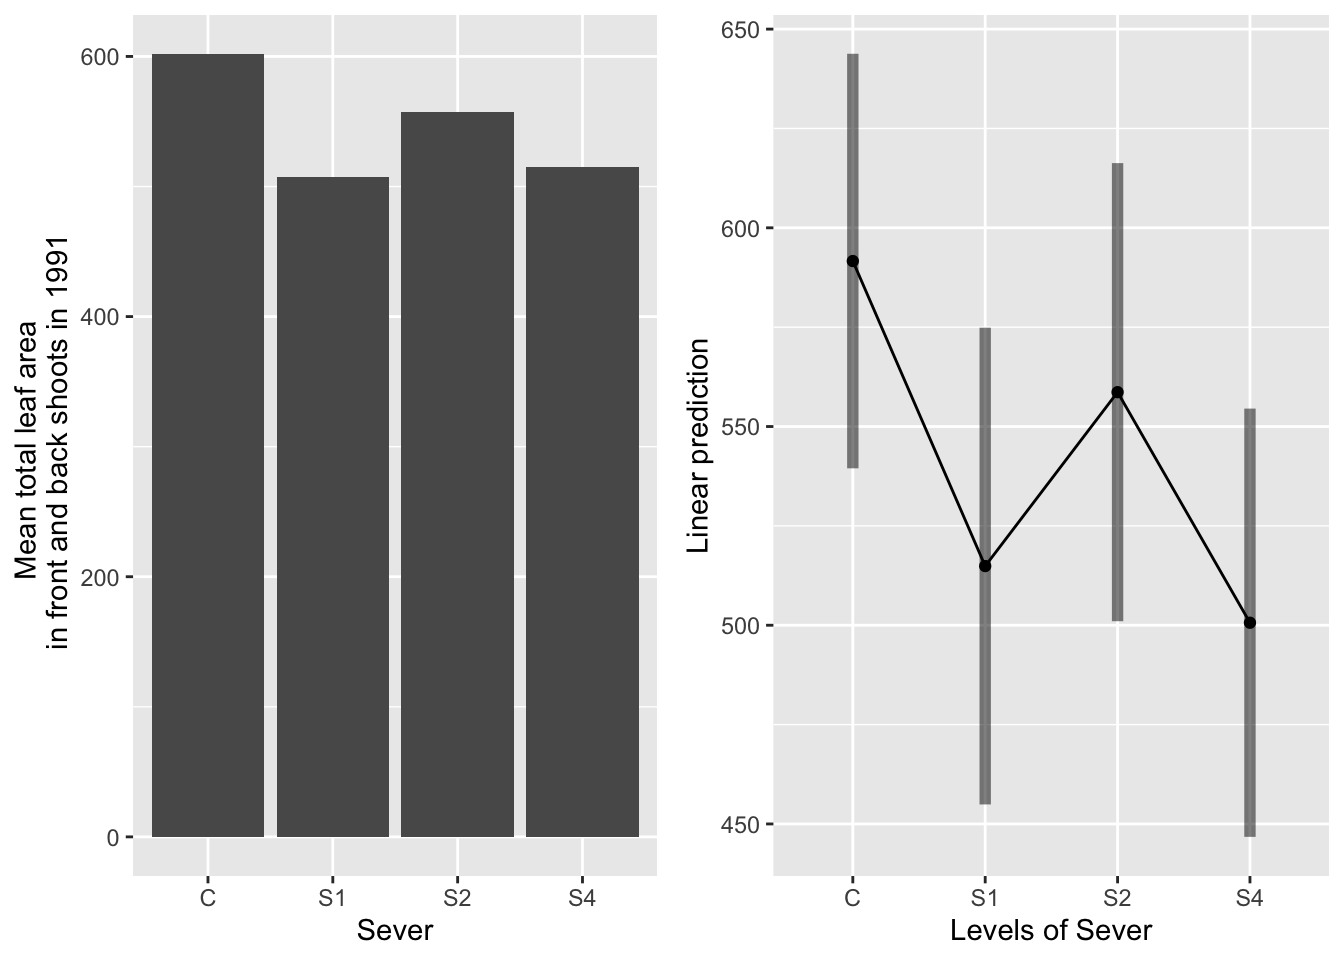 Control systems have more overall leaf area than S4 systems, but all other comparisions are non significant. This suggests that leaf area in total was roughly equivalent across all of the treatments.
the main effect of time
g1 <- ggplot(data=mayappleData, aes(x=Time, y=Lftot_91)) +
  geom_bar(stat="summary", fun.y = "mean", position = "dodge") +
  ylab("Mean total leaf area \n in front and back shoots in 1991")

emmeans(t_mod91la.bm, pairwise~Time, type="response")
## $emmeans
## Time emmean SE df lower.CL upper.CL
## T1 498 25.6 121 447 549
## T2 579 24.6 104 531 628
## T3 547 26.1 124 495 599
##
## Results are averaged over the levels of: Sever
## Degrees-of-freedom method: satterthwaite
## Confidence level used: 0.95
##
## $contrasts
## contrast estimate SE df t.ratio p.value
## T1 - T2 -81.1 31.3 432 -2.593 0.0266
## T1 - T3 -48.7 32.4 432 -1.502 0.2910
## T2 - T3 32.4 31.1 432 1.040 0.5519
##
## Results are averaged over the levels of: Sever
## Degrees-of-freedom method: satterthwaite
## P value adjustment: tukey method for comparing a family of 3 estimates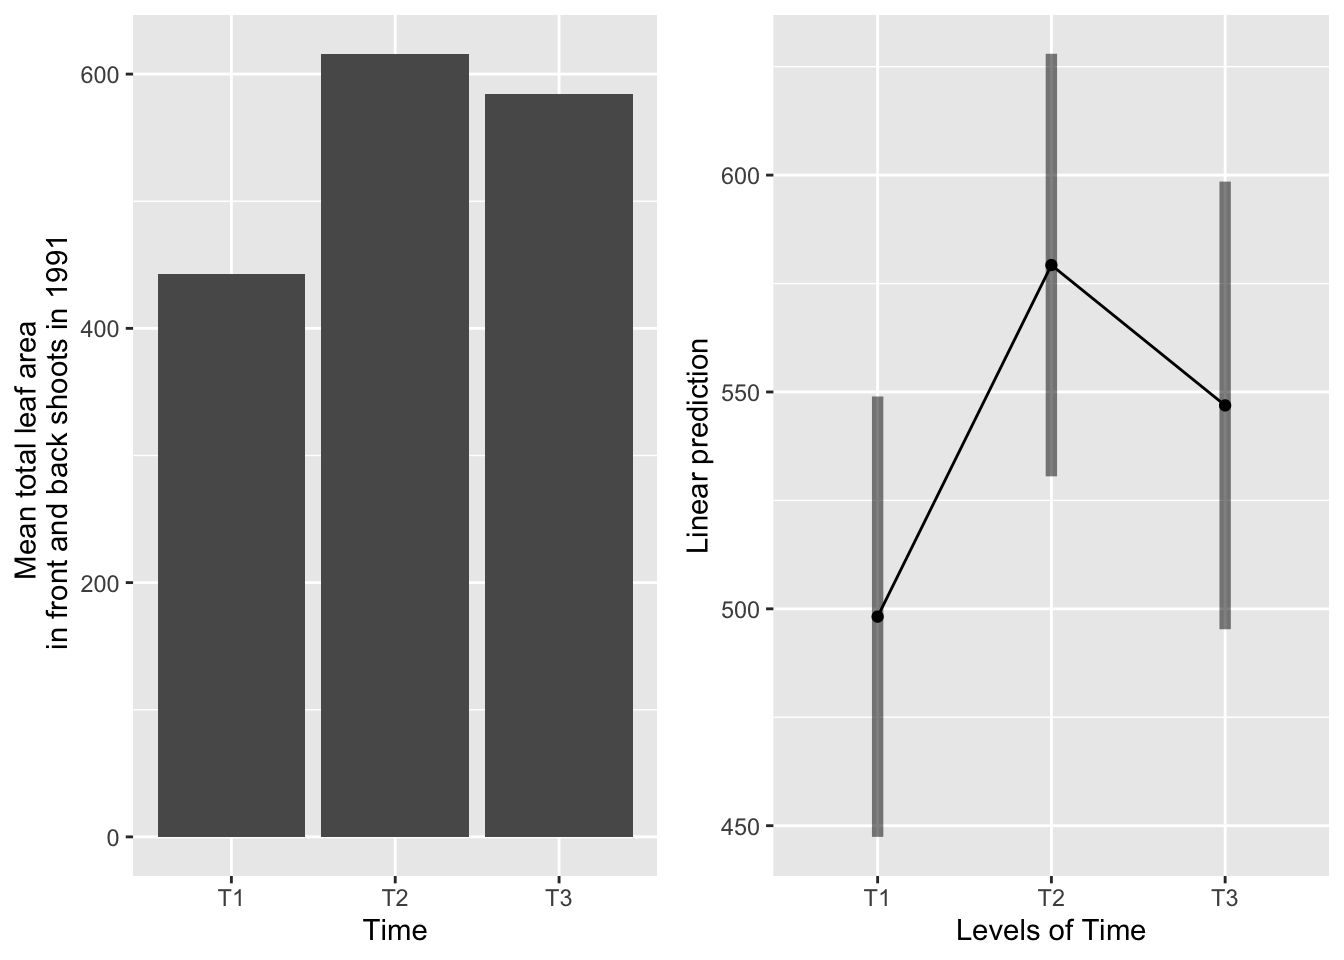 Systems severed at T1 produce less leaf area than those severed at T2. T3 is intermediate to T1 and T2 but not different from either.
the main effect of leaf area in 1990
mylist <- list(Lf_90=seq(150,1250,by=100))
g1 <- ggplot(data=mayappleData, aes(x=Lf_90, y=Lftot_91, color=Sever)) +
geom_point() + geom_smooth(method = "lm", se = FALSE)+
facet_wrap(~Time) +
ylab("Mean total leaf area \n in front and back shoots in 1991")
g2 <- emmip(t_mod91la.bm, Sever~ Lf_90|Time , at=mylist)
gridExtra::grid.arrange(g1,g2,nrow=1)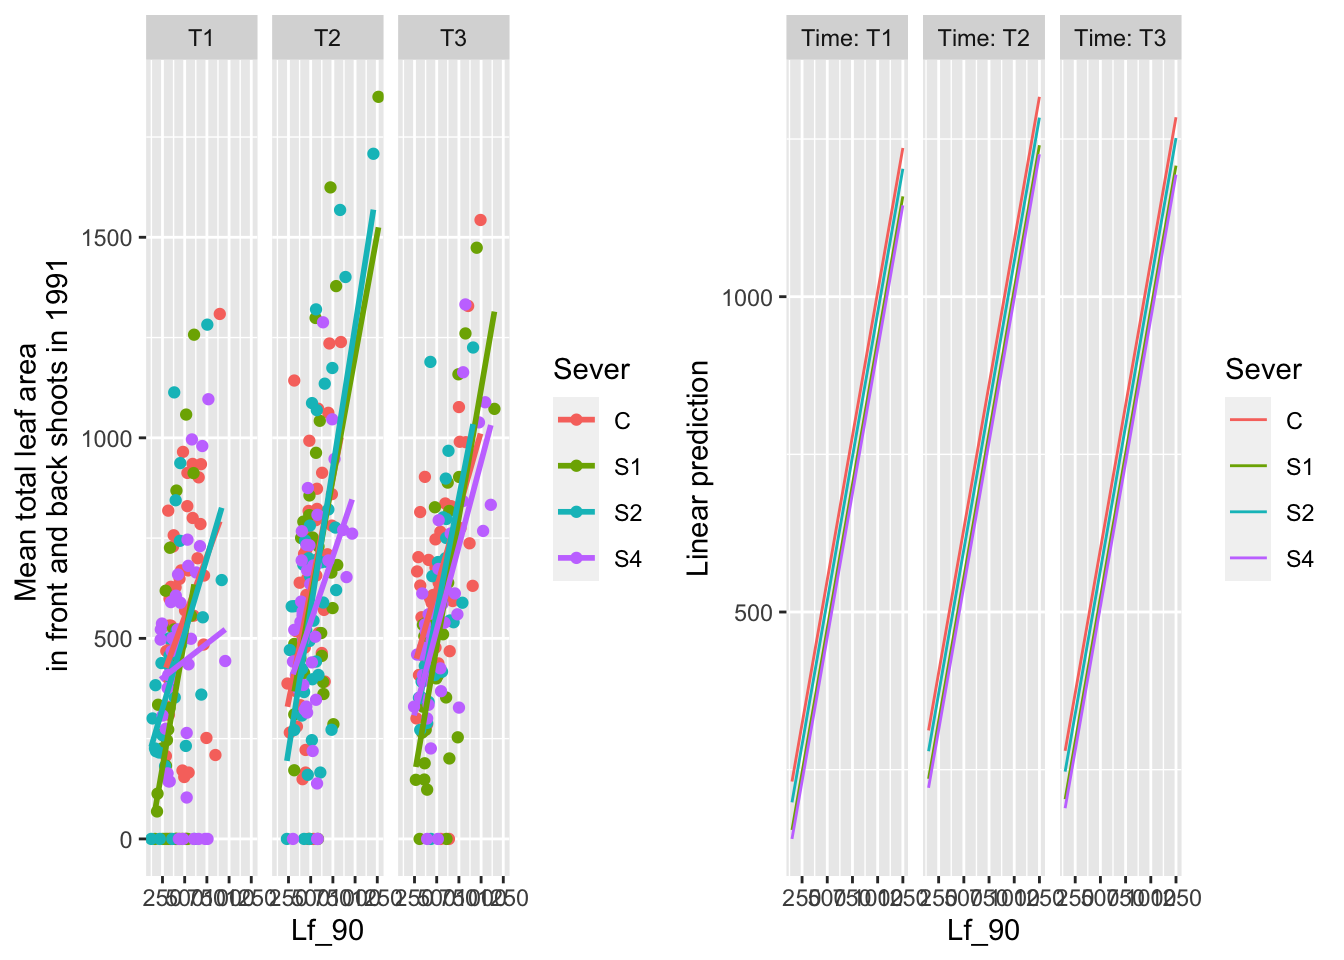 Overall, the relationships between leaf area in 1990 and total leaf area in 1991 seem fairly similar across the severing treatments and times. One potential exception are the systems that were severed at S4 and T1, which seems to have a weaker correlation. Also interesting to note that there seem to be more points with zero total leaf area in 1991 in the T1 panel relative to the other panels.