Unit 7 The Frequency Domain
7.1 Review of sine and cosine
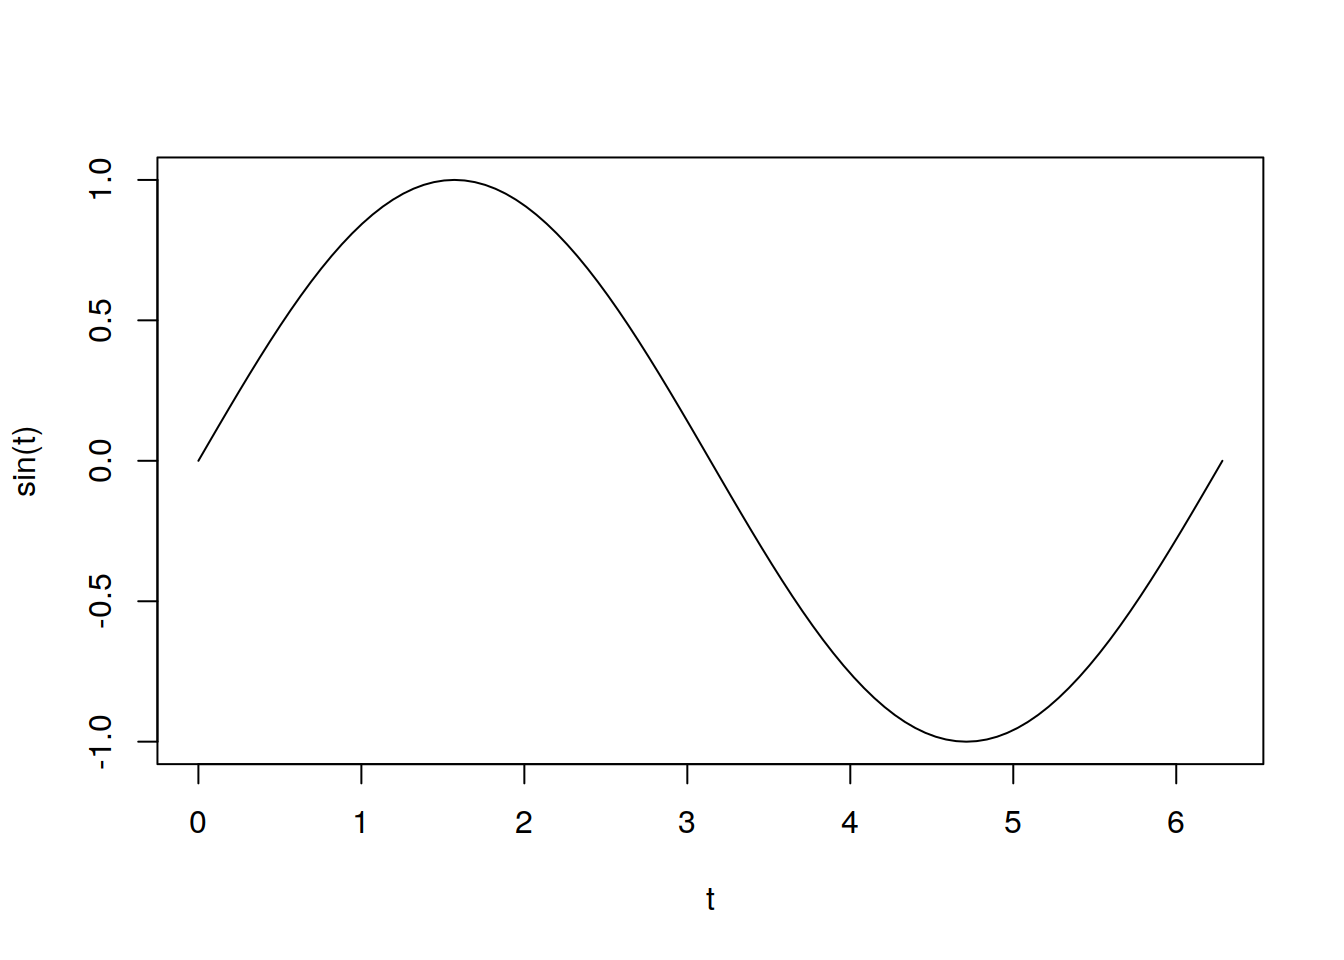
7.1.1 Phase shifts
This is what a sine wave looks like
\[\delta = 0; y = \mathrm(sin)(t)\]
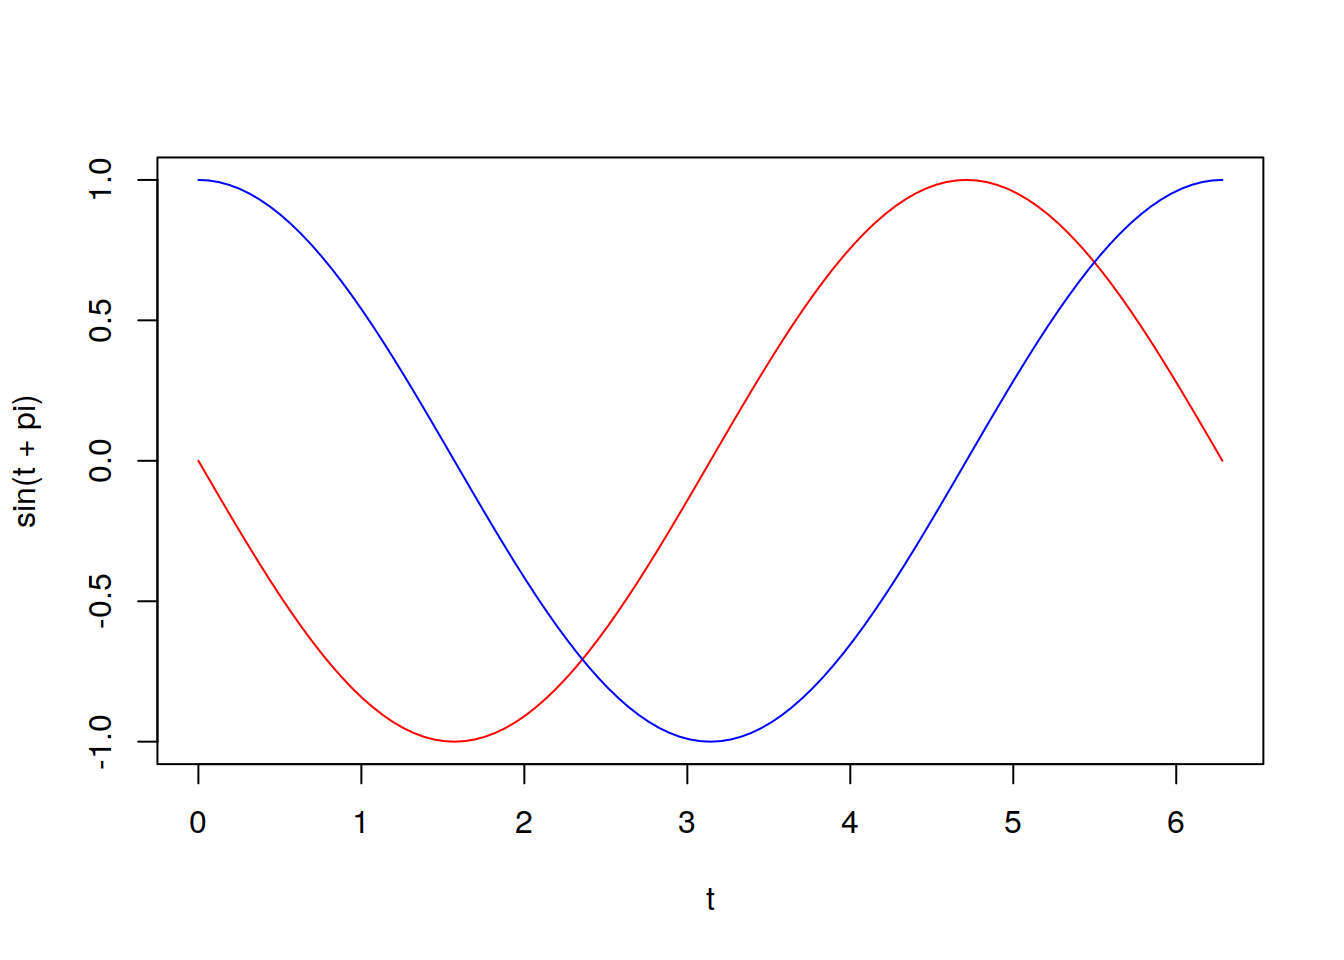
We can phase shift the sin wave by adding
RED: \[\delta = \pi; y = \mathrm{sin}(t+\pi)\]
BLUE:
\[\delta = \frac{\pi}{2}; y = \mathrm{sin}(t+\frac{\pi}{2})\]
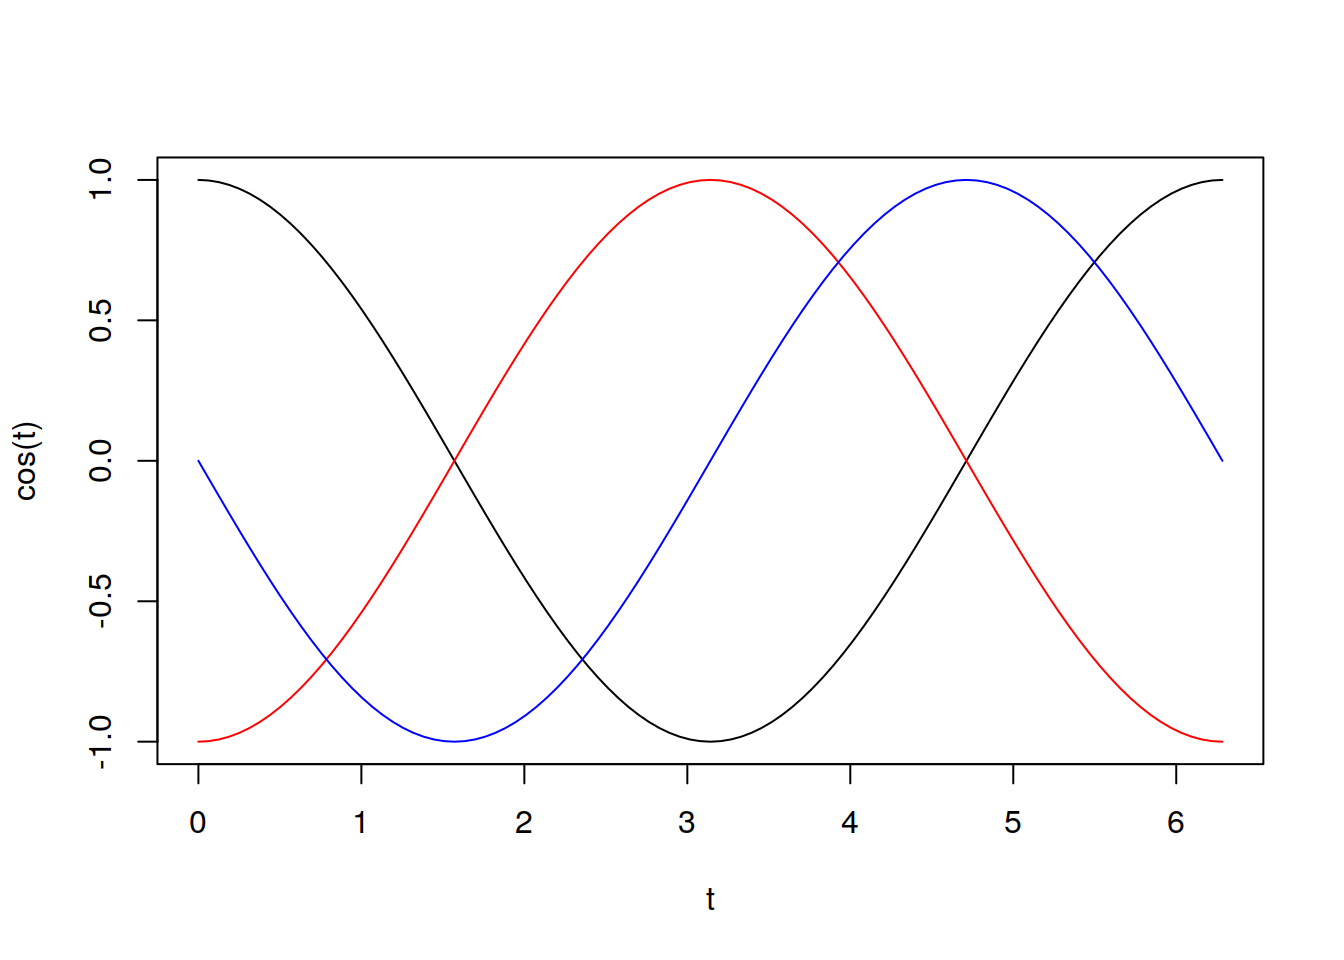
Now cosine
7.2 Frequency and Period
Let us say \(f(x)\) is a periodic function. If \(f(x)\) has period \(p\), then \(p\) is the smallest value S.T. \[f(x) = f(x + kp) \]
Cool
7.3 psueudo-periodicity
Data are psuedo-periodic with period \(p\) if \(p\) is the smallest value such that a cycle appears to repeat itself.
7.4 Aperiodicity
Aperiodic data is data in which no \(p\) exists.
7.5 Frequency
Frequency is calculated as : \(\frac{1}{p}\)
It symbolizes the number of cycles per unit(number of periods per unit)
7.6 Frequency Terminology
Frequency of a trigonometruc function:
Let \(f(x)=\sin\left( 2\pi f t \right)\)
Then we have that :
\[p = 1/f\] \[\nu = f\]
Consider: \[\sin(Bt + C)\] Then \[p = \frac{2 \pi}{B}\] \[\nu = \frac{B} {2 \pi}\]
7.7 Composite sine function
t <- seq(1, 100, length = 100)
y1 <- sin(2 * pi * 0.025 * t)
y2 <- sin(2 * pi * 0.1 * t + 1)
y3 <- sin(2 * pi * 0.15 * t + 2.5)
lineplotter <- function(x, y) {
    plot(x, y, type = "l")
}

lineplotter(t, y1)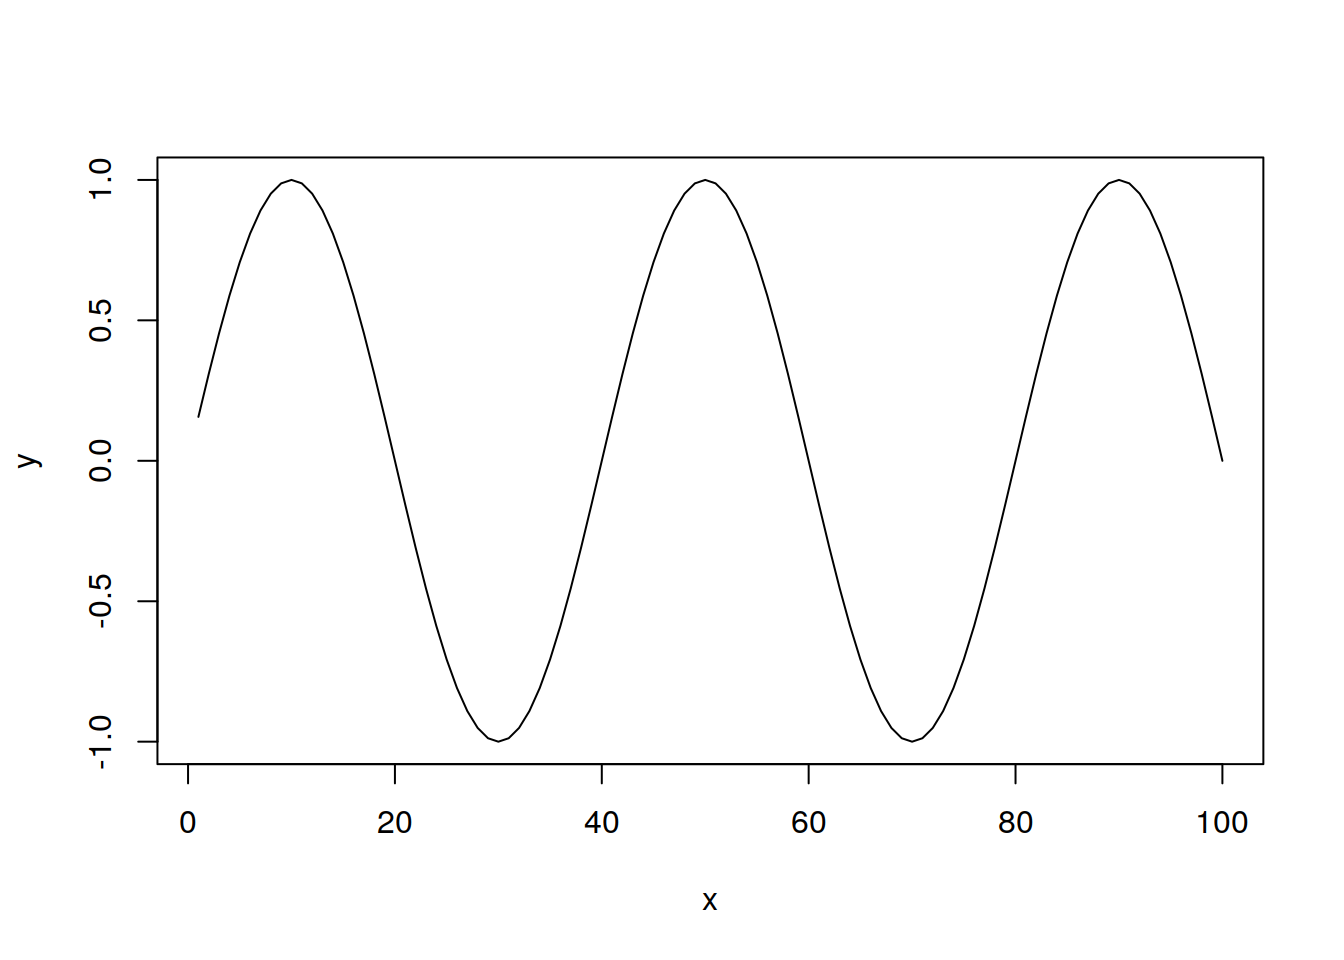
lineplotter(t, y2)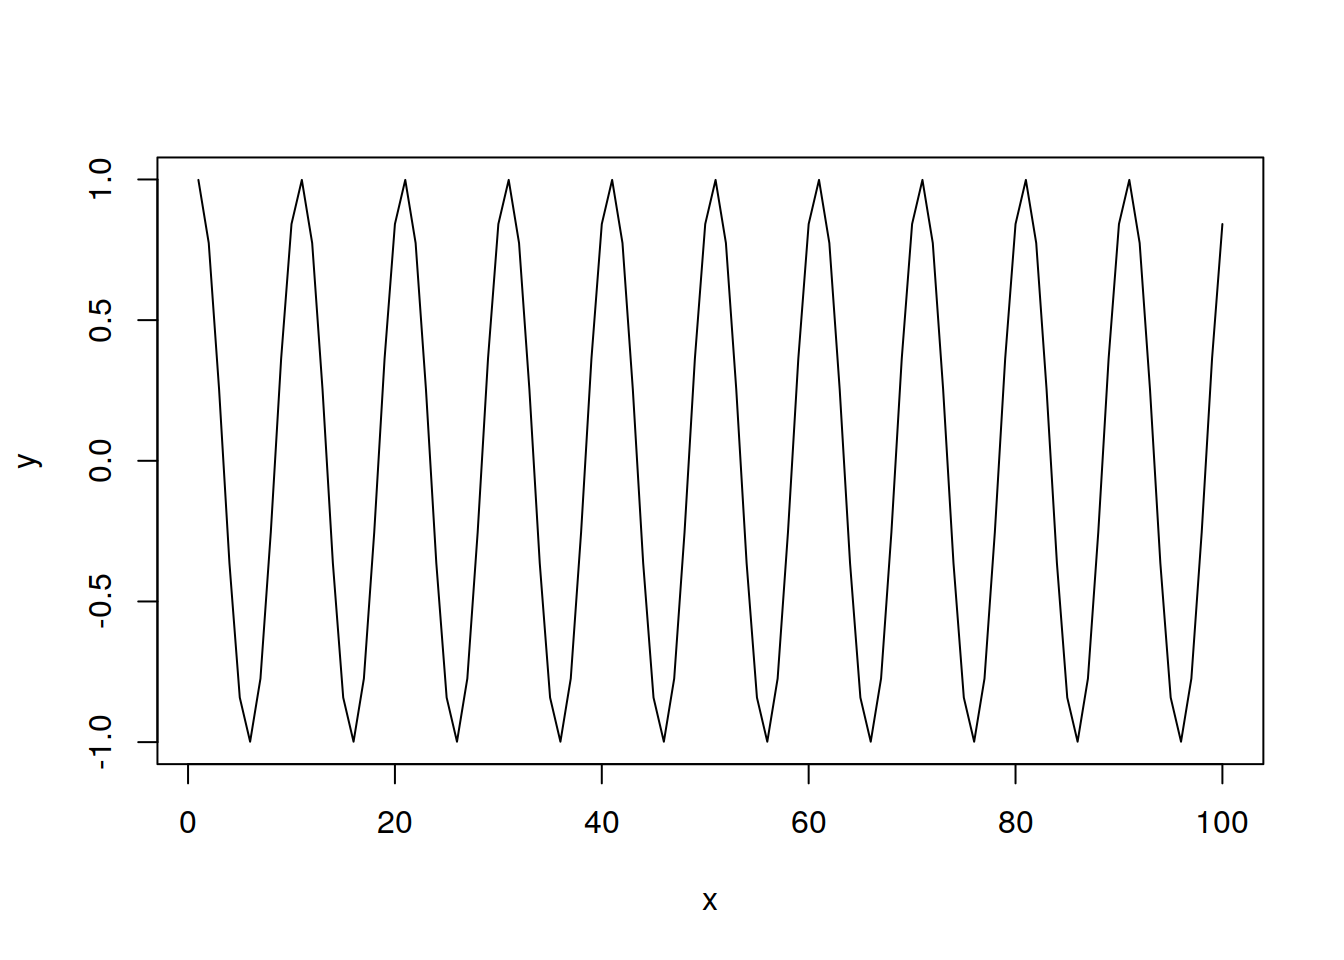
lineplotter(t, y3)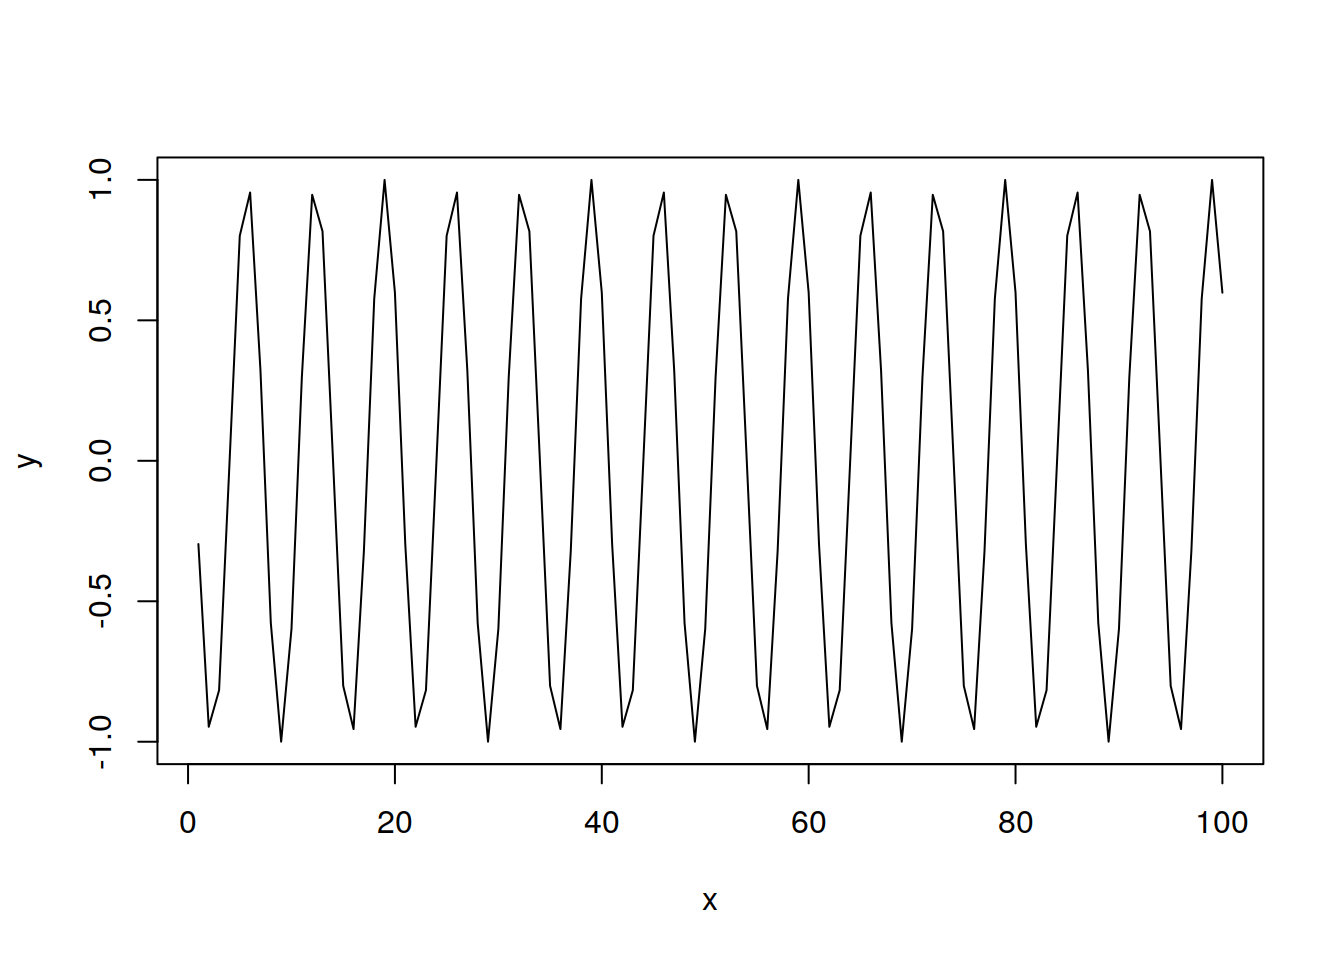
lineplotter(t, y1 + y2 + y3)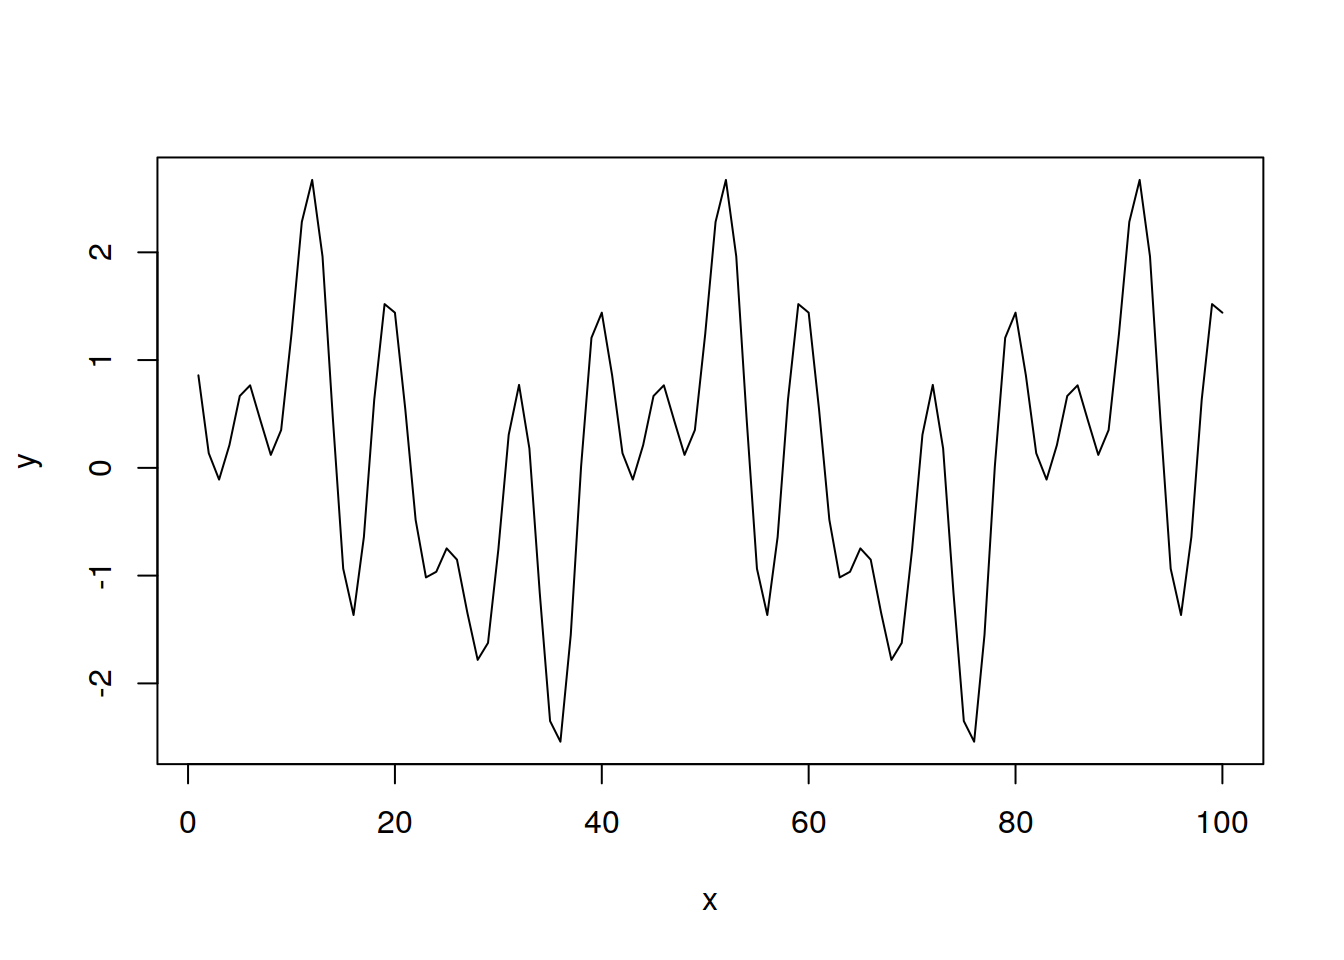
this is a signal with three frequencies!
7.8 Fundamental idea
A lot of realizations are made up of components of various frequencies, and some do not have frequency at all. Uncovering the frequency content of a dataset (or lack thereof) allows us to better understand the process generating the data.
7.8.1 A Brief Look at Fourier Series
When we do spectral analysis, we are generally going to be decomposing functions into sine and cosine terms, in order to better analyze the frequency of the data.
7.8.1.1 Fourier Series
You should just know this by this point, if you dont, google it. Too lazy to tex up the equations. Basically, we can decompose any function into a bunch of sines and cosines. It is pretty rad. The important conclusion of the existence of fourier series is that we can represent non cyclic functions as a bunch of sines and cosines, which will allow us to do spectral analysis of them.