Topic 12 Simple linear regression
12.1 Motivation
Recall, from last time, that our goal is to address research questions:
- Does college degree influences future income?
- Does frequent exercise influence life expectancy?
- Does eating healthy influences the probability of getting sick?
- Does attending labs influence my chances of doing well on the exams?
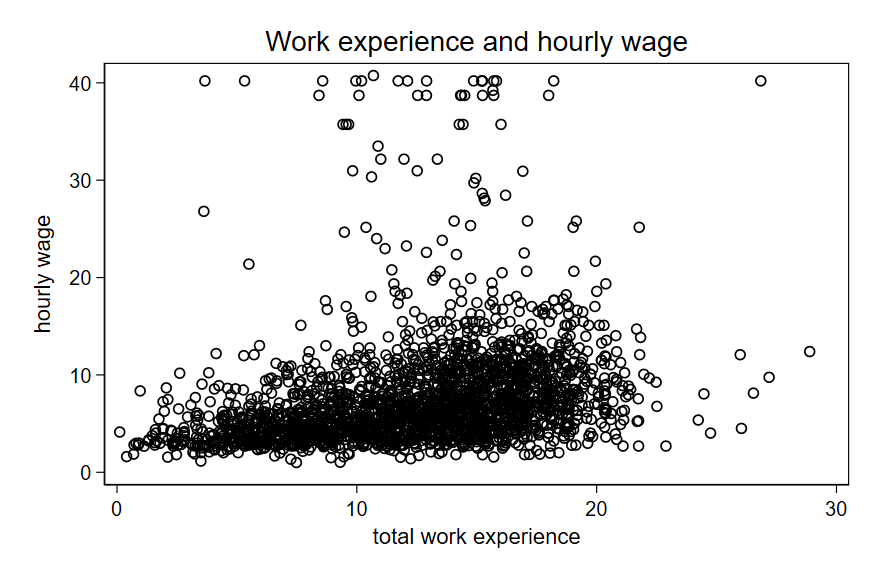
Even though it is not simple to make causal claims, a good first step is to explore simple correlations between variables, this is what we did last week.
A second step is to see how well our independent variable predicts our dependent variable. This is the purpose of simple linear regression
We had the following:
12.2 Intuition
Linear regression is a systematic way to draw a line that best fit the observations we have.
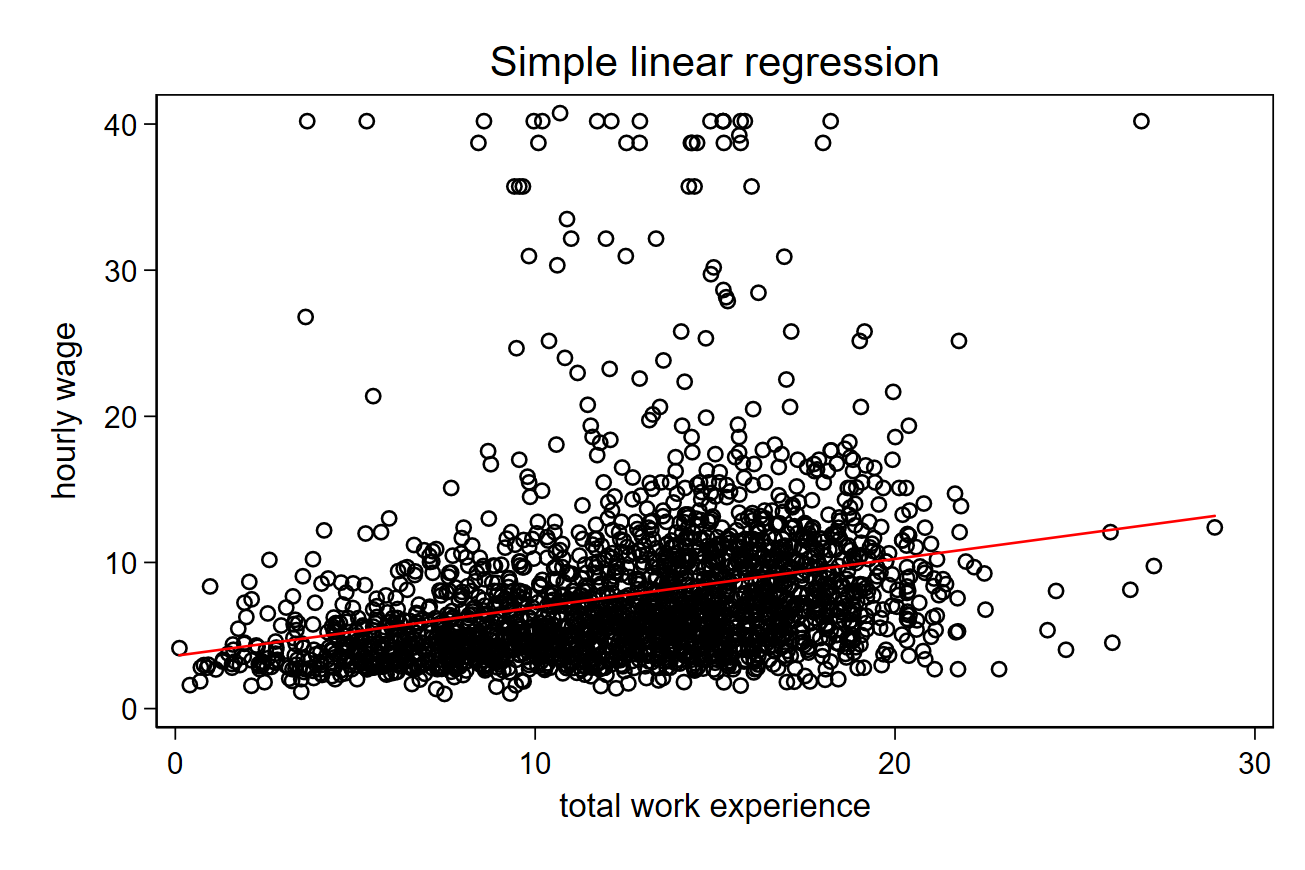
Have you ever learned about the equation of a line? (this is simple linear algebra):
\[ y = a \cdot x + b \]
See here for an example.
In summary:
- \(a\) is the slope of the line.
- \(b\) is the intercept.
When we perform a regression, we calculate the equation of a line. \(y\) is our dependent variable and \(x\) is our independent variable.
\[ y = \beta \cdot x + \epsilon \]
Important:
- Regression is good for prediction, because we can plug our independent variable (x) and see what value we predict for our dependent variable (y).
- Whatever is not well predicted by our regression coefficient (\(\beta\)) is captured by the residual (\(\epsilon\)).
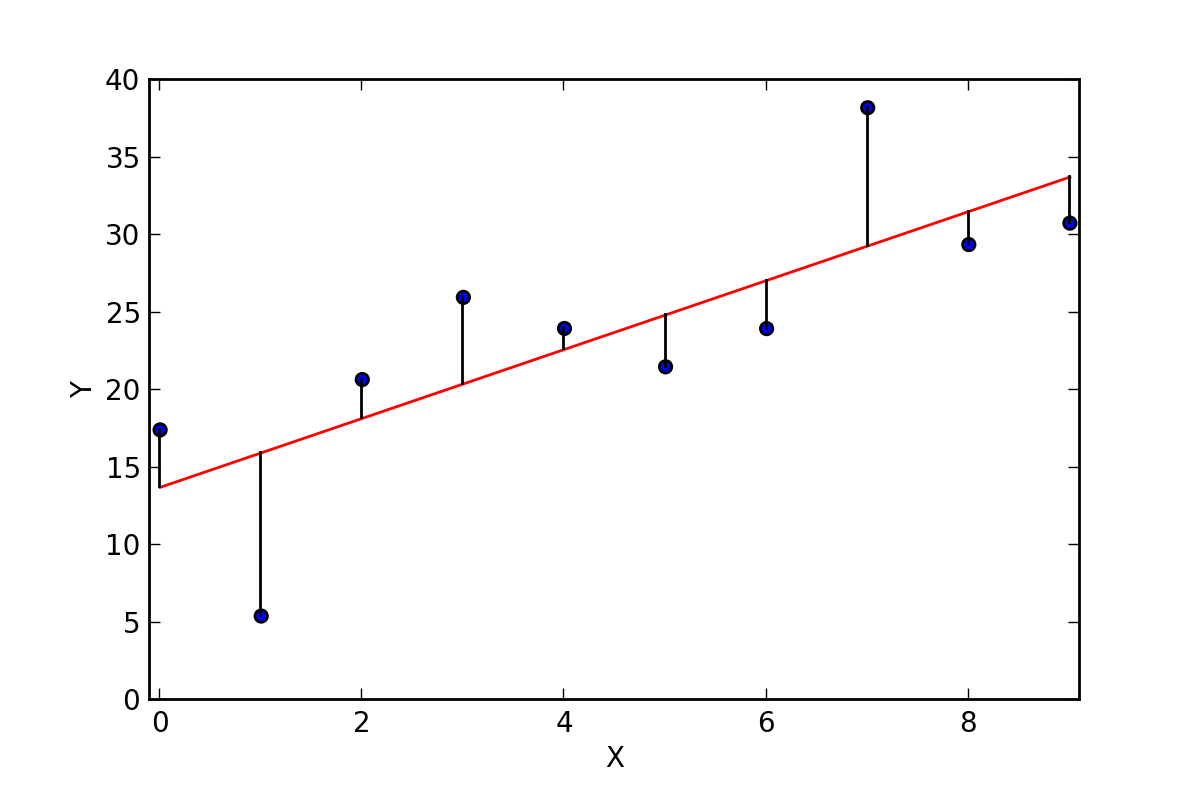
12.3 Minimizing sum of square residuals
If you are curious, this is how it works:
12.3.1 Formula and calculations
For your homework, this is what you should do:
\[\hat{\beta} = \frac{ \sum_{i=1}^n (x_i - \bar{x})(y_i - \bar{y}) }{ \sum_{i=1}^n (x_i - \bar{x})^2} \]
| \(x\) | \(y\) | \((x - \bar{x})\) | \((x - \bar{x})^2\) | \((y - \bar{y})\) | \((x - \bar{x})(y - \bar{y})\) |
|---|---|---|---|---|---|
| … | … | … | … | … | … |
| \(\bar{x}\) | \(\bar{y}\) | Sum = | Sum = |
Use the table above to calculate the b coefficient.
Then plug any two values (x,y) and calculate your intercept (a):
\[ y = b \cdot x + a \]
\[ y - b \cdot x = a \]
12.4 Interpretation
- The calculated coefficient tells how many units your dependent variable change if you change your independent variable by 1 unit.
- You should look at your p-value to see the statistical significance of your coefficient. This is calculated by a simple t test.
- Null hypothesis: regression coefficient = 0.
- Your R-squared tells you the percentage of variation in \(y\) that your \(x\) explains.
12.5 Problems with linear regression
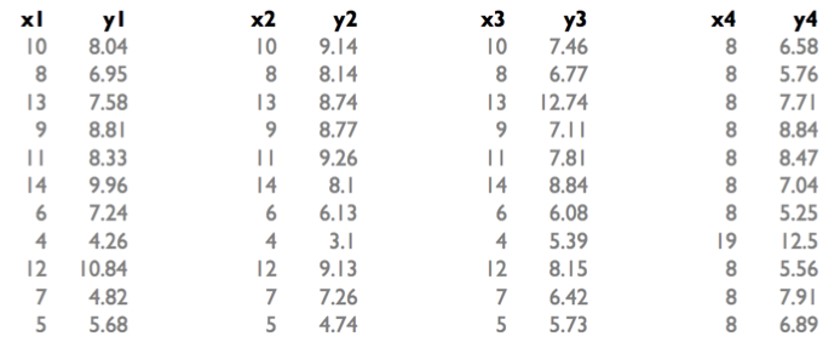
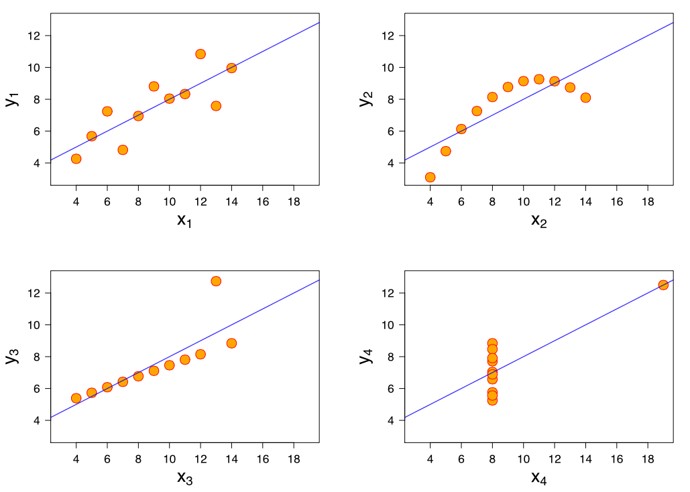
This is called the Anscombe’s quartet.
We also have the problem of confounding variables we discussed last time. But this is beyond this course (multiple linear regression).
12.6 Exercise
Using the school dataset, I will illustrate a regression of “api 2000”, a measure of academic achievement, on “avg class size 4-6”.
In other words, we have the following equation:
\[ api00 = \beta \cdot acs_46 + \epsilon \]
Also using the dataset “school_data.sav”, perform and interpret the following simple linear regressions:
- \(api00 = \beta \cdot grad_sch + \epsilon\)
- \(api00 = \beta \cdot enroll + \epsilon\)