Review 1
Measures of central tendency and measures of dispersion
Mean, median, mode
Median: The median is the middle value of the ordered sample values. It is the number which is half-way into the list of reported values
Mode: The mode is the value with highest frequency in the sample.
Mean:
\[\overline{x} = \frac{1}{n}\sum x_i\]
Easier way to calculate the mean
Sample: 0, 0, 1, 3, 3, 4, 4, 4, 5, 8.
| x | f | fx |
|---|---|---|
| 0 | 2 | 0 |
| 1 | 1 | 1 |
| 3 | 2 | 6 |
| 4 | 3 | 12 |
| 5 | 1 | 5 |
| 8 | 1 | 8 |
| \(\sum x = 21\) | \(\sum f=10\) | \(\sum fx=32\) |
\[\overline{x} = \frac{\sum fx}{\sum f} = \frac{32}{10} = 3.2\]
Skweness
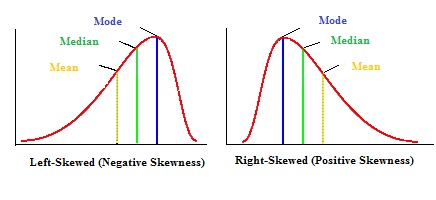
It is important to understand how the skewness of a distribution influences the relationship between the mean, median and mode. The figure below is from here.
Standard deviation
\[sd = \sqrt{\frac{f(x - \overline{x})^2}{n-1} }\]
| \(x\) | f | fx | \(x - \overline{x}\) | \((x - \overline{x})^2\) | \(f(x - \overline{x})^2\) |
|---|---|---|---|---|---|
| … | … | … | … | … | … |
| . | \(\sum f\) | \(\sum fx\) | \(\sum above = A\) |
Calculate the standard deviation: \[sd = \sqrt{\frac{A}{n-1} }\]
Variance
\[variance = sd^2\]
Z-scores
\[z=\frac{x_i-\overline{x}}{sd}\]
where \(s\) is the sample standard deviation
Recall that, for the z-distribution:
- Mean = 0
- SD = 1
Confidence intervals
Standard error: \[se = \frac{sd}{\sqrt{n}}\]
CIs: \[\text{Lower bound} = \bar x - z_{(\frac{\alpha}{2})}se\]
\[\text{Upper bound} = \bar x + z_{(\frac{\alpha}{2})}se\]
- For 95% CI: \(z_{(\frac{\alpha}{2})}= z_{0.025} \approx 2\)
- For 99% CI: \(z_{(\frac{\alpha}{2})}= z_{0.005} \approx 3\)
Hypothesis testing: one-sample t-test
\[t = \frac {\bar x-\mu_0}{se}\]
- We reject the null hypothesis only when the calculated \(t\) is higher than the critical value (\(c_\alpha\)).
- We reject the null hypothesis only when \(p \leq \alpha\)
- We reject the null hypothesis if the mean difference CI does not include 0.
Practice questions
- Suppose \(\overline{x} = 10\) for a negatively skewed distribution. What could be the median and mode of this distribution?
- median = 11 and mode = 12
- median = 12 and mode = 11
- Suppose you created a z-score distribution from a given sample. What is the mean of this distribution?
- 1
- 0
- There is not enough information to calculate the mean.
- The p-value equals:
- \(\alpha\)
- The significance level
- 0.05
- What is the percentile of a z-score \(z= 1.18\)
- 45%
- 17%
- 88%
- Using the z-table, find the values of z:
- That is just above 97.5% of all values in the distribution.
- That is just above 99.5% of all values in the distribution.
- Using the t-table, find the value of t for:
- Two-tail, \(\alpha=0.05\) (n=31)
- One-tail, \(\alpha=0.05\) (n=31)
- Two-tail, \(\alpha=0.01\) (n=31)
- One-tail, \(\alpha=0.01\) (n=31)
- Compared to a 95% confidence interval, a 99% confidence interval:
- Is more precise
- Is more accurate
- If \(p = 0.03\)
- We reject the null when \(\alpha = 0.05\)
- We reject the null when \(\alpha = 0.01\)
- We never reject the null
- As the absolute value of \(t_{calculated}\) increases, we are:
- More likely to reject the null
- Less likely to reject the null
- Given a 95% mean difference CI = (-0.12;1.2), do we reject the null that the population mean = 15 (assuming \(\alpha = 0.05)\)?
- Yes
- No
- As sample size increases a 95% CI becomes:
- Narrower, more precise
- Less accurate