Topic 11 Correlation
So far we have explored different methods of hypothesis testing (we look at different t-tests and different Anova tests).
The goal was to use our sample to know something about the population.
However, so far, we were only interested in sample means. We tried to understand if sample means for different groups could be generalized to population means for these sample groups.
Now, we will try to get more interesting statistics from our sample and then apply tests to see if they hold at the population level.
In this lab, we will explore a statistic that looks at the relationship between variables.
11.1 Motivation
Now we get into more interesting applications of statistics. We want to address research questions, such as:
- Does college degree influences future income?
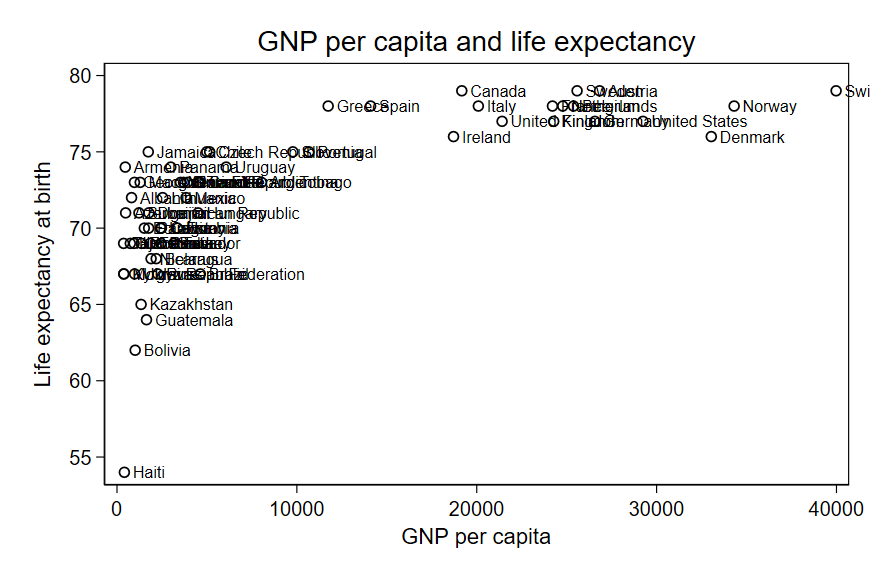
- Does frequent exercise influence life expectancy?
- Does eating healthy influences the probability of getting sick?
- Does attending labs influence my chances of doing well on the exams?
These are all causal questions. Most research questions are causal questions. We want to explore if one variable (an idependent variable) influences another variable (a dependent variable).
One first step towards answering these questions is to explore simple correlations between variables. This is what we will do.
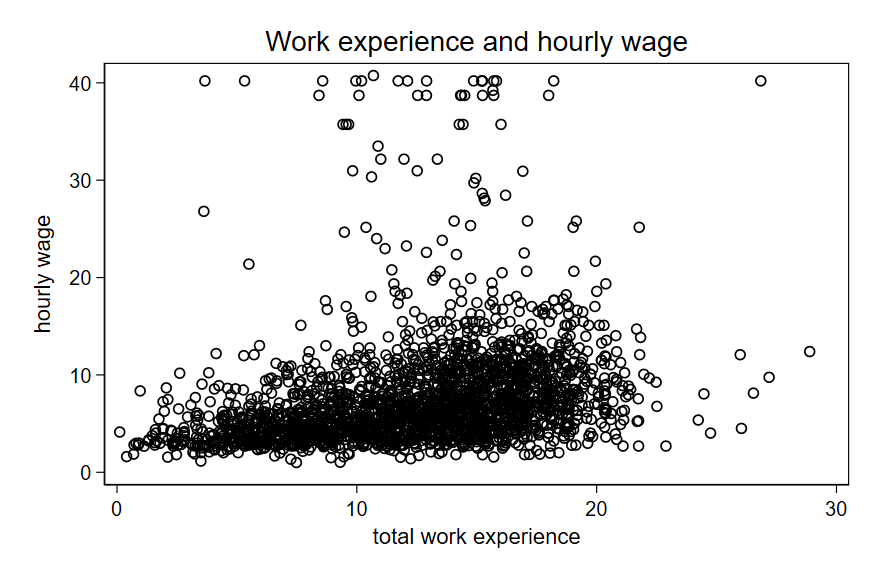
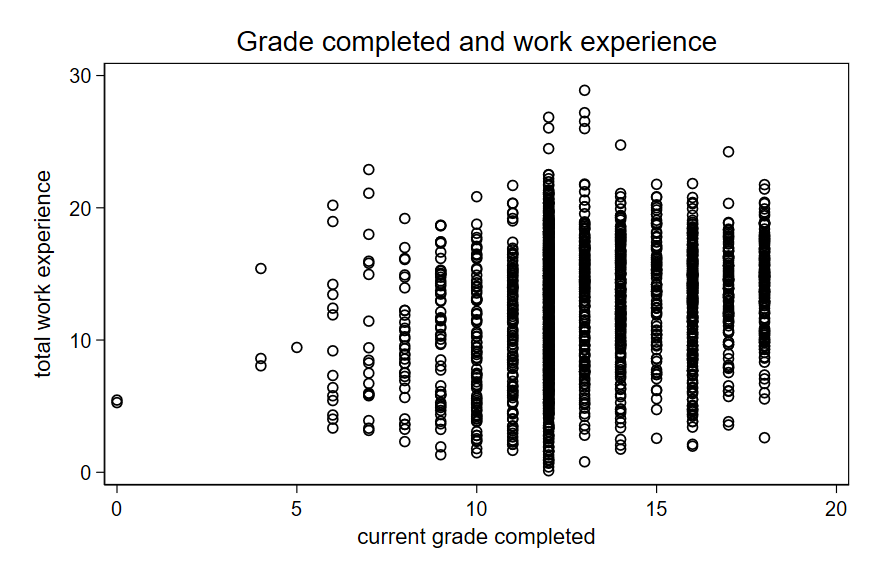
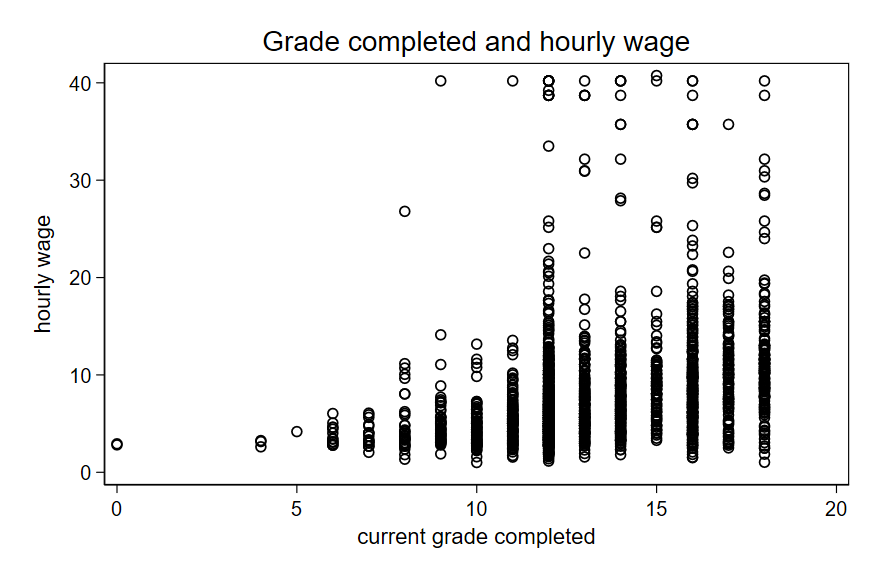
11.2 Scatter plots
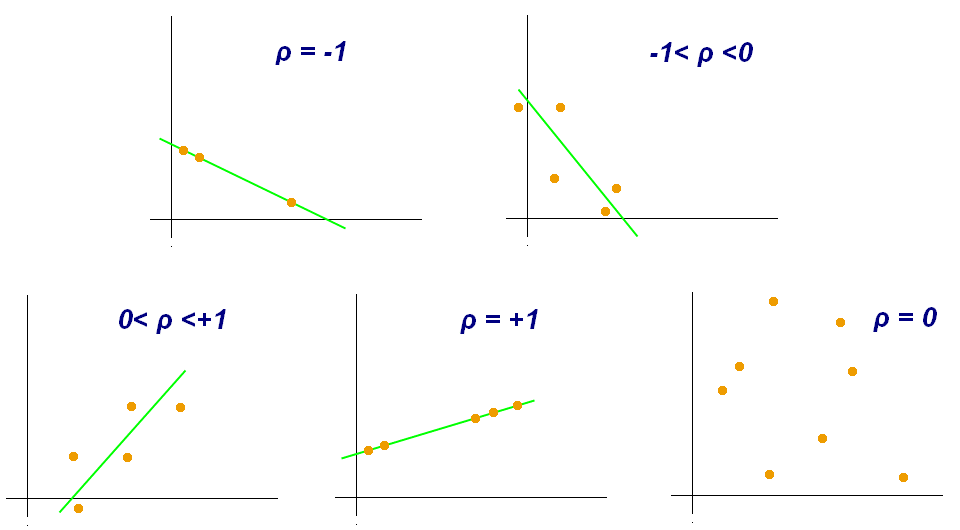
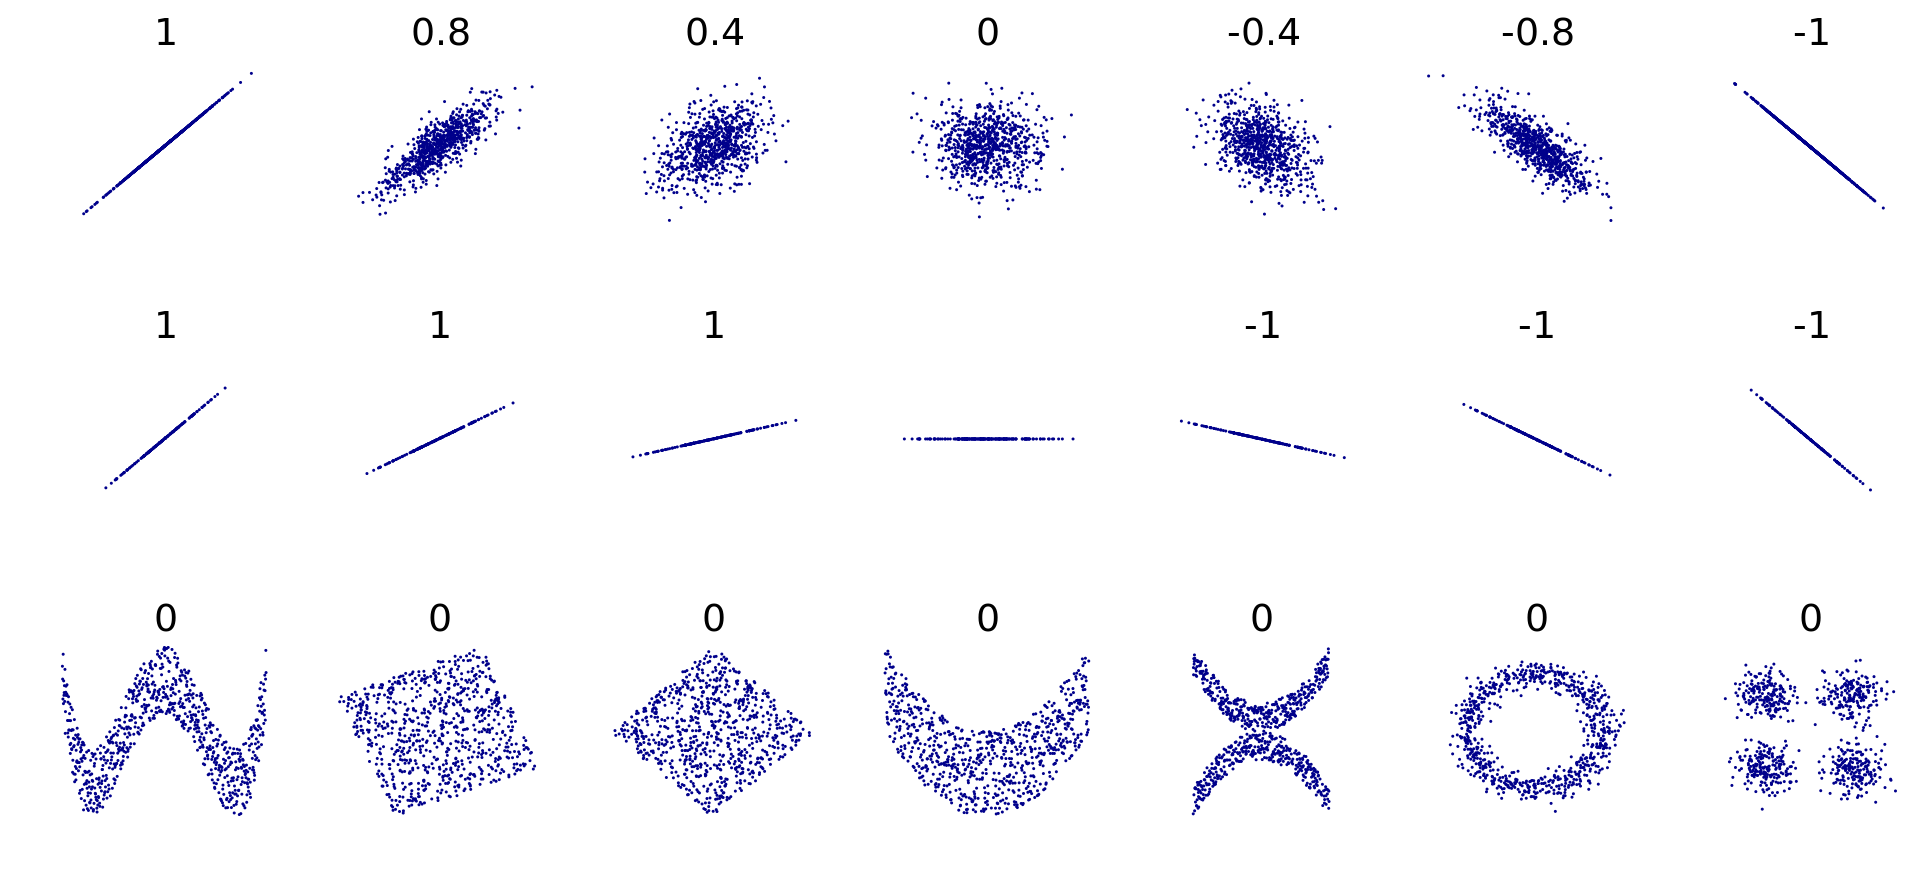
11.3 Pearson’s correlation coefficient
We need a concrete way to measure correlation.
- You should look at your p-value to see the statistical significance of your coefficient. This is calculated by a simple t test.
- Null hypothesis: coefficient = 0.
11.3.1 Formula
\[r_{xy} =\frac{\sum x_iy_i-\frac{\sum x_i\sum y_i}{n}} {\sqrt{\sum x_i^2-\frac{(\sum x_i)^2}{n}}~\sqrt{\sum y_i^2-\frac{(\sum y_i)^2}{n}}}\]
To make things simpler, use the table below:
| \(x\) | \(y\) | \(x^2\) | \(y^2\) | \(x \cdot y\) |
|---|---|---|---|---|
| … | … | … | … | … |
| Sum = | Sum = | Sum = | Sum = | Sum = |
11.4 Correlation vs Causation
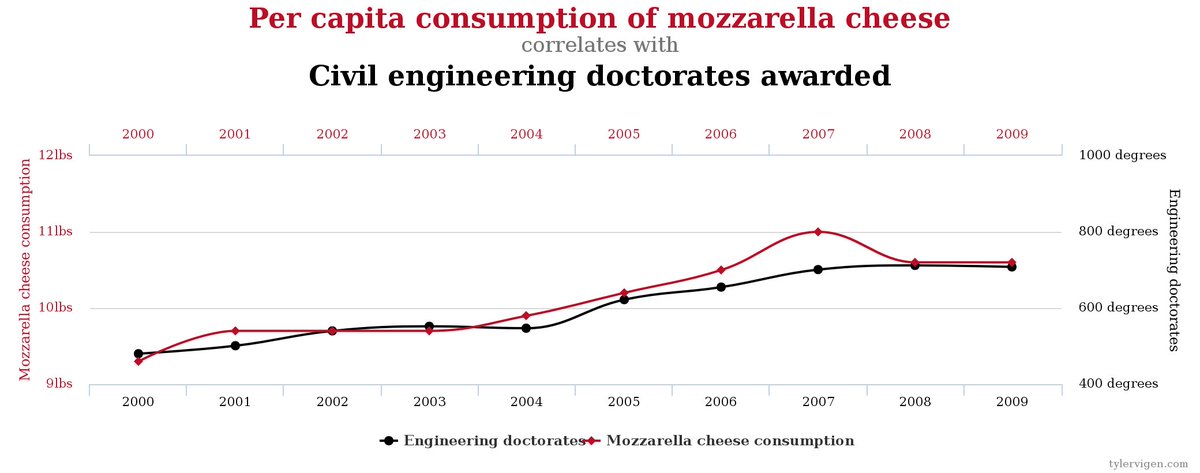
11.5 Confounding variables
What are some of the problems of using simple correlations to claim causal relationships?
Two of the main problems are:
- Simple correlations fail to address confounding variables.
- Lack of causal mechanism. Is there a reason to believe one variable influences the other? (Lack of theory).
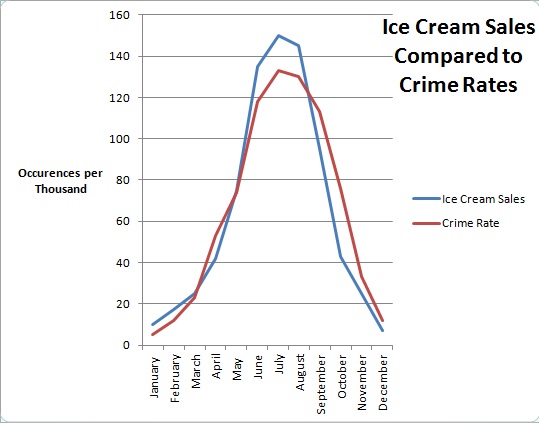
A confounding variable is a factor that influences both your dependent and independent variables.
Examples of confounding variables:
- Eating healthy is a confounding variable for the influence of alcohol on mortality rate.
- Warm weather is a confounding variable for the influence of ice cream eating on murder rate.
- Education attainment is a confounding variable for the influence of work experience on wages.
There are different techniques that we can use to “control” for confounding variables. This is a topic for future classes.
11.6 Exercise
I will demonstrate using the earnings dataset. In the effect of experience on wages, is age a confounding variable?
Also, using the dataset “health_data.dta”, suppose you are interested in exploring the influence of “body mass index” on “Systolic blood pressure”. Is “age” a confounding variable in this analysis?
You should make the necessary plots and calculate the necessary correlation coefficients.