Topic 4 Confidence intervals for the population mean
4.1 Notation
Population mean: \(\mu\)
Sample mean: \(\overline{x}\)
Sample standard deviation: \(sd\)
Sample variance: \(sd^{2}\)
Sample standard error of the mean: \(se\)
4.2 Formulas
Sample mean: \[\overline{x} = \frac{1}{n}\sum x_i\]
Sample standard deviation:
\[sd = \sqrt{\frac{f(x - \overline{x})^2}{n-1} }\]
Recall that we can calculate these values using the table we discussed in the beggining of the semester.
Sample standard error of the mean (new):
\[se = \frac{sd}{\sqrt{n}}\]
Confidence interval for the population mean:
\[\textbf{Lower bound} = \bar x - z_{(\frac{\alpha}{2})}se\]
\[\textbf{Upper bound} = \bar x + z_{(\frac{\alpha}{2})}se\] where \(\alpha\) is your significance level divided by 100. If you have a significance level = 5%, then \(\alpha = 0.05\).
As in lectures:
- For 95% CI: \(z_{(\frac{\alpha}{2})}= z_{0.025} \approx 2\)
- For 99% CI: \(z_{(\frac{\alpha}{2})}= z_{0.005} \approx 3\)
4.3 Interpretation
Key question: What is a process that estimates an interval for the population mean which is right (has the true \(\mu\)) for 95% (or 99%) of the samples?
This is what we want confidence intervals to do. We refer to this chance of being right as confidence level.
From your textbook: “Formally, what we mean is that ‘95% of samples of this size will produce confidence intervals that capture the true proportion.’ This is correct, but a little long winded, so we sometimes say, ’we are 95% confident that the true proportion lies in our interval.”
4.3.1 Precision vs accuracy
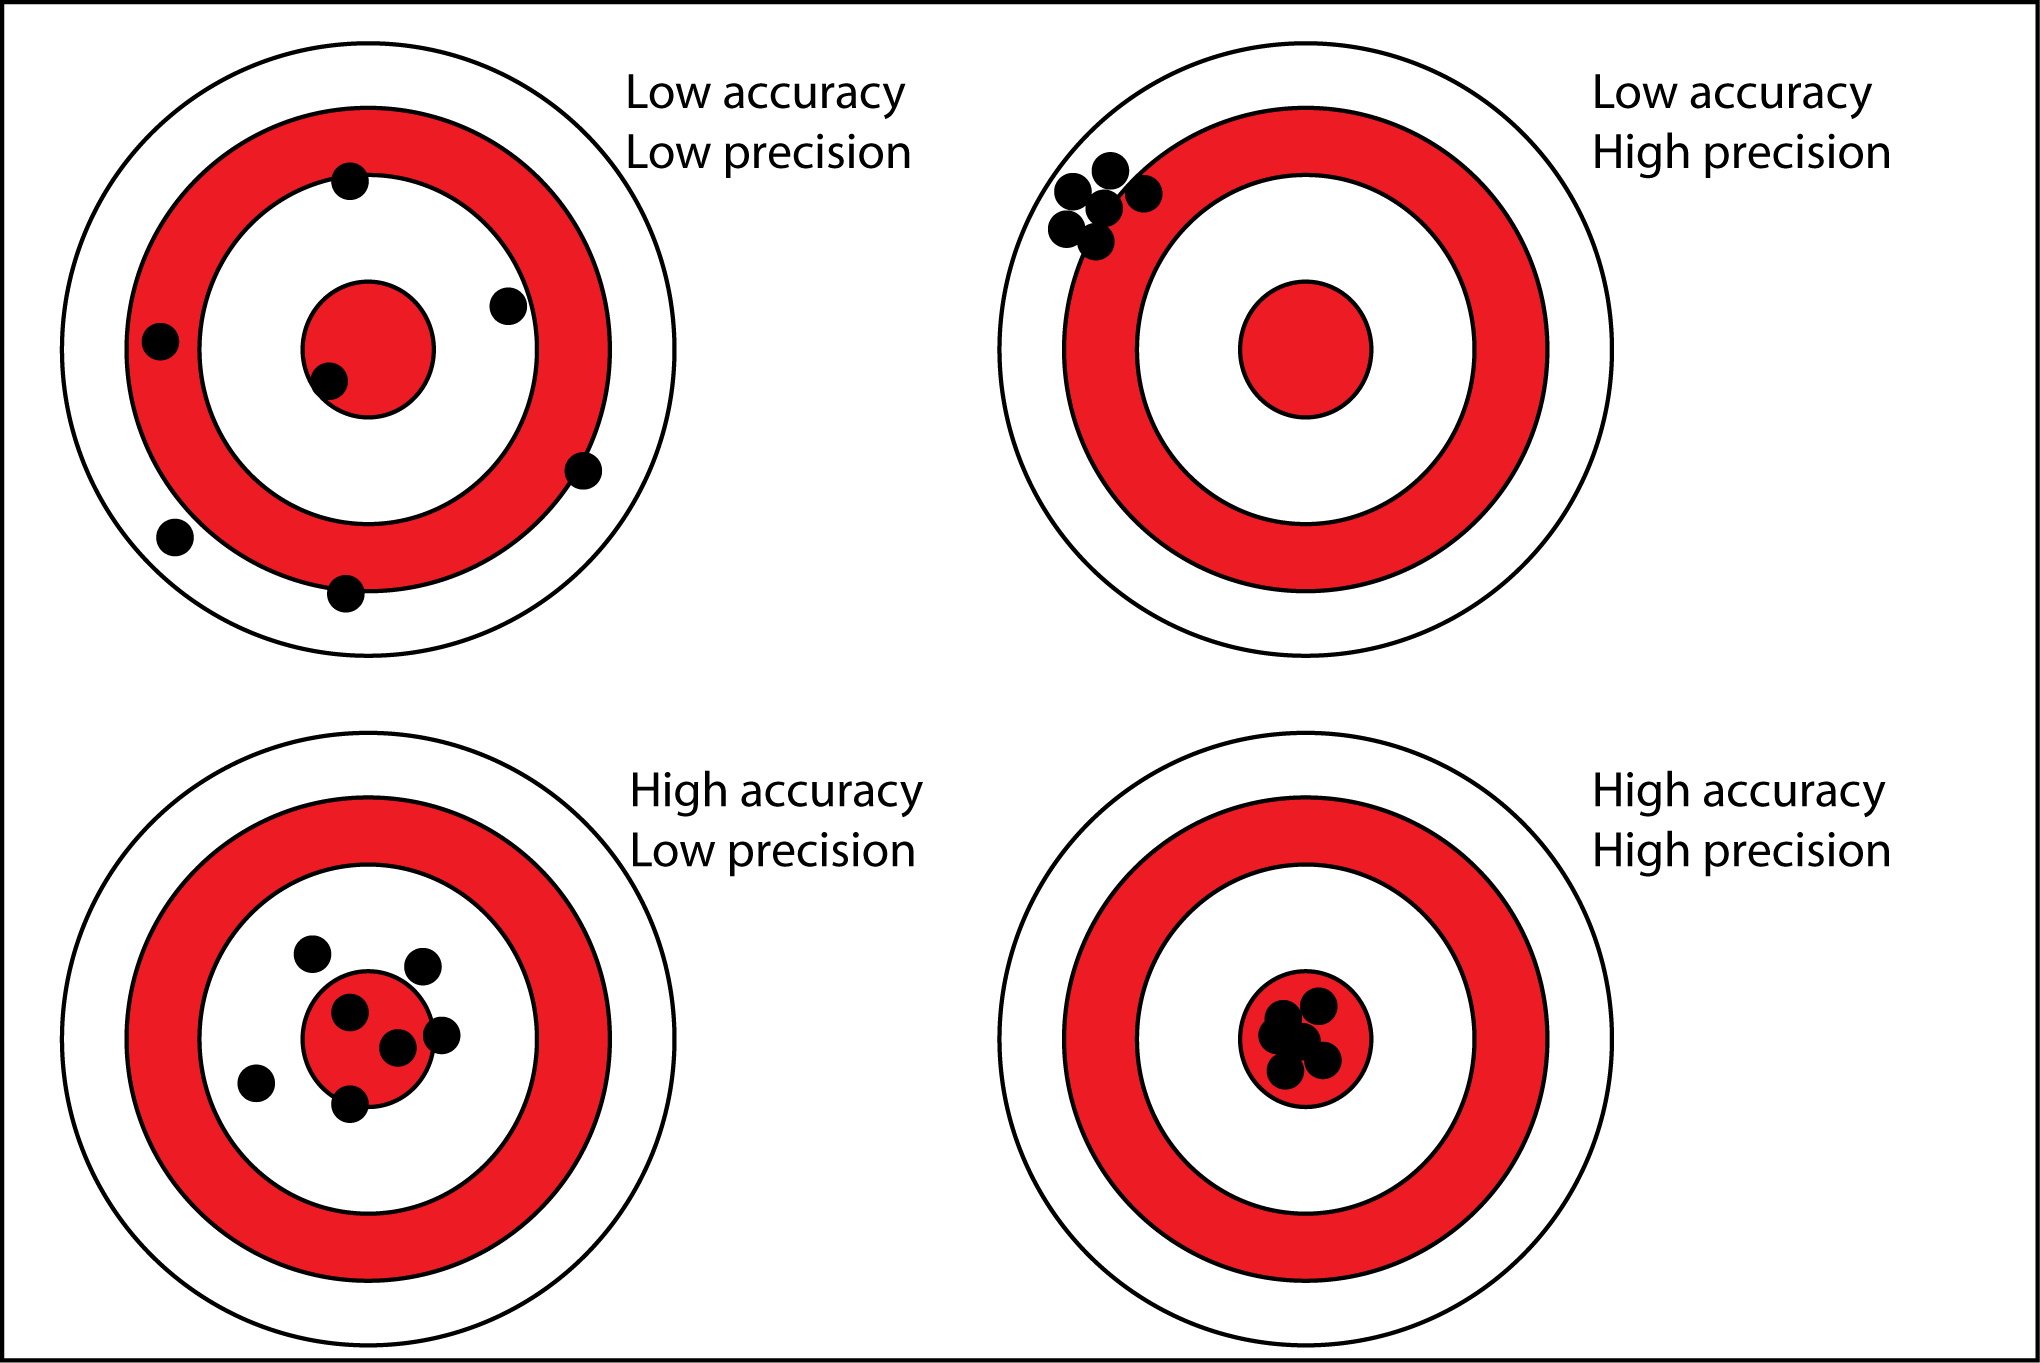
Suppose you are playing darts. Your goal is to get as close to the center as possible.
If you always play at the same spot, you are precise.
If you play at the center, you are accurate.
Applying this terminology to CIs:
- As confidence intervals became narrower, they become more precise. They give you less variability.
- As confidence intervals become wider, they become more accurate. They have a higher chance of containing the true population mean.
Relating this to confidence level and sample size:
- As sample size increases (but the confidence level remains same), the confidence interval becomes more precise. The accuracy is the same, but they have less variability.
- As confidence level increases (and sample size remains the same), the confidence interval becomes wider. Thus, it has a higher accuracy (chance of being right), but less precision.
Therefore, precision has to do with variability. Accuracy has to do with the chance of being right.
It is important to use the right vocabulary when writing your answers!
4.4 Exercises
Use the “health_data.sav” and consider \(x = height\). Using SPSS, perform the following commands:
- Calculate measures of central tendency and measures of dispersion for the \(x\) variable.
- Check the histogram for the \(x\) variable. Be sure to include a normal curve above it.
- Calculate the 95% and 99% CIs for \(x\).
- Write your interpretation of the different CIs.
- How do you expect your CIs to change as sample size increases?