Topic 2 Measures of central tendency and dispersion
2.1 Central tendency
- Mean
- Median
- Mode
Example
We asked 10 people to report the number of books they each read last month.
They reported the following:
5, 3, 4, 3, 0, 1, 4, 4, 8, 0.
Some notation
Before we calculate the mode we need to know the following notation (this will also be useful for calculating the mean, variance, standard deviation…)
- \(x\): refers to each value taken by a given variable in the sample. In this example, the variable “number of books” takes the values: 0, 1, 3, 4, 5 and 8.
- \(f\): refers to the frequency of each of the \(x\) values (the number of times individuals reported this value)
Easy way to calculte: write the following table:
Values in order: 0, 0, 1, 3, 3, 4, 4, 4, 5, 8.
| x | f | fx |
|---|---|---|
| 0 | 2 | 0 |
| 1 | 1 | 1 |
| 3 | 2 | 6 |
| 4 | 3 | 12 |
| 5 | 1 | 5 |
| 8 | 1 | 8 |
| \(\sum x = 21\) | \(\sum f=10\) | \(\sum fx=32\) |
2.1.1 Mean
The mean is the unweighted average of the values in the sample.
\[\overline{x} = \frac{1}{n}\sum x_i\] Note tha \(x_i\) refers to each observation reported in the sample (it is not the same as \(x\)).
This can take a long time to calculate by hand.
Easier way to calculate the mean (see Prof. Hassad’s notes):
\[\overline{x} = \frac{\sum fx}{\sum f} = \frac{32}{10} = 3.2\]
2.1.2 Median
Step 1: list all values in ascending order.
0, 0, 1, 3, 3, 4, 4, 4, 5, 8.
Step 2: Do I have an odd or even total number of reported values?
Even total: There are two middle values. The median is the average between those two values.
In the number of books example, the median is: \[ Median = \frac{3+4}{2} = 3.5\]
Odd total: There is only one middle value. The median is this middle value.
2.1.3 Mode
The mode is the value with highest frequency (highest f).
How about the following:
| x | f |
|---|---|
| 0 | 2 |
| 1 | 3 |
| 3 | 3 |
| 4 | 3 |
| 5 | 1 |
| 8 | 1 |
All of those are the mode.
Intuition: How many winners are there if runners tie in first place in a given competition?
How about the following?
| x | f |
|---|---|
| 0 | 1 |
| 1 | 1 |
| 3 | 1 |
| 4 | 1 |
| 5 | 1 |
| 8 | 1 |
Here there is no mode.
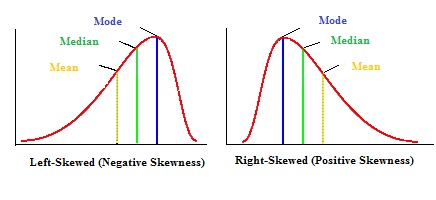
Normal distribution:
Mean = Median = Mode
Mode, Mean, and Meadian are useful to discribe the shape of a distribution.
But they are not enough! We need new tools.
2.2 Measures of dispersion
- Variance
- Standard deviation
- Range
- Skewness
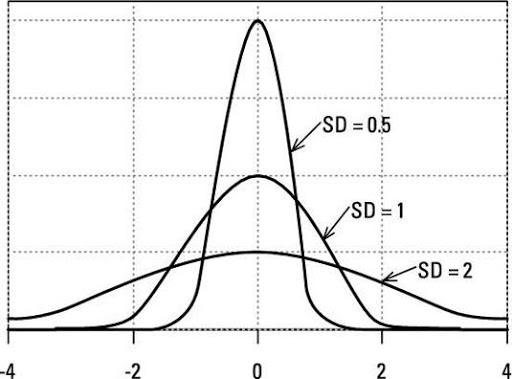
2.2.1 Standard deviation
Use the same table and expand it:
Note that \(\overline{x}\) is the mean you just calculated.
| \(x\) | f | fx | \(x - \overline{x}\) | \((x - \overline{x})^2\) | \(f(x - \overline{x})^2\) |
|---|---|---|---|---|---|
| … | … | … | … | … | … |
| . | \(\sum f\) | \(\sum fx\) | \(\sum above = A\) |
Calculate the standard deviation:
Or, more formally:
\[sd = \sqrt{\frac{f(x - \overline{x})^2}{n-1} }\]
\[sd = \sqrt{\frac{A}{n-1} }\]
Note that the standard deviation of a standard normal distribution is 1.
2.2.2 Variance:
\[variance = sd^2\]
Note that the variance of a standard normal distribution is 1.
2.2.3 Range
Range = Max-Min
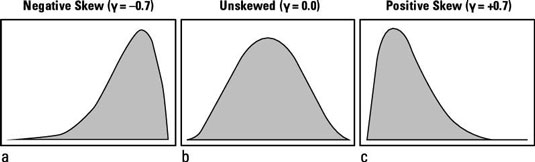
2.2.4 Skewness
- If skewness is more than 1 or less than -1, then we have a highly skewed distribution.
- If skewness is between -1 and -1/2 or between 1 and 1/2, then we have a moderatly skewed distribution.
- If skewness is between -1/2 and 1/2, then we have an approximatly symmetric distribution (or a negligible degree of skewness).
2.2.5 Example of calculations
The following are data for the variable: number of movies watched in the past month.
1; 5; 5; 4; 5; 4; 0; 15; 1; 0; 0; 1.
Calculate: mean, media, mode, variance, standard deviation and range.
| \(x\) | f | fx | \(x - \overline{x}\) | \((x - \overline{x})^2\) | \(f(x - \overline{x})^2\) |
|---|---|---|---|---|---|
| 0 | 3 | 0 | -3.4 | 11.56 | 34.68 |
| 1 | 3 | 3 | -2.4 | 5.76 | 17.28 |
| 4 | 2 | 8 | 0.6 | 0.36 | 0.72 |
| 5 | 3 | 15 | 1.6 | 2.56 | 7.68 |
| 15 | 1 | 15 | 11.6 | 134.56 | 134.56 |
| . | \(\sum f = 12\) | \(\sum fx = 41\) | \(\sum above = 194.92\) |
\[\overline{x} = \frac{\sum fx}{\sum f} = \frac{41}{12} = 3.4\]
Mode = 0 , 1 , 5
Median = (4 + 1) / 2 = 2.5
\[sd = \sqrt{\frac{194.92}{11} } = \sqrt{17.72} = 4.2\] \[sd^2 = 17.72\]
\[Range = 15 - 0 = -15\]