14 Shiny
Point and click any point:
knitr::include_app("https://jkylearmstrong.shinyapps.io/Shiny/", height = "600px")After the yaml which looks like this:
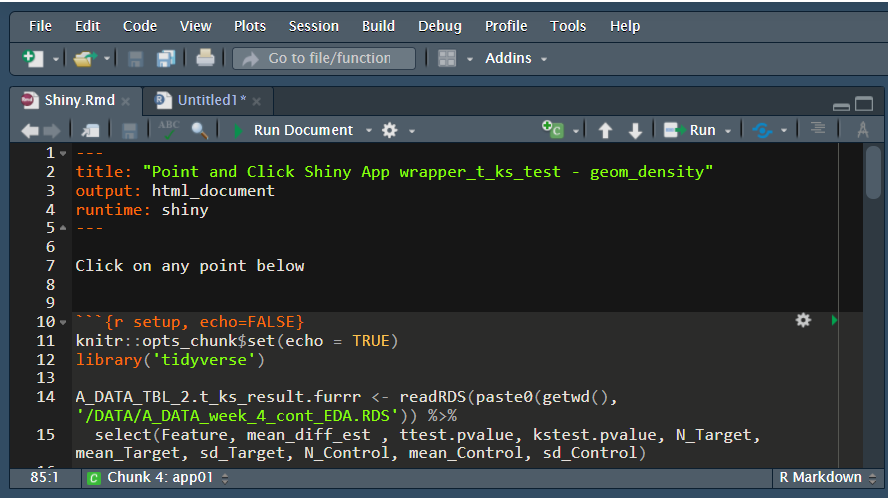
There are four main components this app: setup , ui, server, & runapp
14.1 setup code chuck
knitr::opts_chunk$set(echo = TRUE)
library('tidyverse')

A_DATA_TBL_2.t_ks_result.furrr <- readRDS(paste0(getwd(), '/DATA/A_DATA_week_4_cont_EDA.RDS')) %>%
  select(Feature, mean_diff_est , ttest.pvalue, kstest.pvalue, N_Target, mean_Target, sd_Target, N_Control, mean_Control, sd_Control)

A_DATA_2 <- readRDS(paste0(getwd(),'/DATA/A_DATA.RDS'))
features <- colnames(A_DATA_2)[!colnames(A_DATA_2) %in% c('SEQN', 'DIABETES','AGE_AT_DIAG_DM2')]

numeric_cols <- A_DATA_2 %>%
  select_if(is.numeric) %>%
  colnames()

numeric_features <- intersect(features, numeric_cols)

source(paste0(getwd(),"/FUNCTIONS/wrapper_t_ks_test.R"))
We then have a pair a ui chunk and server chunk:
14.2 ui code chunk:
ui <- fluidPage(

  sidebarLayout(

    #  input
    sidebarPanel(
      plotOutput("plot1", click = "plot_click")
    ),

    # Show a plot of the generated distribution
    mainPanel(
      tableOutput("info"),
      plotOutput("plot2")
    )
  )

)
14.3 sever code chunk:
server <- function(input, output) {
  output$plot1 <- renderPlot({
    A_DATA_TBL_2.t_ks_result.furrr %>%
      ggplot(aes(x=round(ttest.pvalue,4) , y= round(kstest.pvalue,4), color = Feature)) +
      geom_point() +
      theme(legend.position='none')
  })

  output$info <- renderTable({
    nearPoints(A_DATA_TBL_2.t_ks_result.furrr,
               input$plot_click,
               xvar = "ttest.pvalue",
               yvar = "kstest.pvalue") %>%
      as.data.frame()
  })

  output$plot2 <- renderPlot({
    my_feature <- (nearPoints(A_DATA_TBL_2.t_ks_result.furrr,
                              input$plot_click,
                              xvar = "ttest.pvalue",
                              yvar = "kstest.pvalue"))$Feature

    A_DATA_2 %>%
      filter(!is.na(DIABETES))%>%
      mutate(DIABETES_factor = as.factor(DIABETES)) %>%
      ggplot(aes_string(x = my_feature , fill='DIABETES_factor')) +
      geom_density()
  })
}
14.4 runapp code chunk
shinyApp(ui, server)