Hypothesis testing
Data Analytics Module
Lecturer: Hans van der Zwan
Handout 05
Topic: t tests and chi square tests
Literature
Rumsey D. J. (2010). Statistical Essentials for Dummies. Hoboken: Wiley Publishing.
Ismay C. & Kim A. Y. (2019). ModernDive. Statistical Inference for Data Science. https://moderndive.com.
Recommended literature
Preparation class
See module description
8 APA style
There are different conventions for writing a scientific article. Among them, APA (American Psychological Association) and Harvard style are the most famous, but by no means the only.
At The Hague Graduate School we use APA style. APA style prescribes how to refer to articles that have been used as a source. But that is certainly not the only thing. APA also has rules for layout, for reporting data in tables and graphs and reporting results of significance tests.
8.1 Lay-out issues
Use the APA guidlines as published by the APA for the end assignment report for the Data Analytics course.
In the thesis manual instructions are published about the guidelines for the thesis, these are also based on the APA style.
In the next paragraphs some topics about APA style reporting are discussed in short; the list with discussed matters is not exhaustive.
8.1.1 Font
APA style permits a variety of fonts, see here. It is important to be consistent, use the same font throughout the whole text paper. If a different font is used for text within figures, it is allowed (but why should you do so?), be consitent in that choice as well.
8.1.2 Line spacing
Generally, APA style advises to use double line spacing, and this should be used for the DA assignment.
If for another report you decide otherwise, which is possible within APA style, e.g. one-and-a-half spaced text, be consistent in this choice.
Check APA guideline about line spacing for more information.
8.1.3 Page numbering
Follow the instructions about page numbering for APA style student papers, i.e. the page number on the top left corner of every page.
Start a new chapter on an odd page. If a chapter ends on an odd page, leave one page blank. The blank page shouldn’t have a page number. In MS Word this can be done using sections: Insert/Break/Section Break (Odd Page).
8.1.4 Figures and Tables
Use APA style 7th edition for tables and figures (there are some changes with the 6th edition).
Some points of attention:
- Tables and Figures should be understandable on its own, without reading the text of the report
- In tables, use lines sparingly, don’t use vertical lines
- Generally graphs created in Excel, have to be adjusted before they can be published in a report
8.1.5 Results of significance tests
In explantory research hypothesis testing can be a usefull technique to operationalize a research question.
8.1.5.1 Example
For an example see the assignment format.
One of the formulated hypothesis in this format is:
H1: the average daily PM2.5 pollution in April 2020 is lower than the average in April in the years 2015 to 2019.
To operationalize this hypothesis first the daily average PM2.5 level for each day in the periods of interest is calculated.
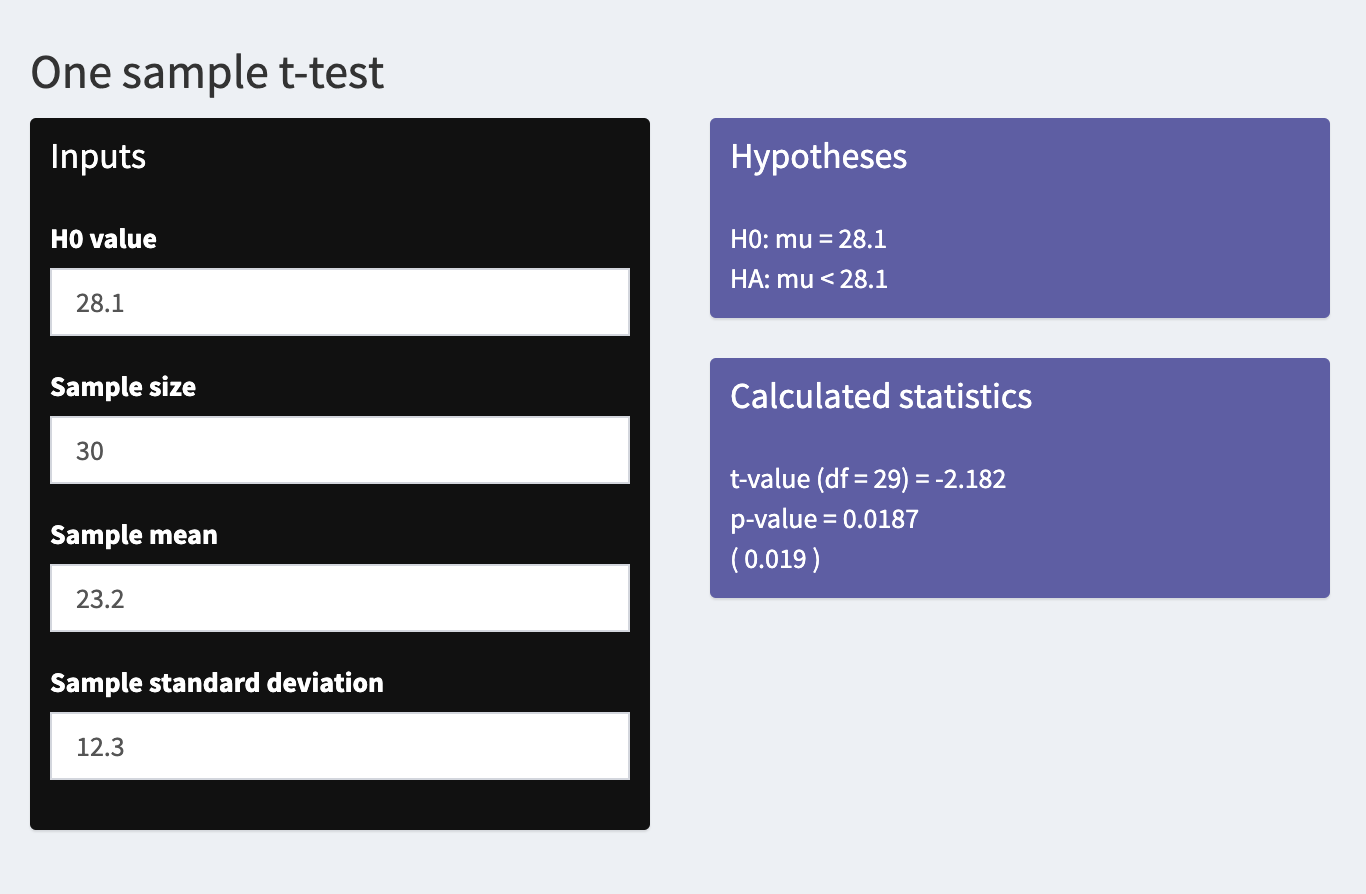
As a next step the average of the daily averages in the years 2015 to 2019 is calcualted and set as a norm in a one sample t-test: HA: average of daily averages in 2020 < norm.
In the result section of the report, the outcome of the hypothesis test is formulated according to APA style, e.g.:
It has been found that the average PM2.5 level in April 2020 (M = 23.2, SD = 12.3) is lower than 28.1, the average in April in the years 2015 to 2019, t(29) = -2.18, p = .019. 1
8.1.6 Example
Research topic: determinants of healthcare costs.
Hypothesis: employment is a significant determinant of healthcare costs.
Methodology: generating a simple linear reggression model with average healthcare costs per person in a municipality as response variable and employment rate in this municipality as explanatory variable.
Table 3.1
Regression output generated with MS Excel

As can be seen in Table 3.1, Employment Rate is a significant variable in the regression model, b = -75.13, p < .001, 95% CI = [-81.3; -69.0]. The effect size of Employment Rate is a decrease of at least 69 euro’s for every one percent increase in Employment Rate.
## Appendix 1 {-}
