Chapter 9 Cardiovascular System II
9.1 Blood Flow Through Vessels
The amount of blood flow through a vessel \(F\) is shown in equation (9.1):
\[\begin{equation} F = \frac{\Delta P}{R} \tag{9.1} \end{equation}\]
Where \(\Delta P\) is the pressure gradient and \(R\) is the resistance of the blood vessels.
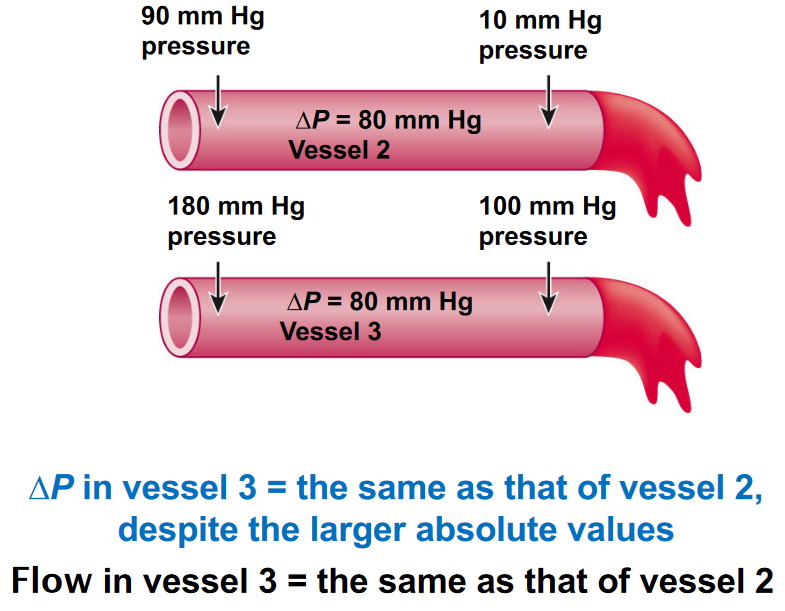
Figure 9.1: An Example of Pressure Gradients
9.1.1 What influences \(R\)?
A longer vessel raises the resistance of the vessel. Similarly, a smaller vessel radius \(r\) also confers a greater resistance.
In general, \(R\) is proportional to \(\frac{1}{r^4}\).
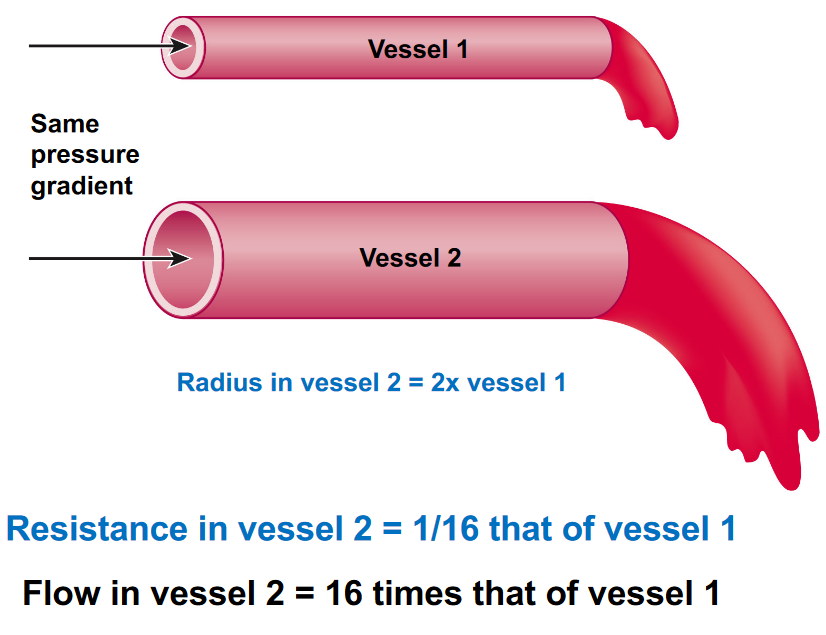
Figure 9.2: Vessel Radius Demonstration
9.1.1.1 Blood pressure and vessel compositions
Furthermore, ventricular contraction ejects blood from the major blood arteries, hence resulting in the flow of blood from regions of higher pressure to regions of lower pressure (i.e., the pressure gradient).
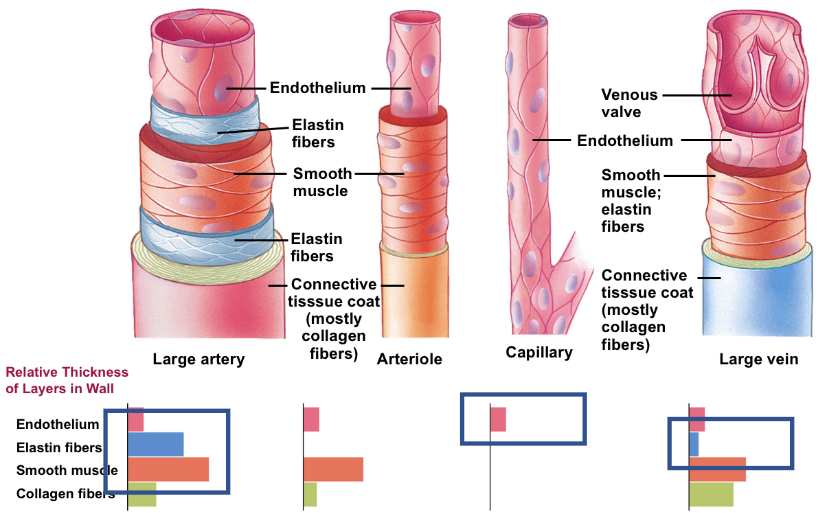
Figure 9.3: Composition of Blood Vessels
9.1.1.2 Systolic and diastolic blood pressure
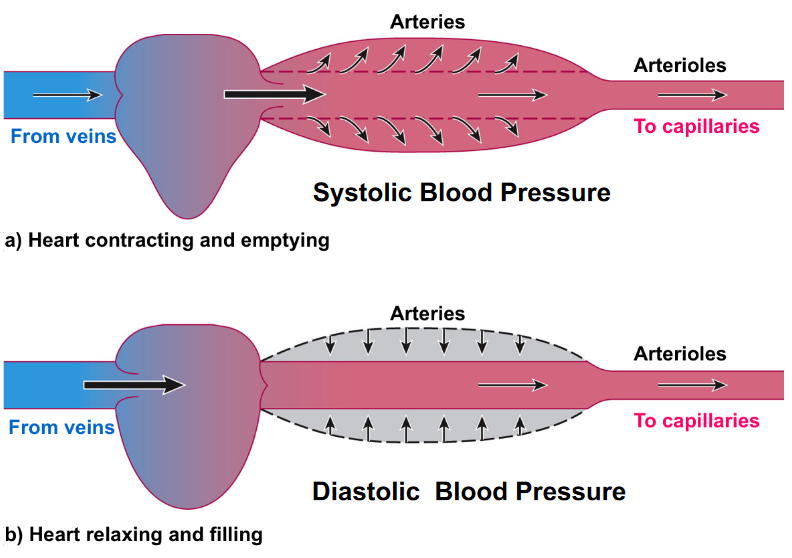
Figure 9.4: Systolic and Diastolic Blood Pressure
The systolic blood pressure is measured during periods of heart contraction and vessel emptying.
This is in contrast to the diastolic blood pressure: taken during heart relaxation and vessel filling.
9.2 Blood Vessels
9.2.1 Capiliaries
These vessels are thin-walled and have maximized surface area for diffusion:
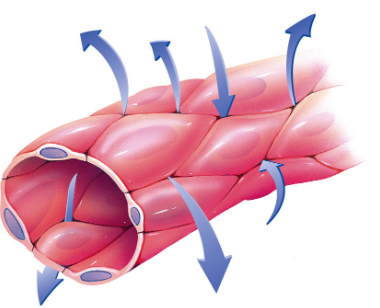
Figure 9.5: Capillary Structure
A large cross-sectional area results in slow blood velocity and hence, maximum time for nutrient and waste exchange.
9.2.2 Veins
Veins are responsible for returning blood back to the heart. They contain about 60% of blood volume.
Valves encourage the unidirectional flow of blood; external compression by skeletal muscle and venoconstriction by the sympathetic nervous system also aid in the flow of blood.
9.3 Heart Beat
All cardiac impulses originate at the sinoatrial (i.e., SA) node and spreads to the left and right atria (hence resulting in atrial contractions). The electrical impulse passes from the atria to the atriovenicular node.
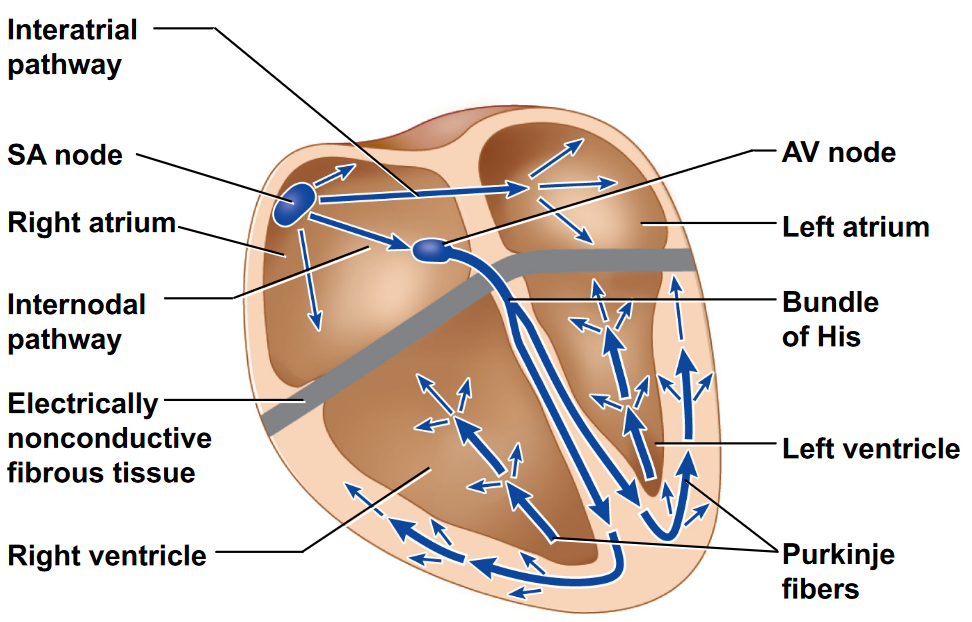
Figure 9.6: Electrical Signals in the Heart
The impulse then travels down the bundle of his (i.e., left and right bundle) before it rapidly moves through the Purjinke fibers and cause ventricular contraction.
9.3.1 Generating the electrical impulses.
Autorhythmic cells generate electrical impulses spontaneously; they deliver electrical impulses to gap junctions and carry excitations to neighboring cardiac muscle cells (i.e., contractile cells):
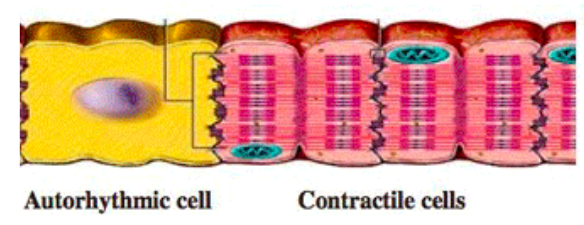
Figure 9.7: Contractile and Autorhythmic Cells
9.3.2 Ions and ion channels
There are two kinds of sodium ion channels:
- A fast channel
- A funny channel (i.e., slow)
Similarly, there are also two kinds of calcium ion channels:
- T type transient calcium channel (fast)
- L type long lasting calcium channel (slow)
Potassium ions diffuse out of the cell - there are also many types of potassium ions channels.
9.3.3 Pacemaker action potential
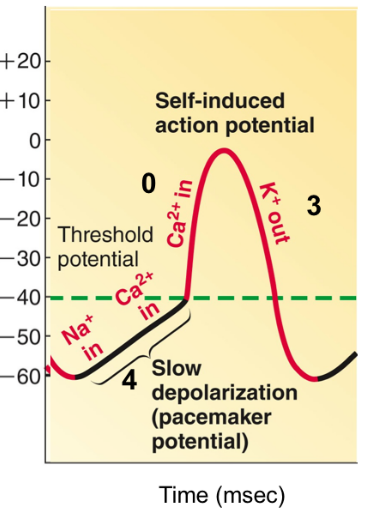
Figure 9.8: Pacemaker Action Potential
In phase 4, sodium ions diffuse in via the funny channels; calcium ions diffuse in via the L type channels at phase 0. In phase 3, potassium ions leak out of the heart.
Note that the SA node is the natural pacemaker in the human heart; when the SA node is diseased, other tissues can “take over.”
The heart rate is also moderated by the autonomic nervous system. The parasympathetic nervous system slows down heart rates by delaying the closure of potassium ion channels. This is in contrast to the sympathetic nervous system which increases heart rates by increasing the influx of sodium ions:
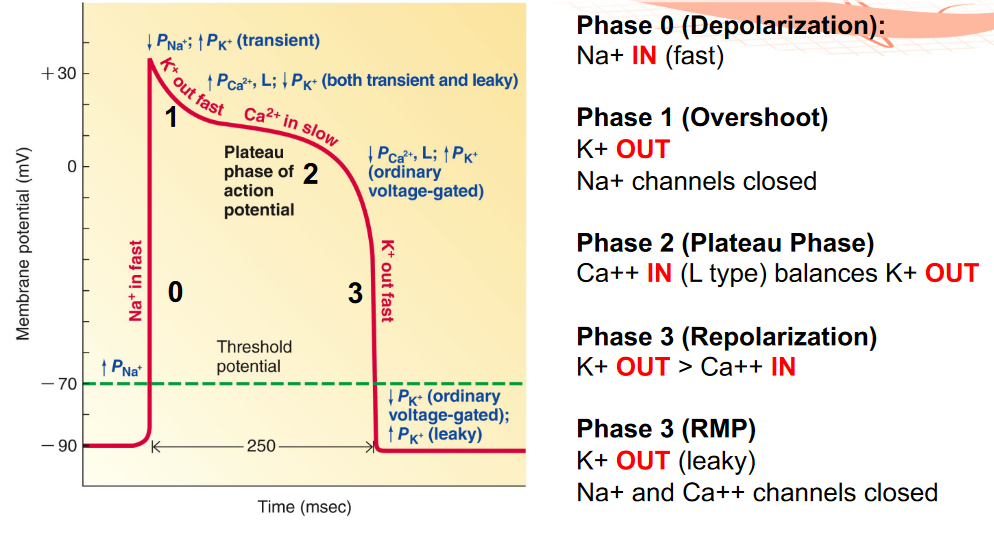
Figure 9.9: Contractile Cell Action Potential
Also, note the following differences between autorhythmic and contractile cells:
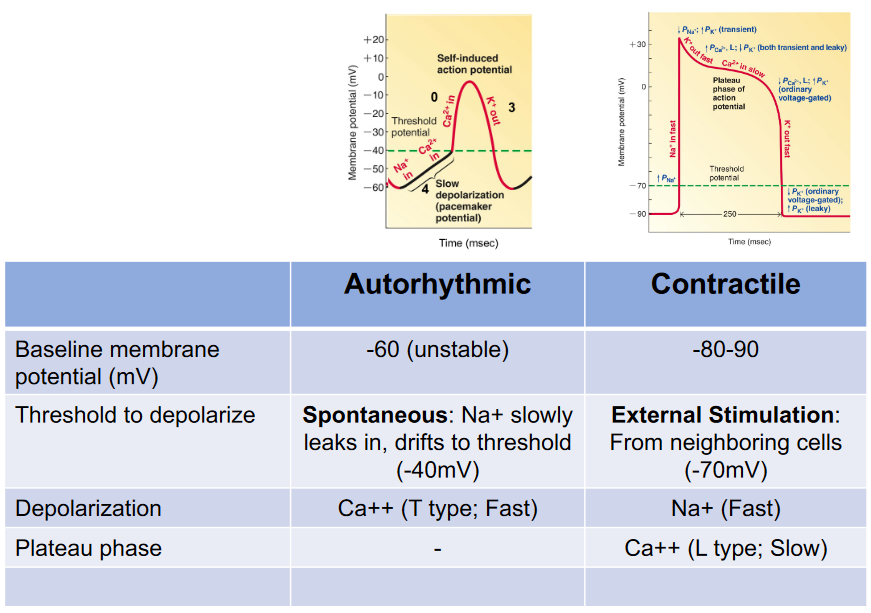
Figure 9.10: Differences Between Autorhythmic and Contractile Cells
9.3.4 Refractory periods
Refractory periods provide time between electrical activation and mechanical contraction.
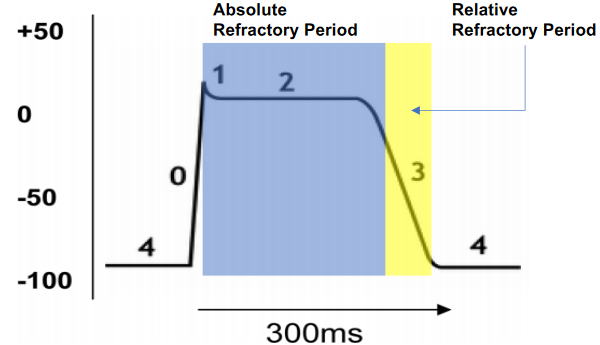
Figure 9.11: Refractory Periods
Inapprorpiate activations during refractory periods can cause lethal arrhythmias.
9.4 Electrocardiograms (ECGs)
The electrical activity of the heart can be captured via a 12-lead electrocardiogram - a heart beat is represented as such:
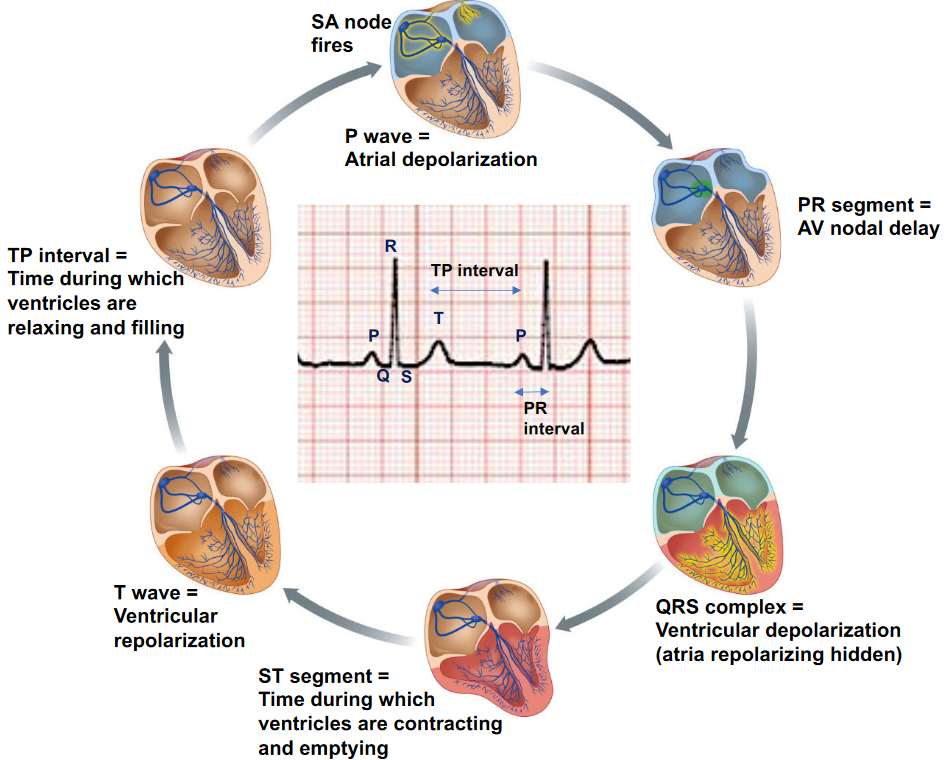
Figure 9.12: Segments of a Heart Beat
The P wave represents atrial contraction; the QRS complex represents ventricular contraction and atrial relaxation. The T wave represents ventricular relaxation and the PR segment represents the delay in the AV node.
9.4.1 When things go wrong…
Sick sinus syndrome happens when the SA node fails to fire. Consequently, the AV node or other electrical cells are left to fulfill the function of the SA node, resulting in unreliable and unstable contractions:
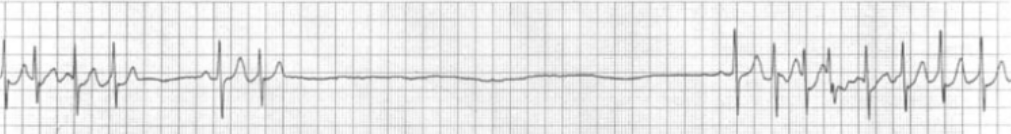
Figure 9.13: Unreliable and Unstable Heart Contractions