Chapter 21 Recipes!
Here we plan to add the R code (recipes) for key datasets in this skills pack. The first recipe is for creating the cookie dataset (“cookie_second_recipe”) used at the start. Please note that there will be slight differences in the output from the recipes due to the use of randomization whilst simulating the data. The R function, “rnorm” was used to generate the data. Have a look at the documentation for “rnorm” here: https://www.rdocumentation.org/packages/compositions/versions/1.40-3/topics/rnorm
21.1 The second cookie recipe
This dataset was used earlier to create the following plot.
library(ggplot2)

thebiscuits = read.csv("cookie_second_recipe.csv")


ggplot(thebiscuits, aes(x = chocolate_chips)) +facet_wrap(. ~timeframe,ncol=1)+
geom_histogram(binwidth=1,aes(fill = ..count..)) +
scale_x_continuous(name = "Number of chocolate chips in biscuits ",breaks=c(1:30))  +
scale_y_continuous(name = "Count") +
ggtitle("Figure 1: Chocolate chips in biscuits at biscuit factory")+
theme(text = element_text(size=40))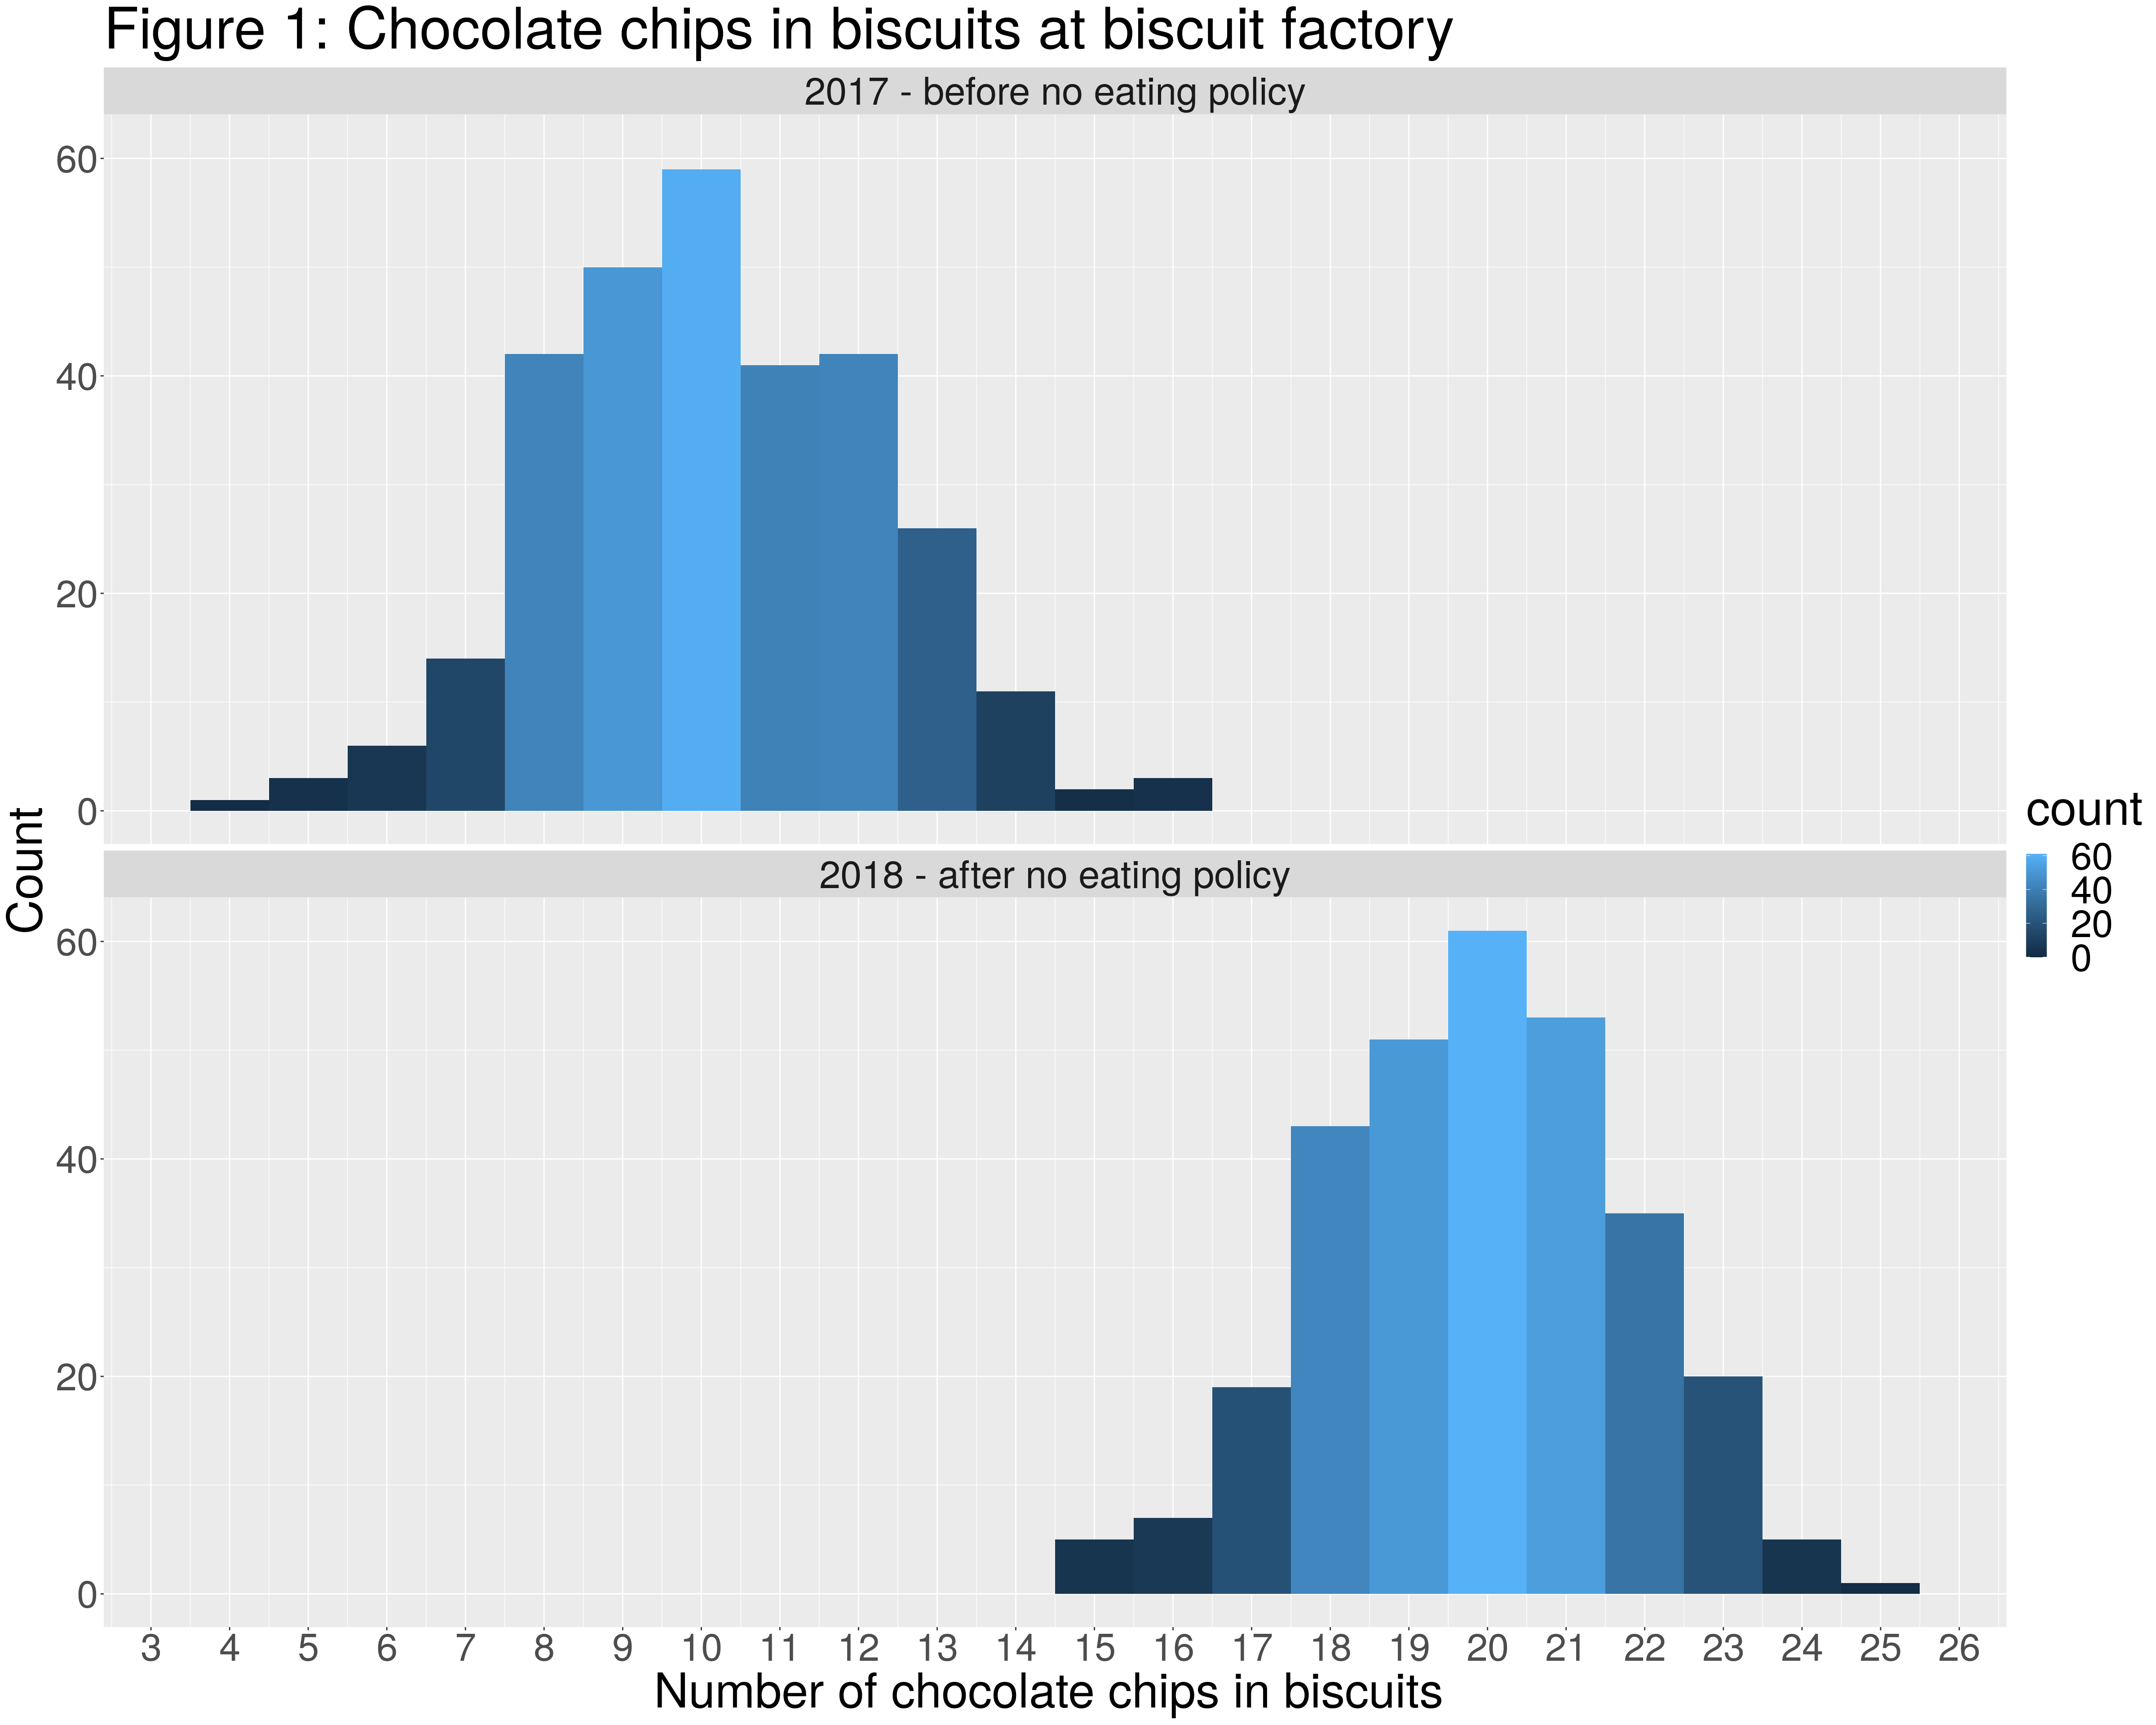
Below is the R code used to create the dataset.
batchChristmas2017 = c(rnorm(300,10,2))
batchChristmas2018 = c(rnorm(300,20,2))
stamp2017 = rep("2017 - before no eating policy",300)
stamp2018 = rep("2018 - after no eating policy",300)
b17 = data.frame(cbind(batchChristmas2017,stamp2017))
b18 = data.frame(cbind(batchChristmas2018,stamp2018))
colnames(b17) = colnames(b18)=c("chocolate_chips","year")
tin = data.frame(rbind(b17,b18))
tin$timeframe = tin$year
tin$chocolate_chips = as.numeric(tin$chocolate_chips)

# ggplot(tin, aes(x = chocolate_chips)) +facet_wrap(. ~timeframe,ncol=1)+
# geom_histogram(binwidth=1,aes(fill = ..count..)) +
# scale_x_continuous(name = "Number of chocolate chips in biscuits ",breaks=c(1:30))  +
# scale_y_continuous(name = "Count") +
# ggtitle("Figure 1: Chocolate chips in biscuits at biscuit factory")+
# theme(text = element_text(size=40))
Lets change the colours just for fun…
# ggplot(tin, aes(x = chocolate_chips)) +facet_wrap(. ~timeframe,ncol=1)+
# geom_histogram(binwidth=1,aes(fill = ..count..)) +
# scale_x_continuous(name = "Number of chocolate chips in biscuits ",breaks=c(1:30))  +
# scale_y_continuous(name = "Count") +
# ggtitle("Figure 1: Chocolate chips in biscuits at biscuit factory")+
# theme(text = element_text(size=40))+
#   scale_fill_viridis_c()