Chapter 4 Reading in data
If the .csv dataset is in your working directory, then the function *** read.csv*** can be used to “read in” the data into R. Try doing this with the cookie/biscuit data (and using the code below).
Use this link to get the cookie data: https://datasync.ed.ac.uk/index.php/s/UjkdcOebT7jrN7F (the password is “cookies”)
The first line of code allows you to read in the data. The chunk of code which follows allows you to plot the data as a histogram.
Can you remember what a histogram is? Check the SkillsPack-Practice R for a reminder.
thebiscuits = read.csv("cookie_second_recipe.csv")


ggplot(thebiscuits, aes(x = chocolate_chips)) +facet_wrap(. ~timeframe,ncol=1)+
geom_histogram(binwidth=1,aes(fill = ..count..)) +
scale_x_continuous(name = "Number of chocolate chips in biscuits ",breaks=c(1:30))  +
scale_y_continuous(name = "Count") +
ggtitle("Figure 1: Chocolate chips in biscuits at biscuit factory")+
theme(text = element_text(size=40))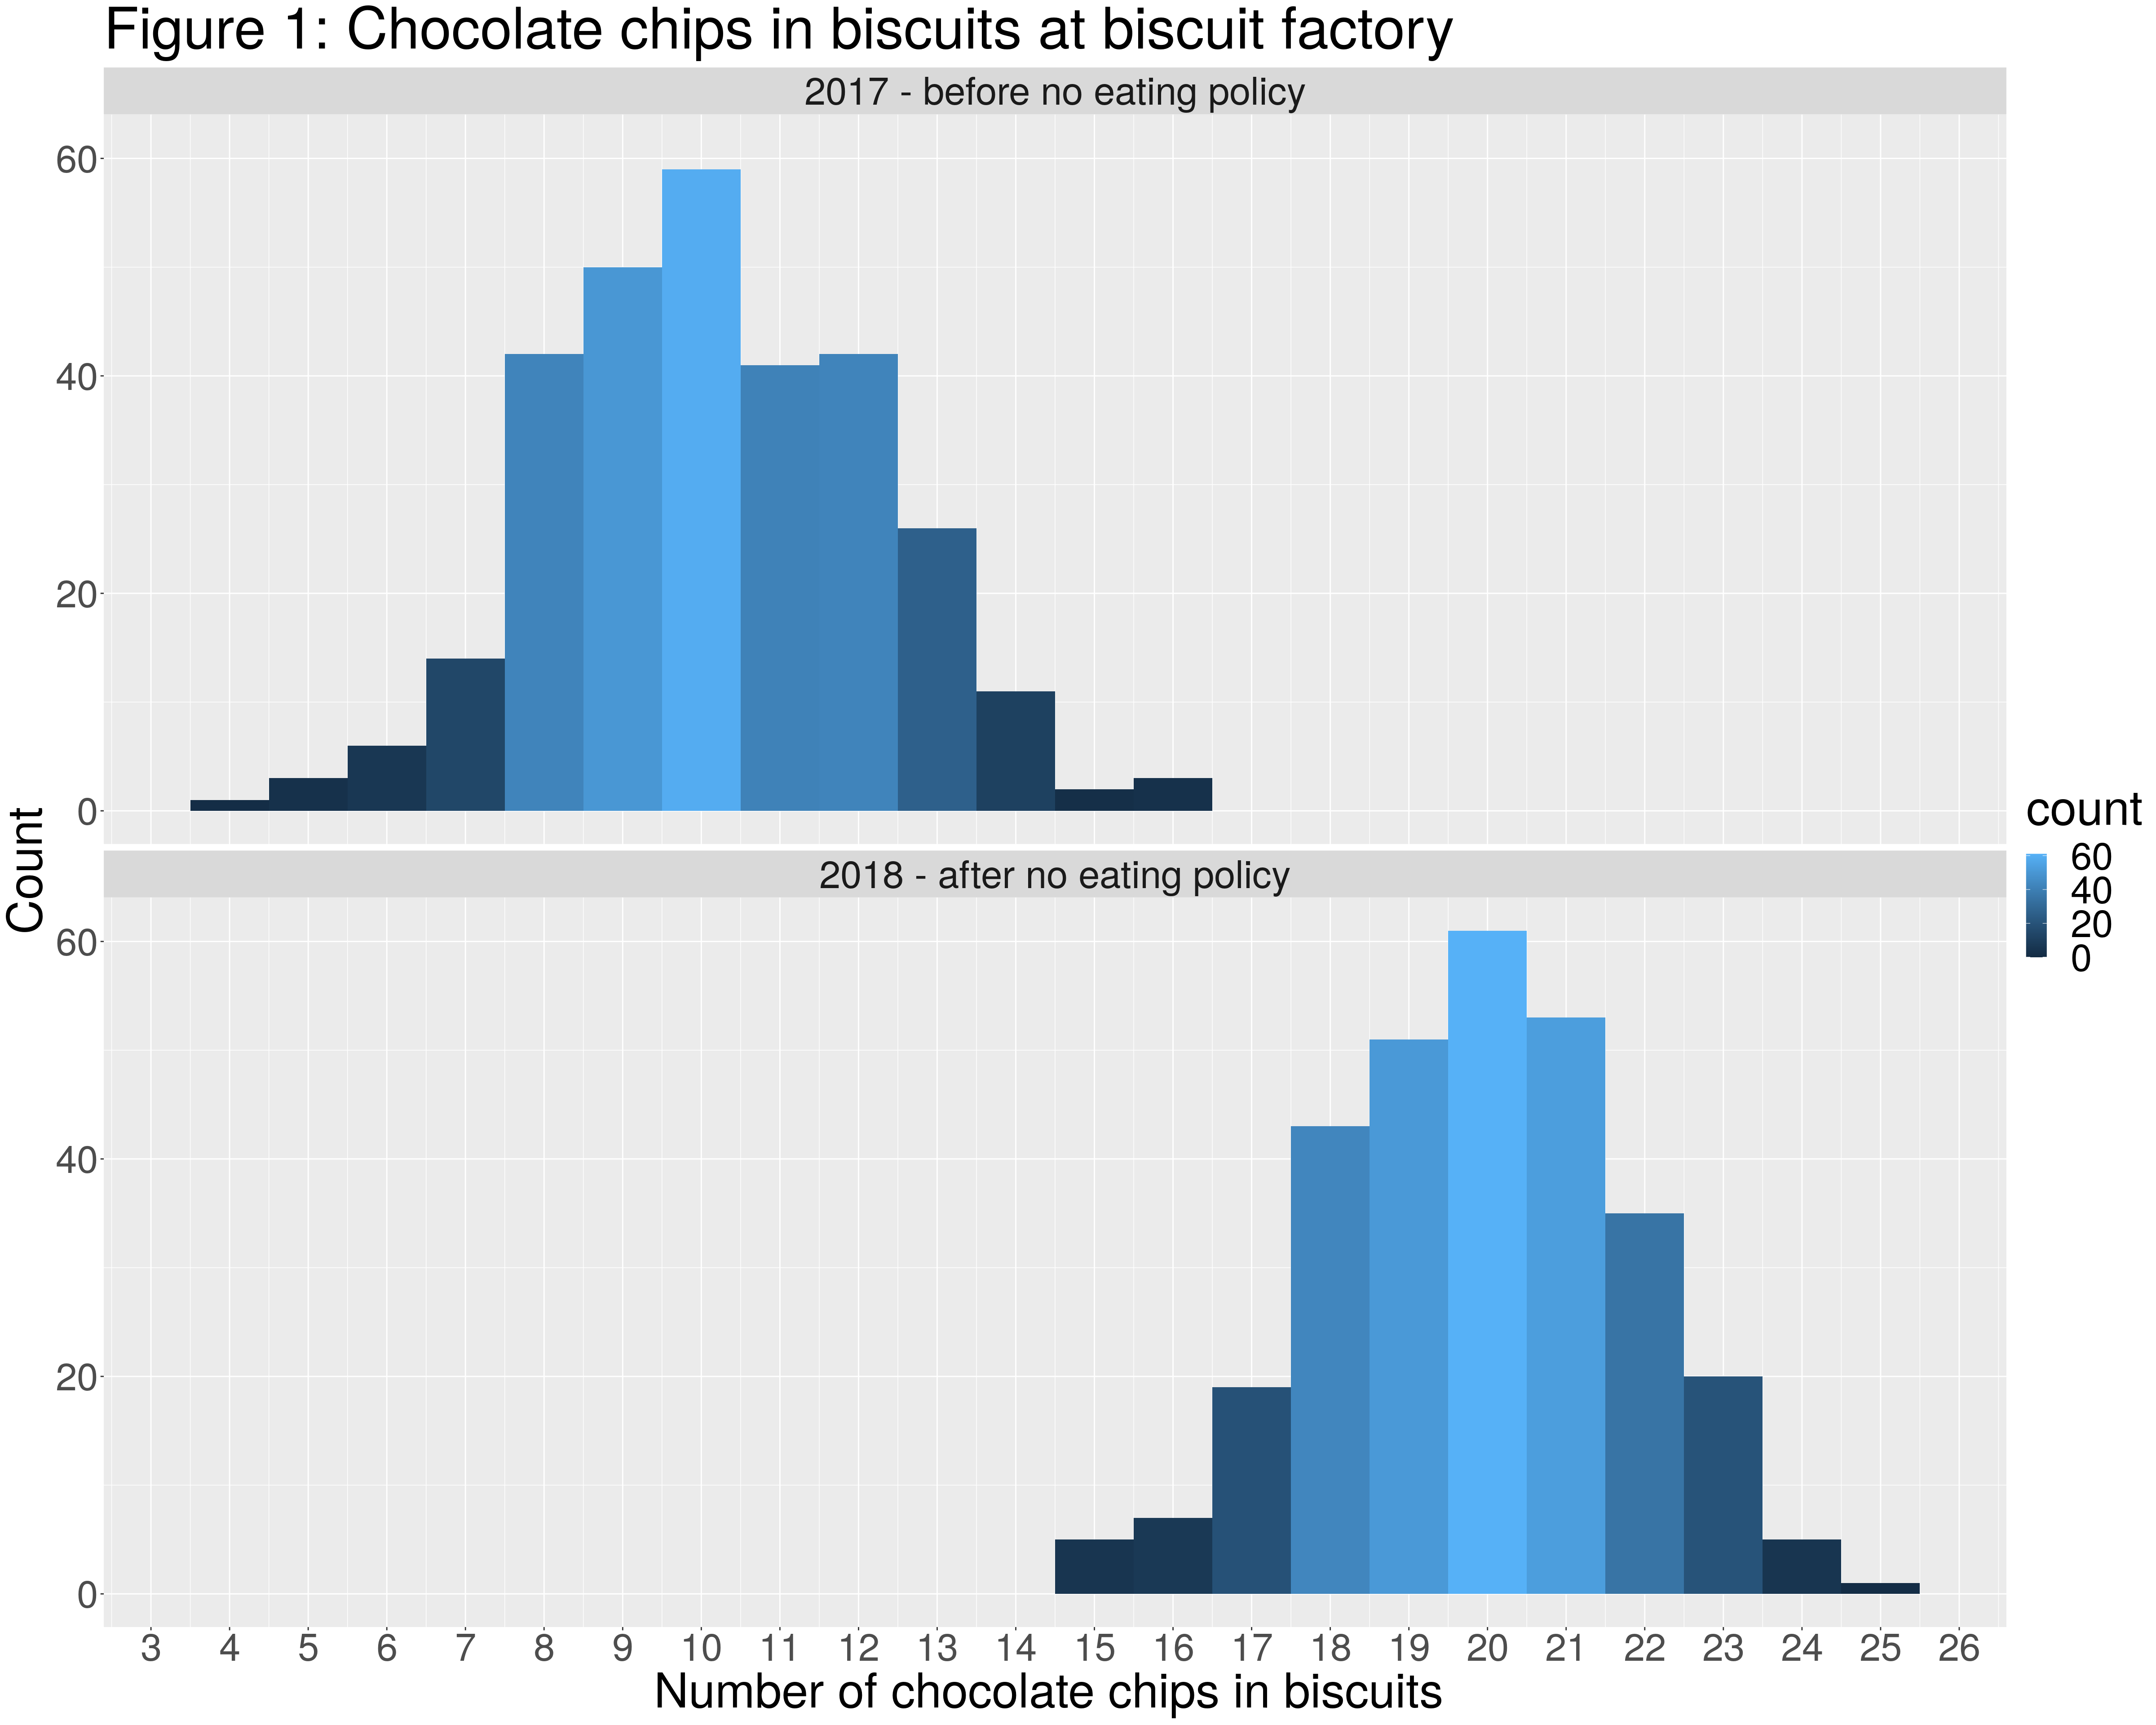
Try changing the title of the graph/plot. That can be done by changing the text within the brackets of the ggtitle function. Remove the code “facet_wrap(. ~timeframe,ncol=1)+” and run the resulting code. Has anything changed?