Chapter 13 ANOVA example
In islandX there are three varieties of cocoa. Because of their success with chocolate chip biscuits, the Cocoabix factory in islandX is interested in extending their production to include cocoa sticks. Cocoa sticks are produced and used locally in the islands. Flakes are grated off the sticks to make the beverage locally known as “dite caco”. This is a delicious chocolate beverage frequently eaten with “bakes”.
Before launching the “Cocoa stick” line, the Cocabix factory made a decision to assess which cocoa plant variety yields the most (g) cocoa.
The Cocabix factory data analysts have conducted a preliminary test to check whether the weight of the cocoa pods produced by the different varieties of cocoa plants have similar weights. They’ve collected data on each variety; 1000 cocoa pods per variety and conducted an Analysis of Variance (ANOVA) test to assess the hypothesis: “there is no statistically significant difference between the mean weight (g) of cocoa pods from the three cocoa plant varieties”. In their briefing paper they’ve expressed this hypothesis (null hypothesis) as \(H_{0}: \mu_{Forastero} = \mu_{Criollo} = \mu_{Trinitario}\) where \(\mu\) denotes the true mean for cocoa pod weight.
A summary of the data can be found in Table 1. Figure 1 provides a graphical summary of the data as well.
Forastero = rnorm(1000,420,10)
Criollo= rnorm(1000,420,10)
Trinitario= rnorm(1000,390,10)
Weight= round(c(Forastero,Criollo,Trinitario),2)
Variety = c(rep("Forastero",1000),rep("Criollo",1000),rep("Trinitario",1000))
Investigate = data.frame(cbind(Weight,Variety))

Investigate$Weight = as.numeric(as.character(Investigate$Weight))
library(ggplot2)

p<-ggplot(Investigate, aes(x=Variety, y=Weight, fill=Variety)) +
  geom_boxplot(lwd=3)

p+scale_fill_brewer(palette="Dark2")+
  theme(text = element_text(size=50))+xlab("Cocoa plant variety")+
  ylab("Cocoa pod wt(g)")+ggtitle("Figure 1: Cocoa pod weight (g)")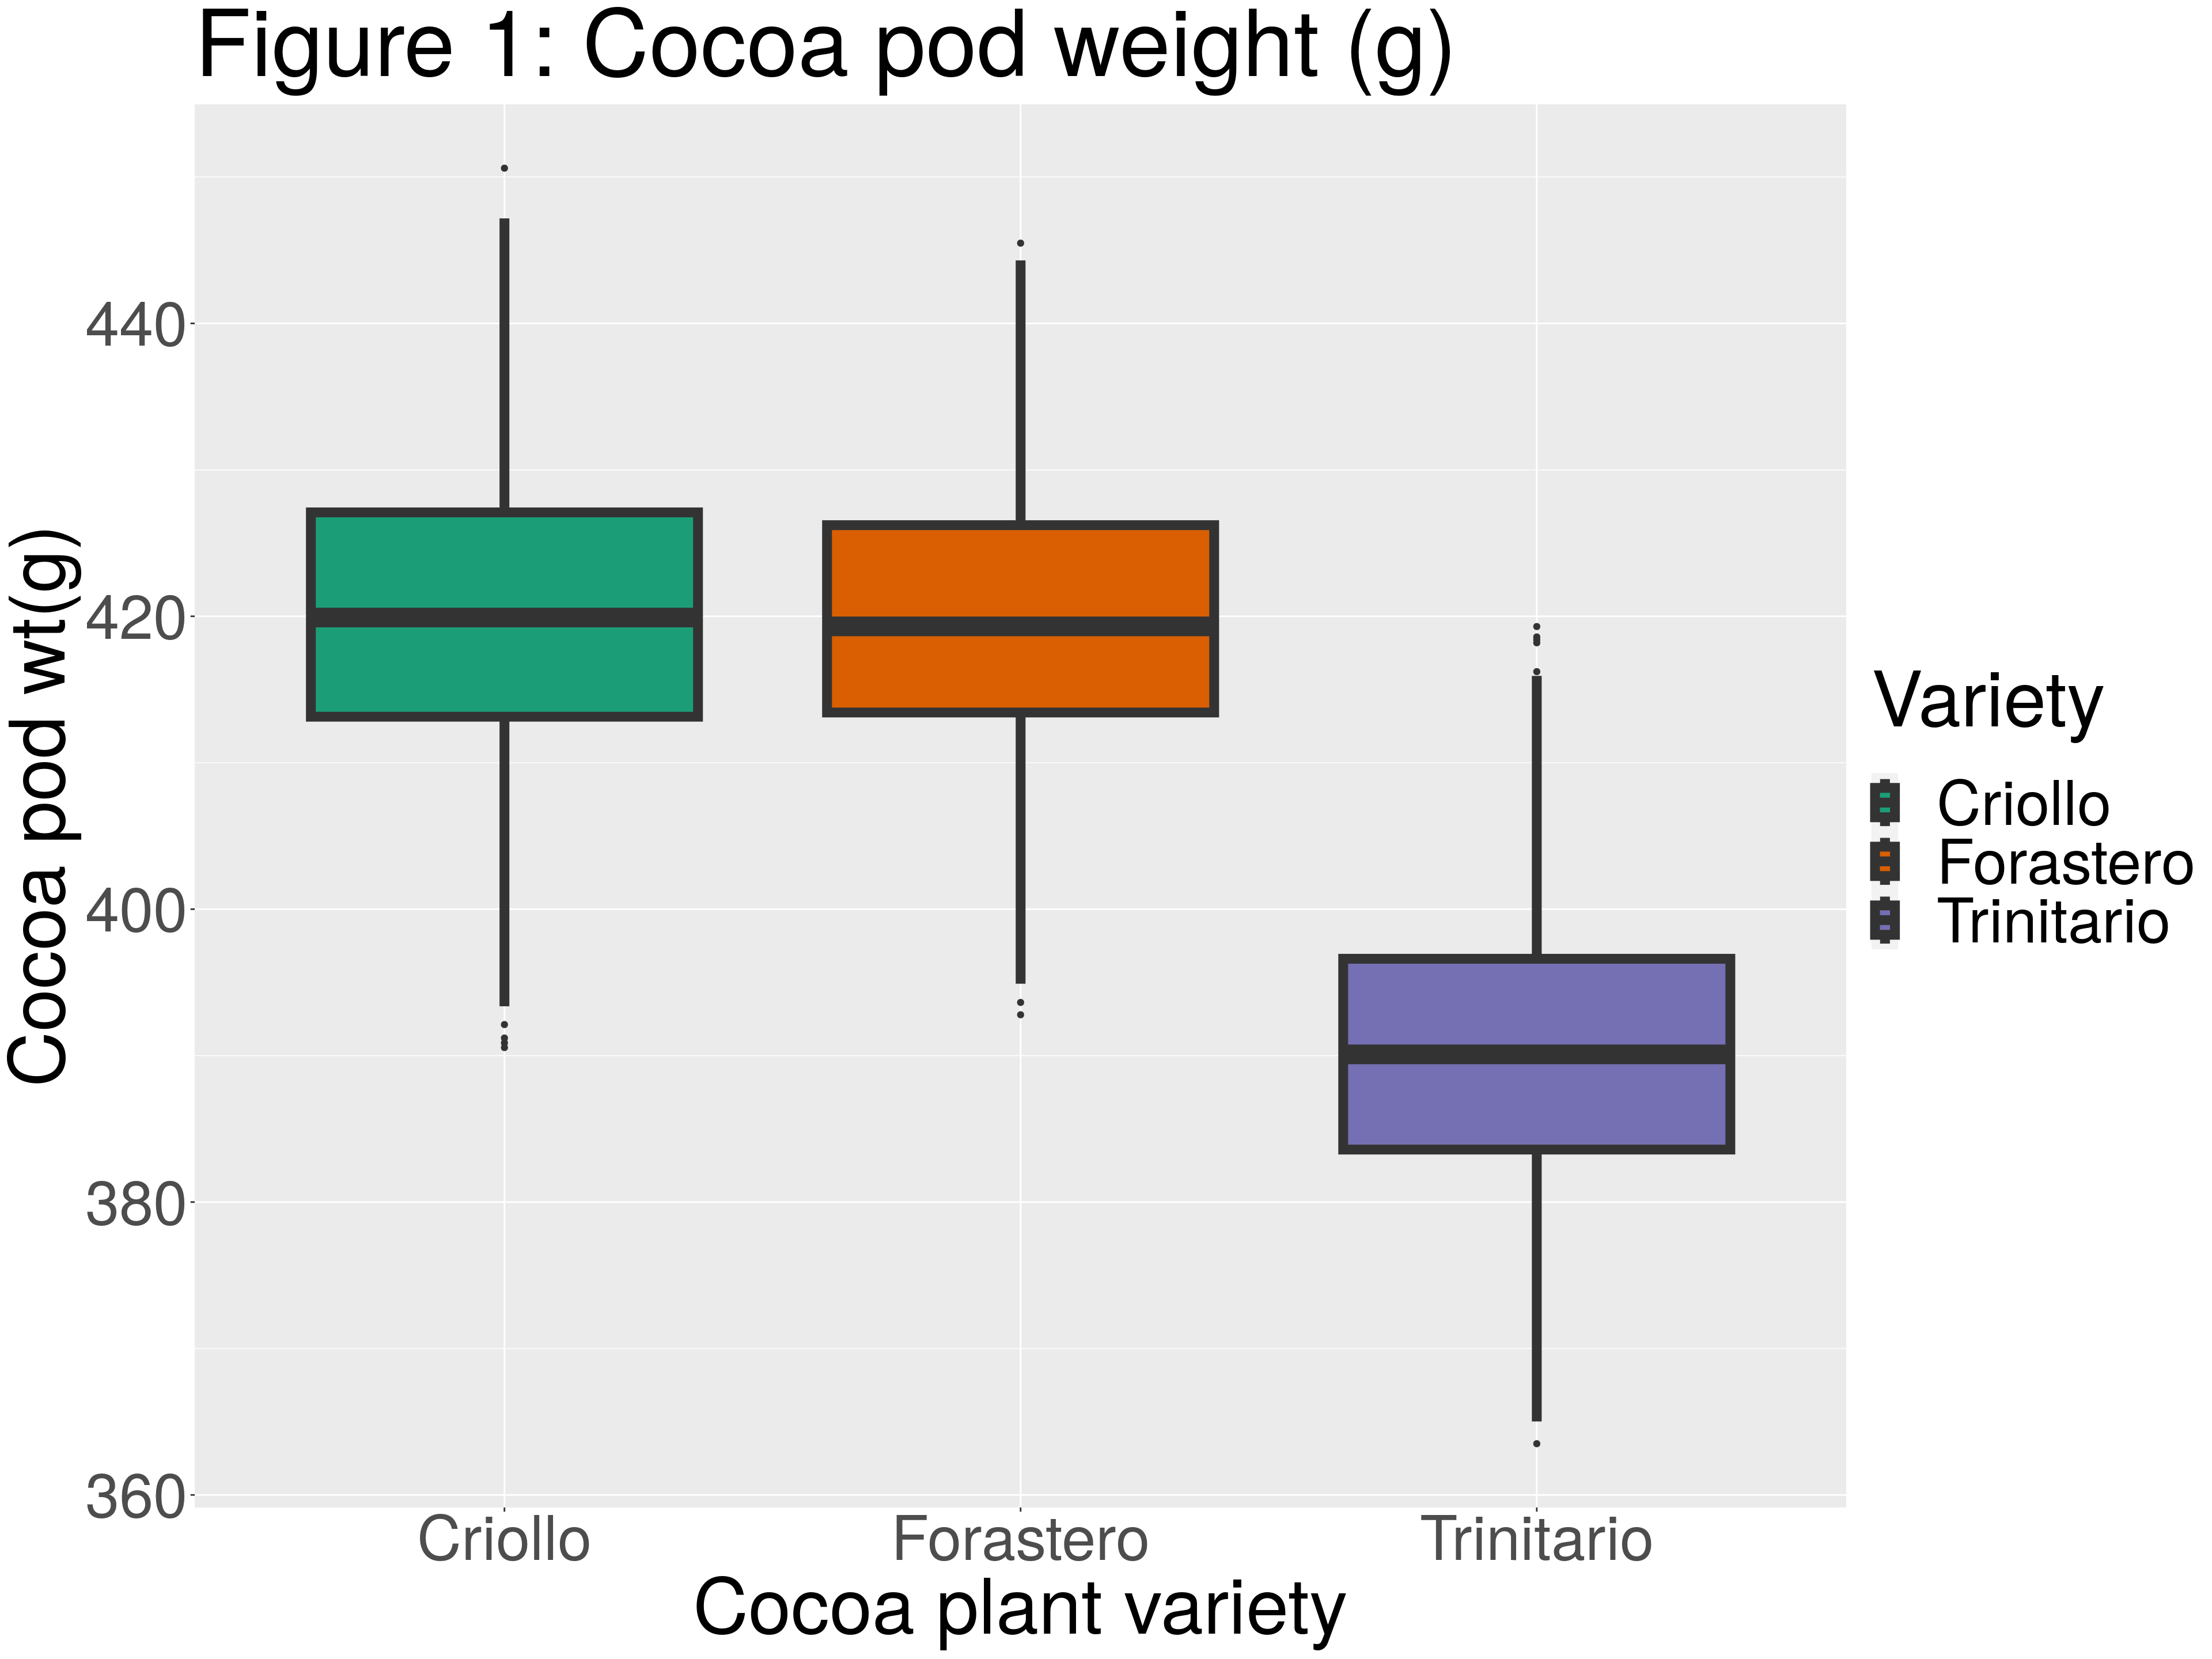
library(dplyr)
library(kableExtra)
library(magrittr)

summaryc = group_by(Investigate, Variety) %>%
  summarise(count = n(),
    mean = mean(Weight, na.rm = TRUE),
    sd = sd(Weight, na.rm = TRUE))

summaryc[,2:4] = round(summaryc[,2:4])
kable(summaryc,caption="Table 1: Tabulated summary of weight of cocoa pods")%>%
kable_styling(bootstrap_options = "striped", full_width = F)| Variety | count | mean | sd |
|---|---|---|---|
| Criollo | 1000 | 420 | 10 |
| Forastero | 1000 | 420 | 10 |
| Trinitario | 1000 | 390 | 10 |