Chapter 10 Regional reanalysis (UERRA-HARMONIE) & Surface Reanalysis (MESCAN-SURFEX)
10.1 Importance of Regional Reanalysis
Atmospheric reanalysis is a method to reconstruct the past weather by combining historical observations with a dynamical model. It provides a physically and dynamically coherent description of the state of the atmosphere. The synthesis is accomplished by assimilating the observational data into a meteorological model and thereby forcing the model to reproduce the observations as closely as possible. The main advantage of reanalyses is that they provide a multivariate, spatially complete, and coherent record of the atmospheric state – far more complete than any observational dataset. Another advantage is that reanalyses are produced with a single version of a data assimilation system – including the forecast model used – and is therefore not affected by changes in method.
10.2 Copernicus Regional Reanalysis for Europe service
The Copernicus Regional Reanalysis for Europe service produces and delivers a regional reanalysis (RRA) including long-term datasets of Essential Climate Variables (ECVs).
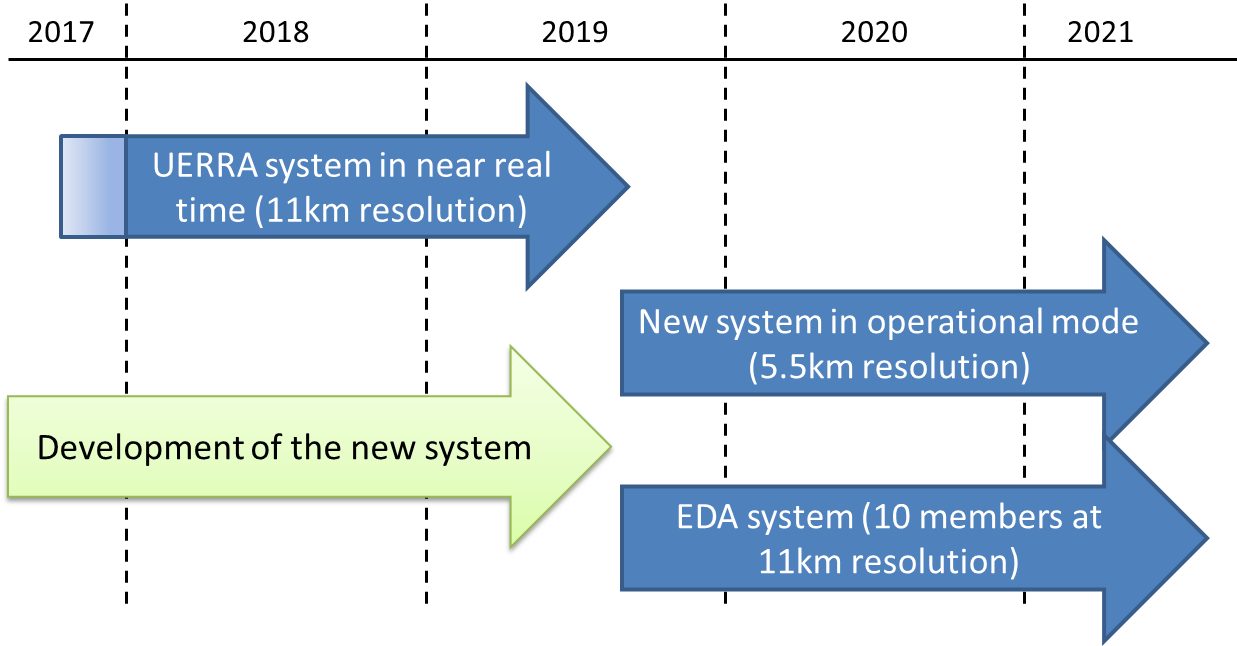
The service is implemented in several steps. First, a system developed in the FP7 pre-operational project UERRA (Uncertainties in Ensembles of Regional ReAnalysis) is used to [1] update the existing RRA in near real time. In combination with the RRA produced already in the pre-operational project, the service offers a consistent RRA from 1961 to near real time.
Moreover, an [2] improved model version will be developed within the service. The model will be used to create a pan-European reanalysis with very high resolution (5.5 km) forced by the global ERA5 reanalysis. The improved system should become operational in the second half of 2019.
rr-for-europe
See also introductory video online.
10.3 Available data
- Period 1961 - “now”, with monthly updates
- 11km horizontal resolution including entire Europe
- 65 height levels
- Hourly for many parameters
- 31 surface parameters (less on i.e. height levels)
- Almost 500 TB of data
- Additional data is available on surface and soil levels with 5.5 km resolution every 6th hour.
10.4 Methodology
10.4.1 Global Reanalysis (ERA40/ERA-Interim) —> Regional Reanalysis (UERRA-HARMONIE)
global-to-regional
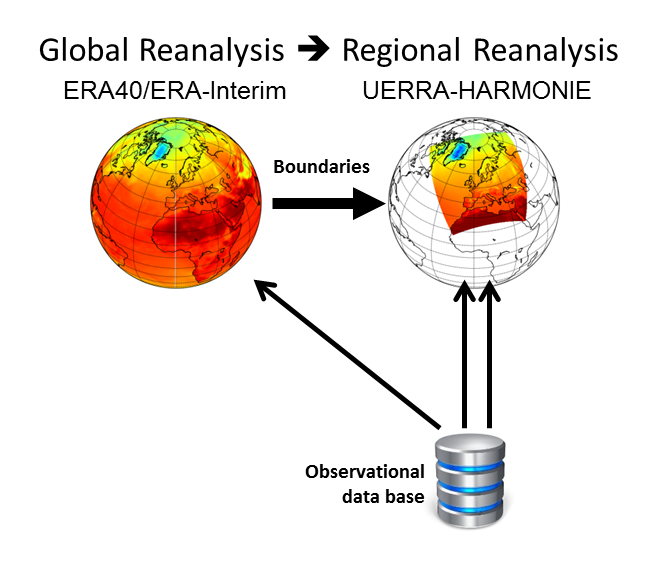
The 3D-UERRA system is based on the HARMONIE Data Assimilation system, which is developed and used within the HIRLAM (High Resolution Limited Area Model) and ALADIN (Aire Limitée Adaptation dynamique Développement InterNational) consortia.
For the period 1961-2001 ERA40 observations with addition of Swedish and French observations are used. After 2001 conventional data (SYNOP, Ship, Buoys, Radiosondes, Pilot and Aircraft) are used that are operationally available.
The system uses global reanalysis data as lateral boundaries: ERA40 for the period 1961-1978, after that ERA-interim.
10.4.1.1 UERRA-HARMONIE system: data assimilation
uerra-harmonie
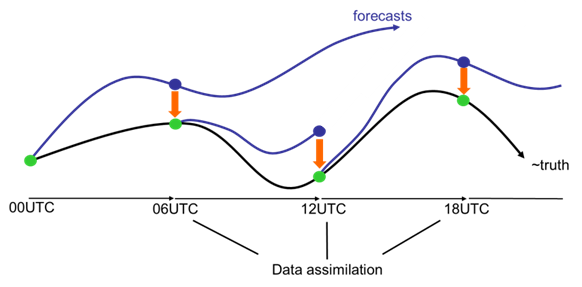
Reanalysis uses a weather forecasting model to create a ‘first guess’ of the atmospheric state at a certain time. The first guess is then corrected on the basis of observations. This corrective step is referred to as ‘data assimilation’.
The UERRA-HARMONIE system applies the so called 3D variational analysis (3D-VAR). At fixed points in time the model state is adjusted based on the observed state, taking into account the statistics of model and observation errors. The UERRA-HARMONIE system is run with four cycles per day performing analyses at 00UTC, 06UTC, 12UTC and 18UTC. The forecast lengths vary between 6 and 30 hours.
10.4.2 Regional Reanalysis (UERRA-HARMONIE) —> Surface Reanalysis (MESCAN-SURFEX)
regional-to-surface
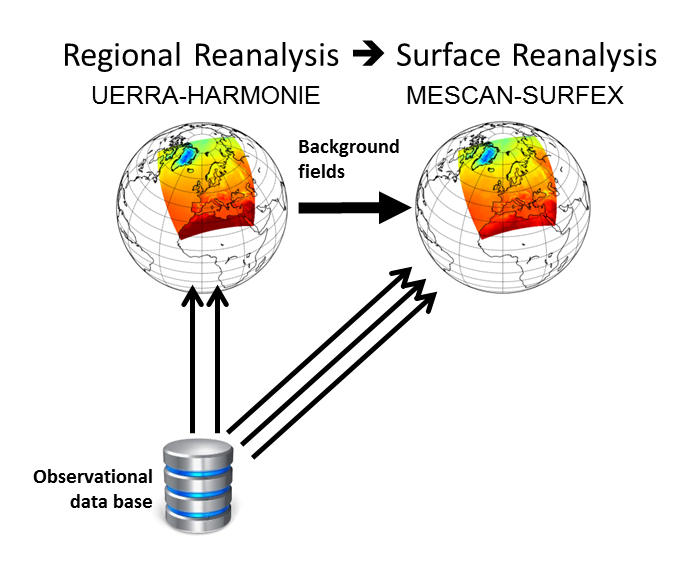
The MESCAN-SURFEX system analysis uses the 2D-analysis system MESCAN and the land surface platform SURFEX to generate a coherent surface and soil analysis. The system combines downscaled UERRA-HARMONIE reanalysis fields and additional surface observation (especially for precipitation), to make a high resolution (5.5 km) 2-dimensional analysis over Europe for every 6th hour.
MESCAN is a surface analysis system using an optimal interpolation algorithm for the 2m temperature and relative humidity and for the 24h-accumulated rainfall. SURFEX is a land surface platform, which is driven by temperature, humidity, precipitation, wind and radiative fluxes.
10.5 Guidelines on using UERRA-HARMONIE & MESCAN-SURFEX data
This is a summary of some important features of the models and results that the user needs to be aware of when using the UERRA datasets. More information is available in the user guide.
Although UERRA provides consistent and coherent datasets there are weaknesses and limitations. Some of these are common for reanalyses in general, other are model/version dependent. The user has to decide whether the data is fit for their specific purpose.
Vast amount of data are available from the UERRA system. For the UERRA-HARMONIE system, a complete set of parameters including all available time steps take up ca. 8 TB (TB = terabyte, 1 terabyte of data could fill about 1500 CD:s) per model year and hence almost 500 TB for the entire time period. The MESCAN-SURFEX surface analysis is not included in this estimation. However, it needs less storage place than the 3D-reanalysis – in total 47 TB.
For the UERRA-HARMONIE data, the user might choose among more than 50 parameters for different heights and time steps. In addition, the MESCAN-SURFEX analysis offers roughly 30 parameters for the surface and the soil (down to 12m).
10.5.1 Spatial Resolution
Horizontal resolution All parameters are computed for grid boxes. This means the parameter values reflect a mean over the grid box area. This needs to be considered when for instance UERRA data are compared with observations.
Having a horizontal resolution of 11km for the UERRA-HARMONIE system implies that each value reflects the mean over an area of 121km² (11km*11km).
The resolution of the MESCAN-SURFEX surface analysis is 5.5km*5.5km. Hence, a grid box has an area of roughly 30km².
Vertical resolution The UERRA-HARMONIE system has 65 vertical levels but the major part of the data is stored on selected pressure levels. Pressure levels are available between 1000-10hPa with a higher resolution at lower altitudes. In addition, some parameters are stored on height levels. 11 height levels are available between 15-500m.
The UERRA-HARMONIE soil model has 3 vertical levels. The three levels represent approximately the surface, the soil at root depth and the deep soil. Due to the used force-restore scheme in the soil model it is not possible to relate the levels with a certain depth in meters.
The MESCAN-SURFEX soil model has 14 vertical levels, which range from the surface to a depth of 12m. The edges between different levels are at 0.01m, 0.04m, 0.1m, 0.2m, 0.4m, 0.6m, 0.8m, 1.0m, 1.5m, 2m, 3m, 5m, 8m, and 12m. Values for a certain level reflect the mean value over the level thickness.
10.5.2 Temporal Resolution
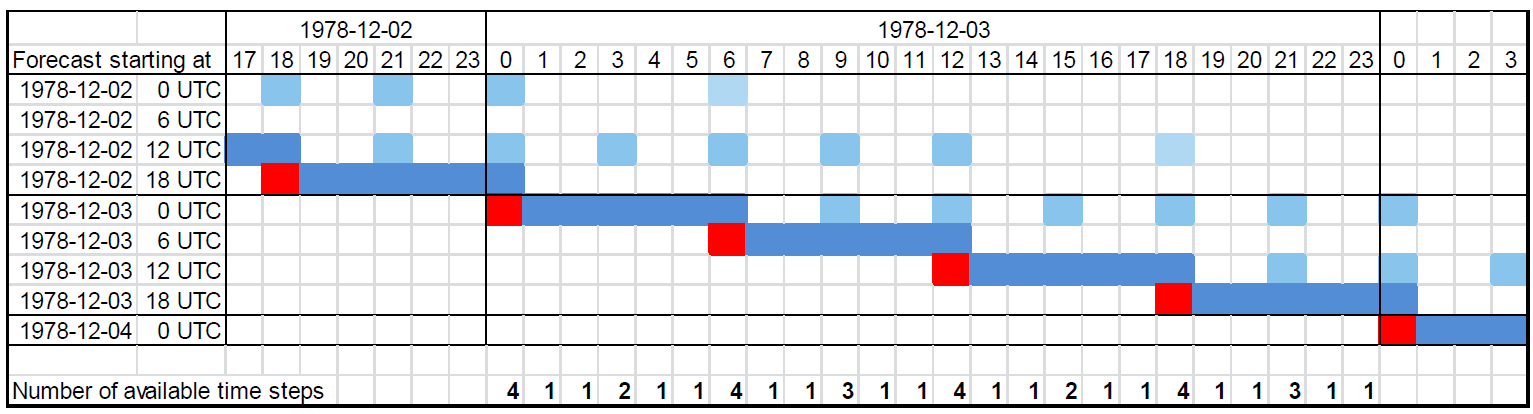
The figure below gives an overview on available time steps for the UERRA-HARMONIE system. First, there are the four analyses at 00UTC, 06UTC, 12UTC, and 18UTC highlighted in red. These time steps should be of highest quality since the observations are assimilated directly. However, they are available only every sixth hour and not all parameters are available for the analyses.
Forecasts are then started from the analyses and the output is saved hourly for the first six hours as indicated by the dark blue boxes in the figure below. Forecasts initiated at 06UTC and 18UTC stop after six hours while forecasts initiated at 00UTC and 12UTC continue until forecast hour 30. However, the output frequency is reduced to three hourly until forecast hour 24 and the last output is then saved six hours later (blue boxes)
forecast-time
Different forecasts lengths have different strengths and weaknesses. Whereas the short-term forecasts are affected by spin-up issues after the initialization of the model the long-term forecasts might veer away from the real weather due to shortcomings in the model. It is not possible to give a general recommendation for which time steps should be used. The user needs to decide which selection should give the best result for the application.
The MESCAN-SURFEX output is essentially hourly except for the driving variables used as input by SURFEX. The analyzed variables are 2m temperature and relative humidity, radiative fluxes and wind with a frequency of 6h and 24h precipitation** only available at 6h UTC.
10.6 Limitations of reanalysis
Generally it is challenging for a reanalysis system to correctly reconstruct variables that have large space and time variability, such as precipitation. Therefore, for some applications, e.g. in hydrology, it is quite common to bias correct precipitation data. Other variables, like surface temperature, are generally less variable in space and time and easier to reconstruct by the reanalysis system.
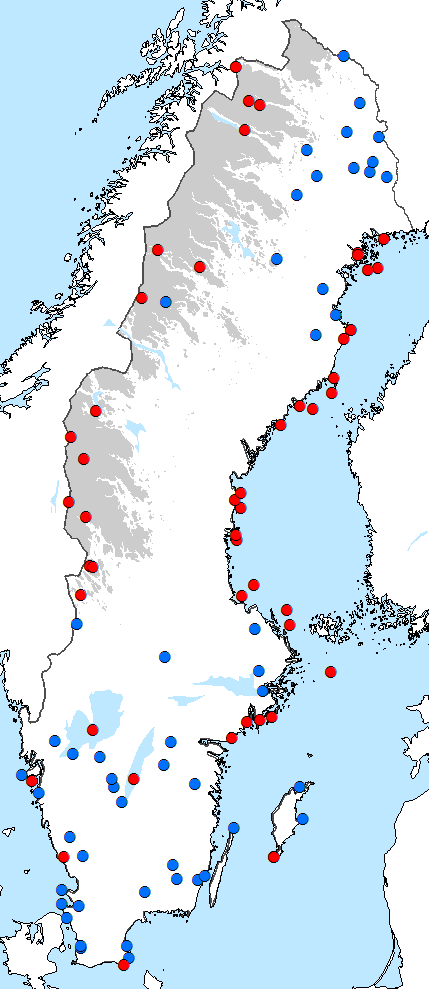
Similarly, results in complex terrain, such as mountainous regions or coastal areas, are generally less reliable than results over a more homogeneous terrain. The current models cannot represent the strong gradients that sometimes are caused by the variable terrain.
The figure below illustrates this behavior. The best (blue) and worst (red) correlations between the UERRA-HARMONIE 2m-temperature and observational sites is illustrated for Swedish locations. A total of 853 measurement sites have been investigated and the 50 with highest and lowest correlation are shown. Mountains higher than 500 m are coloured gray in the map. Clearly, correlations are lowest in the Swedish mountain areas (north-west) and along the (east) coast.
reanalysis-limitations
10.7 Model specific issues
In the UERRA reanalyses some problems have been noticed that users need to be aware of. The most important issues currently known are listed here, for more information please read section 2.3 of the UERRA product user guide.
10.7.1 UERRA-HARMONIE spin-up issues (and effects on wind, temperature and precipitation data)
Spin-up issues are a general problem for data assimilation and Numerical Weather Prediction systems. Spin-ups occur at the beginning of model runs. Due to the assimilation of observational data the model becomes slightly out of balance. Then, the model needs some time to ramp up and stabilize. In the UERRA-HARMONIE system, observations are assimilated four times a day and each time the model needs to adjust to the observations causing a spin-up.
Unfortunately this particular issue is in the UERRA-HARMONIE case somewhat extreme. But the issue causing the problem is located and the next RRA should not be affected as much by spin-up problems as the current version.
The largest spin-up issues occurs during the first 1-2 hours of the forecast. It is therefore recommended to primarily use the 6 hourly analysis fields whenever this is possible. Also, it seems that three hourly values can be used without larger restriction. The spin-up problems are most pronounced during turbulent conditions, for example connected to deep low pressure systems, and should therefore be limited in space and time.
Wind
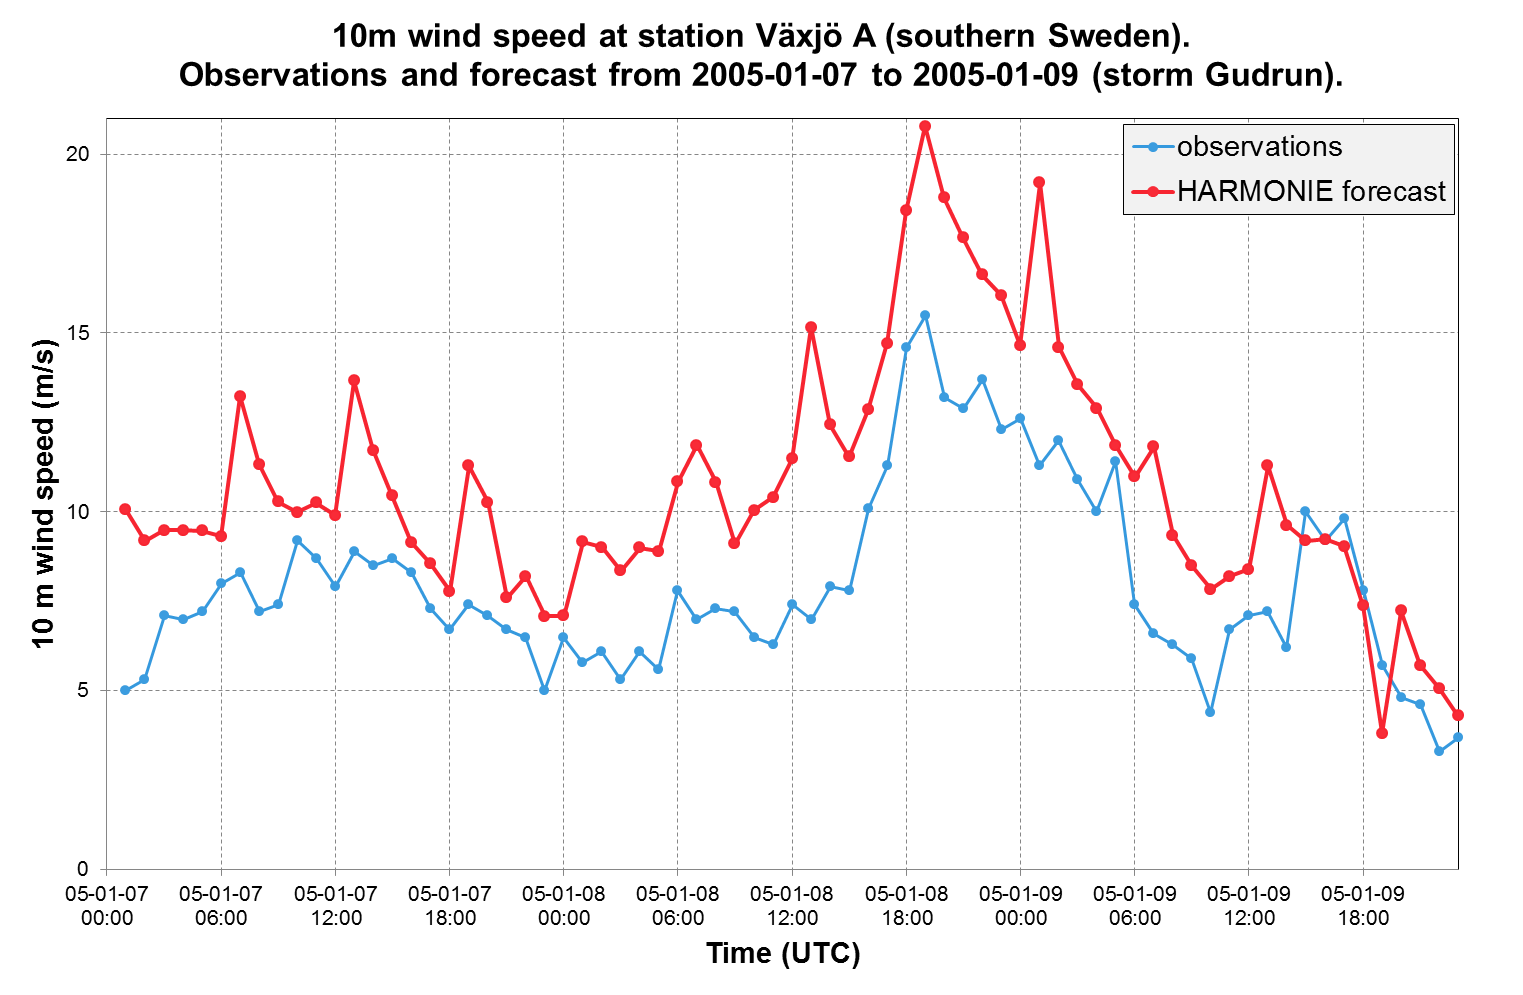
Spin-up problems are in some situations causing wind speeds for the first 1-2 hour forecasts being too high. This is most pronounced in the wind gust but the problem also occurs for the mean wind at 10 meter altitude, see the figure below.
spin-up
Figure: 10m wind speed during a storm in southern Sweden January 2005. The blue line and dots are hourly observations from station Växjo A. Red line and dots are the hourly UERRA-HARMONIE forecast for the closest grid point. Note the reoccurring leaps in wind speed during forecast hours 1-2. Also note that this rather extreme case is picked as an example.
Temperature
Similar spin-up problems can be seen for maximum/minimum temperature. This can in turn cause errors in the cold/warm extremes which affect climate indices such as frost days, tropical nights, ice days and summer days.
Precipitation
Models have usually longer spin-up times for precipitation. For the UERRA-HARMONIE case, we do not recommended to use the first 6 hours of the forecasts for precipitation. Tests have shown that you get best daily precipitation (24h accumulated precipitation) if you use data from the long forecasts. For example, take a 30h forecast and subtract the 6h forecast to get precipitation for a 24h period. This way you can avoid using the initial most spin-up affected forecast steps.
10.7.2 MESCAN-SURFEX precipitation observations
In the MESCAN-SURFEX surface analysis errors have been noticed in the precipitation fields for some areas and time periods. These errors are most likely due to erroneous observations, which did enter the assimilation procedure. It remains a challenge for the next system to solve this type of weaknesses – especially for “old” and validated data where precipitation is equal to zero for long period.
Since the errors are restricted in time and space, the user has to evaluate if the studied time period or region is affected.
10.8 Download and processing of UERRA-HARMONIE or MESCAN-SURFEX data
10.8.1 Copernicus Climate Data Store Website
The recommended way of handling the UERRA datasets is via the Copernicus Climate Data Store (CDS), located at climate.copernicus.eu. The CDS provides user friendly access to documentation and datasets download. There is also a toolbox for web based processing and plotting of the data.
10.8.2 Copernicus Climate Data Store API
The CDS download form and toolbox should cover most user needs for data access and processing. But users who need to download large amounts of data or need data that are not yet listed in the CDS should use the CDS API for programmatic access of the UERRA datasets. The CDS API provides access to all the data that is published within the service.
Data access via the CDS API requires installation of the python based API client and execution of python extraction scripts on the users computer. A guide for the installation process and some example scripts are available at the API how-to page.
Some UERRA-specific example extraction scripts are provided on the user examples GitHub. There are separate folders containing example scripts for data that are listed in the CDS and for data that are not yet listed in the CDS.
The request syntax for unlisted data is based on the ECMWF MARS retrieval system. Before running these scripts it is recommended to explore the available data and the corresponding MARS requests via Web-MARS: UERRA-HARMONIE data in Web-MARS MESCAN-SURFEX data in Web-MARS Then modify the time, parameters, levels etc. in the scripts to match your specific needs.