Chapter 8 Climate Observations
For a basic overview of different types of observations, see the dedicated section in the first chapter.
8.1 Differentiation between types of measurements (direct/indirect, remote, in-situ)
8.1.1 Direct vs. Indirect
Direct observations are observations you can measure directly, for example the temperature or pressure at a land station.
Indirect observations are observations that are derived from other observations. For example, past temperatures can be derived from tree ring or ice cores
8.1.2 In-situ vs remote
In situ sensors only measure their immediate environment. (e.g. weather stations on land measuring temperature or radiosondes)
Remote sensors measure over distances that extend significantly beyond the location of the instrument (e.g. radar, satellites, lidar)
8.2 Identification of different types of meteorological observing systems and their of observational representativeness including temporal and spatial (microscale, local scale, mesoscale, large scale, planetary scale) scales of phenomena, and measurement capability
There are different observing networks:
8.2.1 Weather stations on land
There are thousands of weather or meteorological stations measuring at or near the Earth’s surface meteorological parameters such as atmospheric pressure, wind speed and direction, air temperature and relative humidity. These are observations at one location, or “in situ”. The number of stations is not evenly distributed over the Earth (see figure). The World Meteorological Organisation (WMO) formulated standards for these meteorological stations (e.g. temperature is measured at 2 meters height, around the station there should not be high vegetation). For more info see: WMO (Best practices)
The most common measured quantities by weather stations are:
- temperature (2 m)
- grass temperature (5 cm)
- soil temperature
- humidity
- precipitation
- radiation
- wind speed and direction
- clouds
- pressure
- visibility
Some stations have long time series with data for each day since 1850. Some stations also have information at higher temporal resolution (e.g. per hour). Most station data in Europe have been digitised.
8.2.1.1 Measurement conditions
To be able to compare and combine measurements between different meteorological stations there are strict criteria for the set up of measurement sites and the measurement techniques.
Measurements are generally done in open areas in the countryside that are representative for the surroundings.
Measurements in cities are difficult, it is hard to find a location where measurements are representative for a larger area. Differences in especially wind and temperature can be very large over short distances in a city. However, many people live in urban areas, and for example temperature is often somewhat higher in urban areas (Urban Heat Island = UHI). Therefore, there is an increasing number of measuring networks in cities. WMO guidelines of meteorological instruments and methods of observation: link.
A number stations also directly measure greenhouse gases as part of the WMO Global Atmosphere Watch (GAW) project. They measure relatively undisturbed air, at remote locations or near the top of mountains:
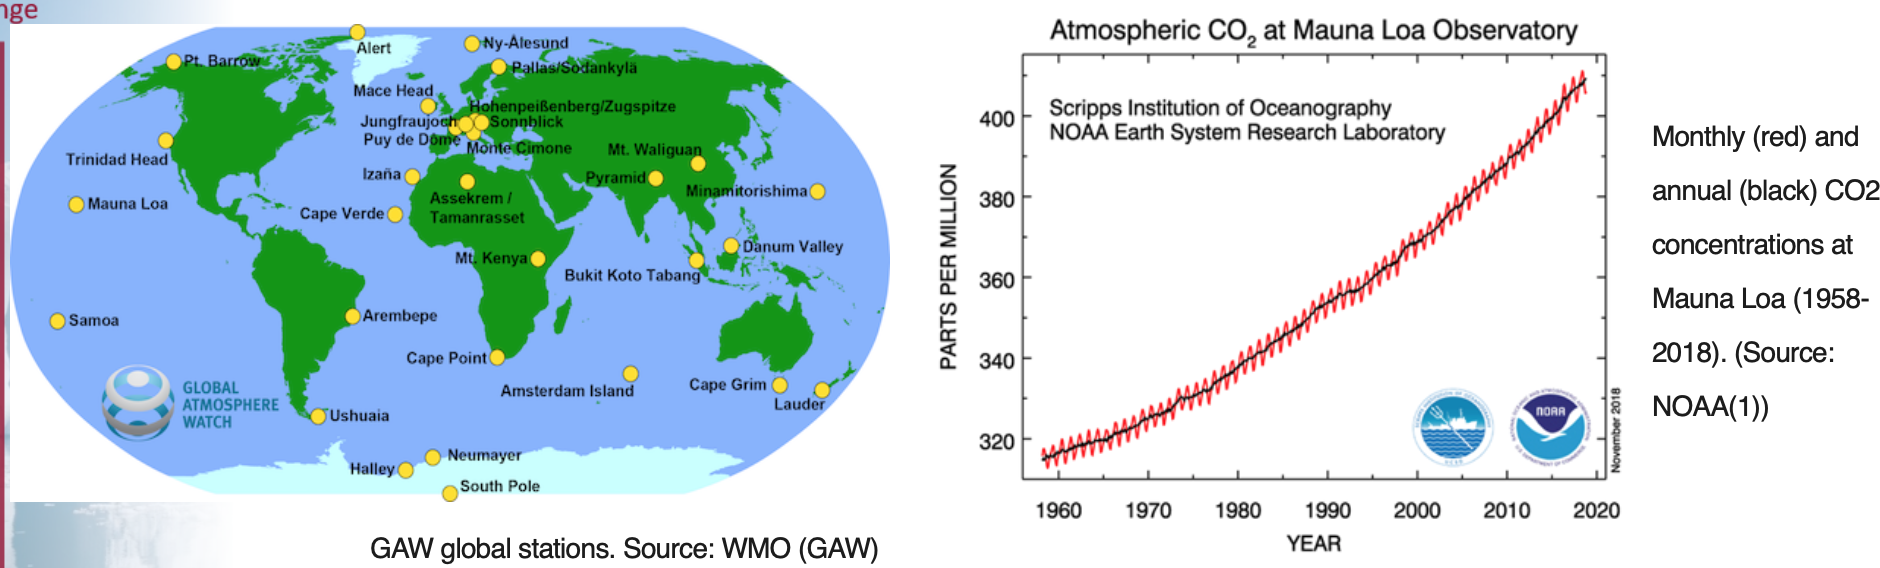
climate-stations
8.2.1.2 Pros and cons of land stations
Advantages:
- Some land stations measure since the 1850’s, a lot more from the 1950’s . Therefore long time series are availabe for these sites.
- Direct measurement of the Essential Climate Variables (ECV’s)
Disadvantages:
- They are not evenly distributed along the globe. Especially the southern hemisphere and the arctic regions are underrepresented.
- In-situ measurements are only representative for a small area around the measurement site. Features like the urban heat island will be missed.
- Inhomogeneities are present in many time series because of changes to the measurement site or it surroundings
8.2.2 Observations at sea
Over the oceans the Global Ocean Observing System (GOOS) relies on:
- ships
- moored and drifting buoys
- stationary platforms.
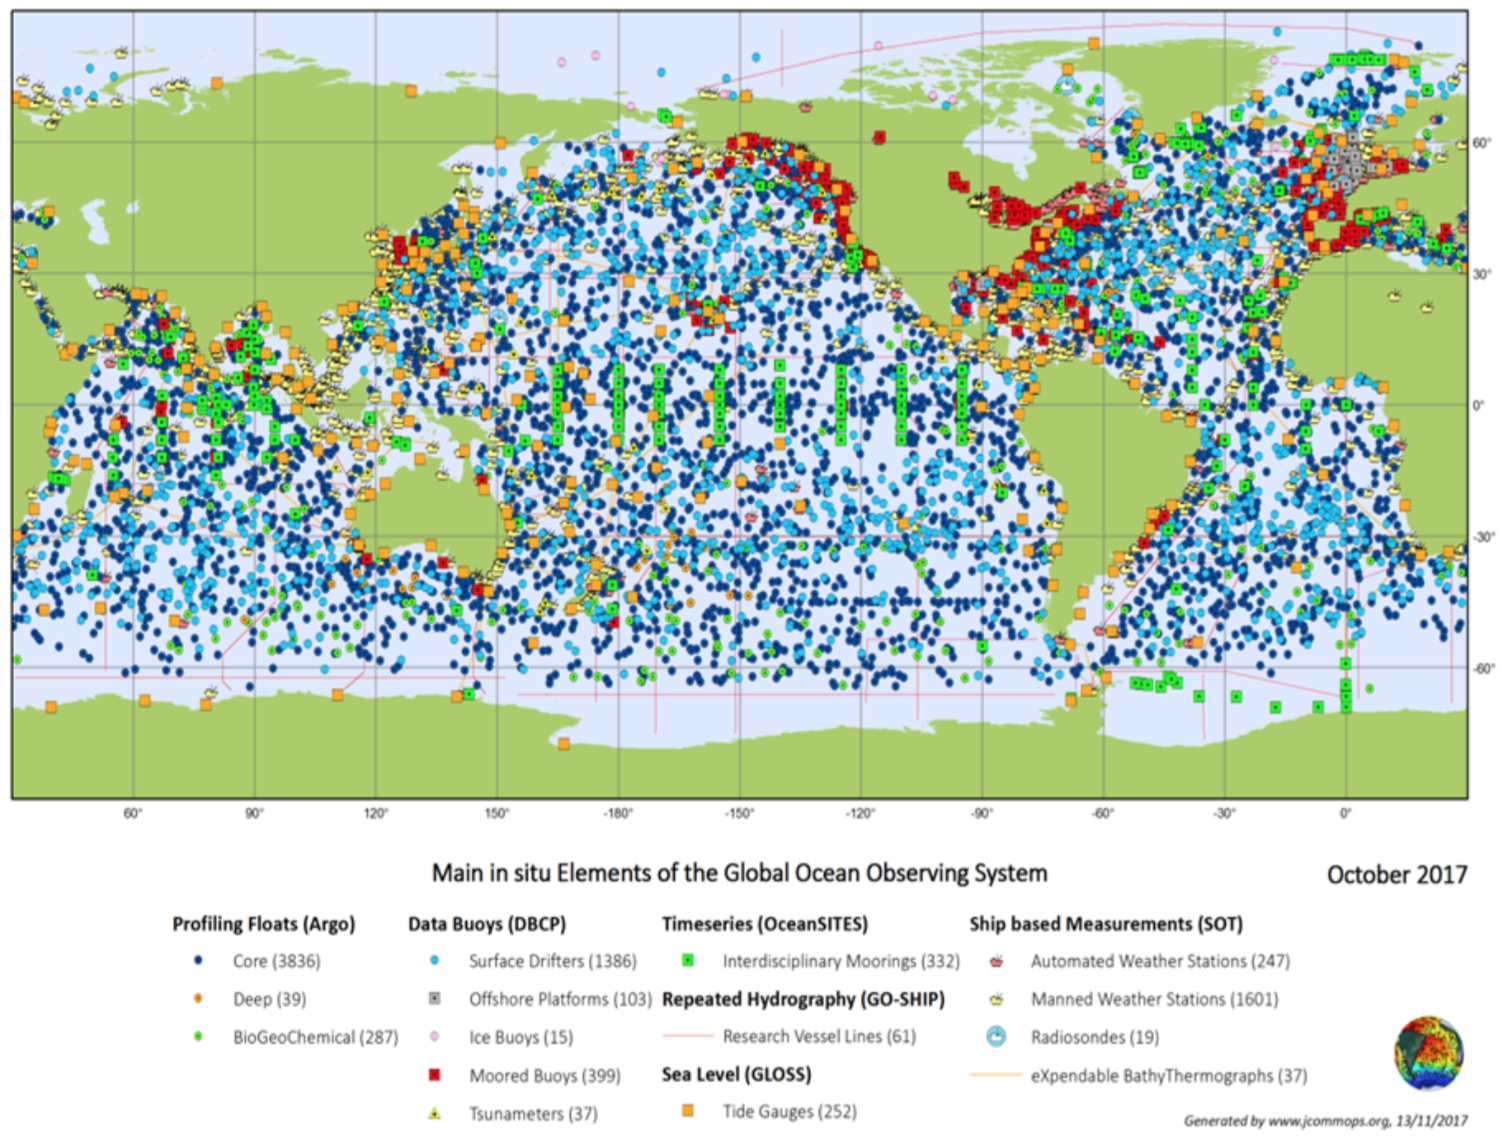
observations-sea
Source: WMO (GOS)
8.2.2.1 Ships
Ships measure much the same variables as at surface land stations. Observations are made by ships recruited under the WMO Voluntary Observing Ship (VOS) Programme. They provide information on trajectories, not for one location. The number of observing ships is around 4 000 (as reported in 2018). About 1 000 of them report observations every day:
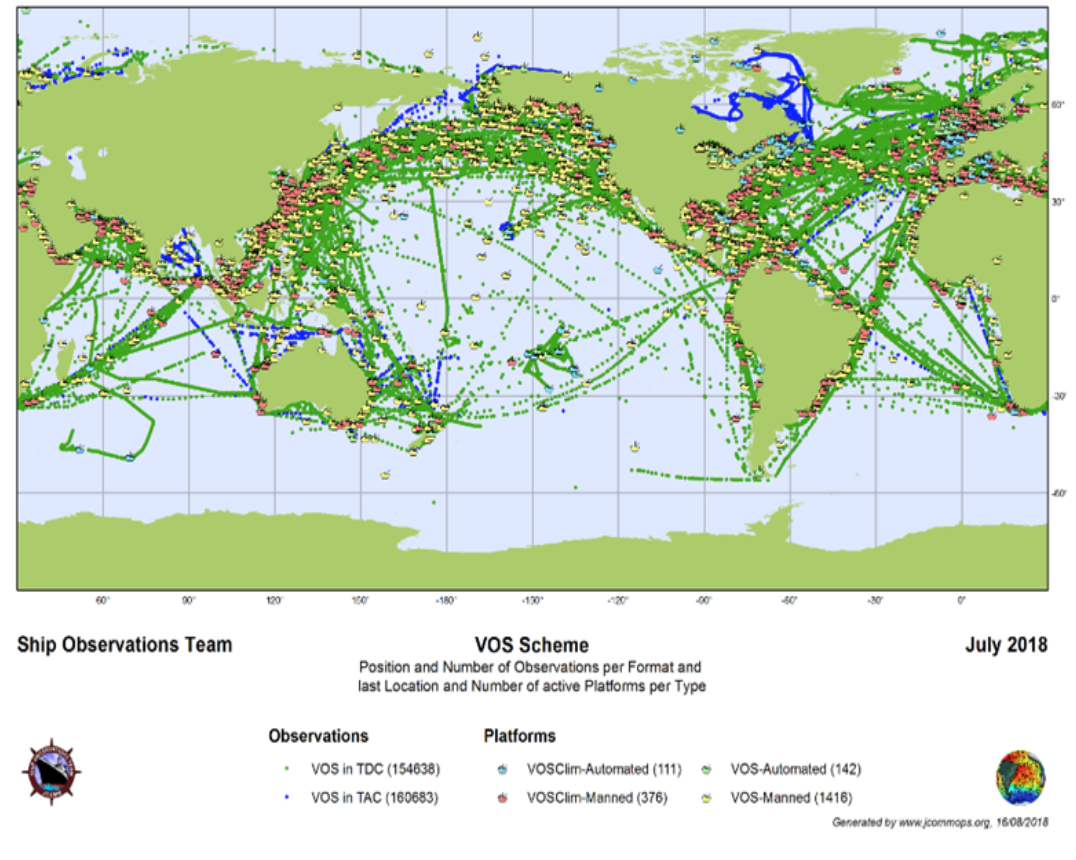
ship-station
Source: Jcommops
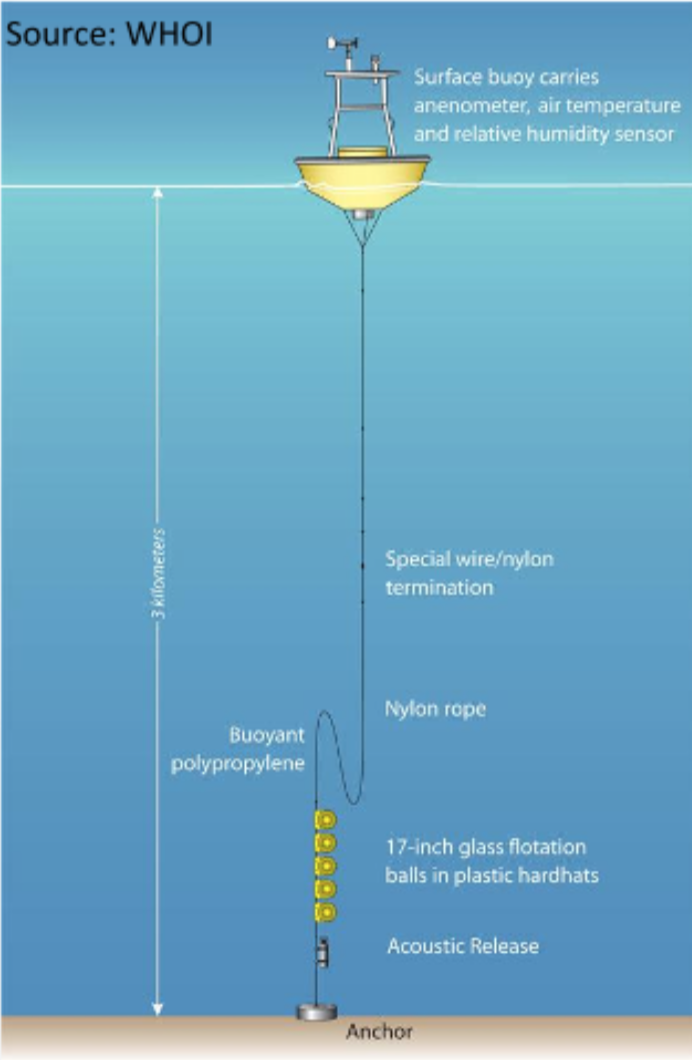
8.2.2.2 Buoys
Buoys are instruments which collect weather and ocean data within the world’s oceans. There are moored buoys (see figure below), which remain at the same location and drifting buoys move with the sea currents.
The operational drifting buoy programme comprised of about 1 200 drifting buoys provides over 27 000 sea surface temperature measurements per day. Half of the drifters also report sea level pressure providing about 14 000 reports per day (as reported in 2018).
For more information, see the official reference WMO descriptions.
8.2.2.3 Argo floats
Argo is an array of over 3600 profiling floats (as reported in 2018) distributed almost uniformly across the global oceans. They provide temperature and salinity profiles from the surface to a depth of 2000m. Argo provides one of the most accurate and comprehensive means of observing global ocean temperature and salinity changes.
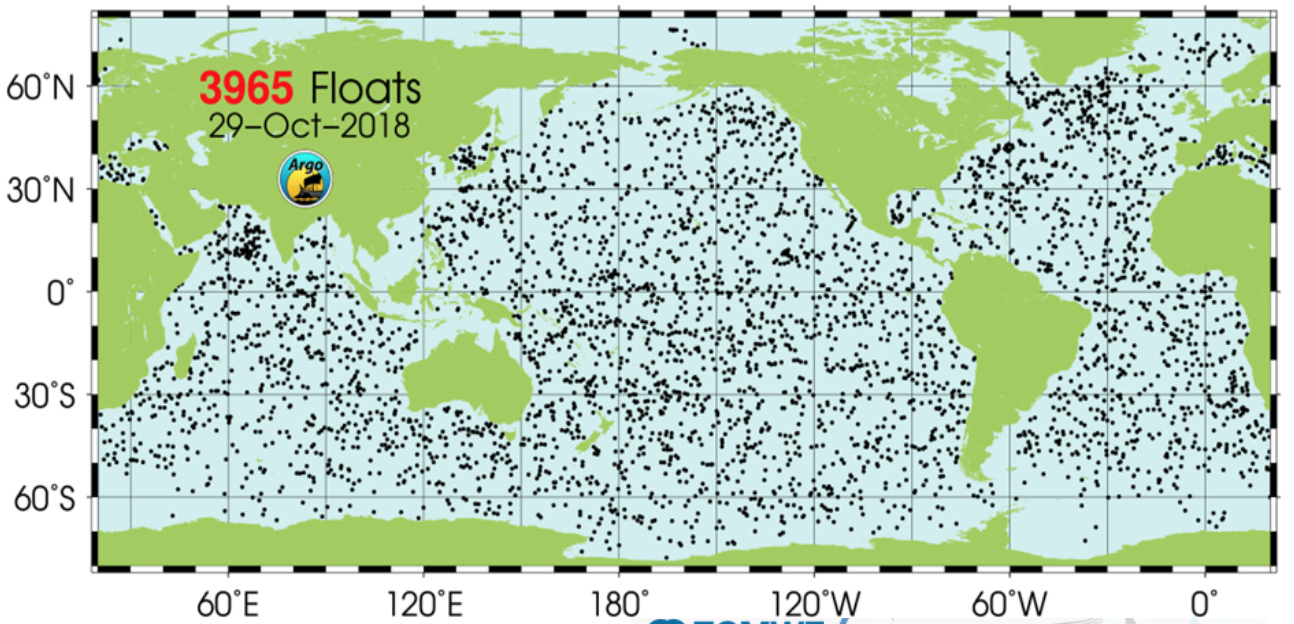
argo
8.2.2.4 Stationary platforms
Stationary platforms are mostly located in the vicinity of the coast, often located on oil or gas platforms. They are comparable to the measurement sites at land.
8.2.2.5 Pros and cons of measurements at sea
Advantages
- Important for weather and climate models because oceans cover a large part of the world.
- Direct measurements of the ECV’s
- Wide and uniform spatial distribution (in case of Argo floats)
Disadvantages
- No global coverage of buoys and ships. Ship data are mainly available on the main shipping routes. Limited coverage at high latitudes, especially in seasonally ice-covered regions.
- Ships and drifting buoys do not have a fixed location
- No long time series at fixed locations (Argo since 2000)
8.2.3 Radio- and dropsondes
A radiosonde is an instrument that is launched by a weather balloon and measures the properties of the surrounding air up to a maximum height of 30-35 km. It measures altitude, pressure, temperature, relative humidity, wind (both wind speed and wind direction) and geographical position (latitude/longitude) and transmits them by radio to a ground receiver. Radiosondes measuring ozone concentration are known as ozone sondes. See video.
Dropsondes are the same device but then dropped from an airplane and are usually used in special weather situations, for example in hurricanes. See video.
8.2.3.1 Radiosonde network
The global network consists of about 1,300 upper-air stations (2018). Over two thirds of the stations make observations at 00:00 UTC and 12:00 UTC. Between 100 and 200 stations make observations once per day. In ocean areas, radiosonde observations are taken by about 15 ships (2018), which mainly ply the North Atlantic, fitted with automated shipboard upper-air sounding facilities.
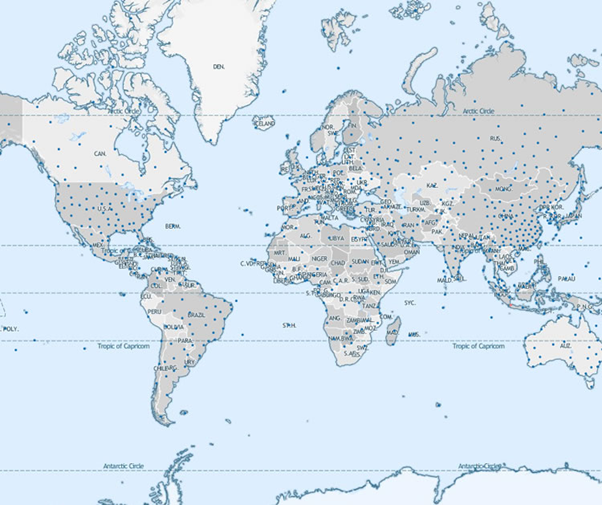
radiosonde-network
Source: WMO (GOS)
8.2.4 Aircraft measurements
In collaboration with ICAO (International Civil Aviation Organization) and commercial and other airlines, aircraft-based observations are received from over 3000 aircraft, providing reports of pressure, winds, temperature, humidity, turbulence and other parameters during flight.
The Aircraft Meteorological Data Relay (AMDAR) system makes high quality observations of winds and temperatures at cruising level as well as at selected levels in ascent and descent (see figure). The amount of data from aircraft has increased dramatically during recent years - from 78,000 observations per day in 2000 to more that 800,000 observations per day in 2017. Providing great potential for measurements in places where there is little or no radiosonde data, these systems are making a major contribution to the upper-air component of the GOS. (Source: WMO (GOS))
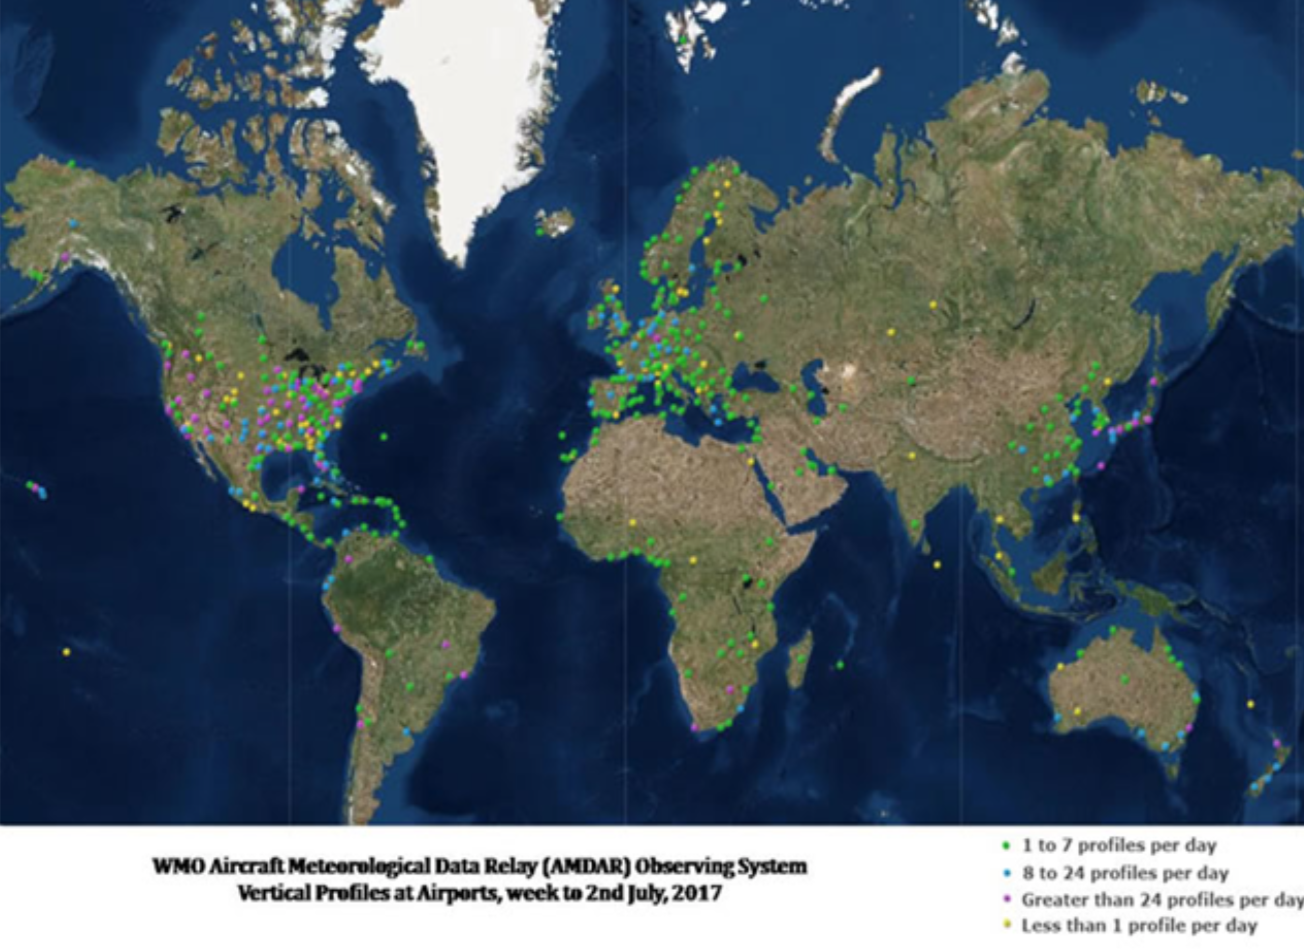
aircraft-measurements
8.2.4.1 Pros and cons of sondes and aircraft
Advantages
- Vertical profiles of the air.
- High quality direct observations.
- Increasing amount of data.
- Aircraft measurements also provide data from above the oceans.
Disadvantages
- No long time series
- No fixed location (sondes drift with the wind)
- No global coverage. Lower coverage in the southern hemisphere, on the ocean and the polar regions.
- Only 1 or 2 measurements per day
8.2.5 Radar
Weather radars have been used in the detection of precipitation rates since the 1950s. The first figure below shows and example of a rainfall radar image. In principle the method is based on sending out a radar pulse and measuring the return signal. The signal has to be translated into a precipitation rate with the help of in situ measurements (see second figure).


Dual polalized or doppler radars can measure wind and rainfall. They enable more accurate determination of precipitation types and sizes. This makes it easier to see whether the precipitation consists only of rain or also contains snow or hail (see video explanation).
Radar networks have been established around the world. A radar network database is maintained by the WMO and is important to assist with the international exchange of radar data and to protect radio-frequency spectrum allocation. (WMO (GOS):

radar-network
8.2.6 Lidar
Instead of using a radar pulse, Lidar (Light Detection And Ranging) uses laser light to study atmospheric properties from the ground up to the top of the atmosphere or from aircrafts to the ground. Such instruments have been used to study, among others, atmospheric gases, aerosols, clouds, wind and temperature.
Example of a Lidar image made from an aircraft. (Source: UCAR COMET):
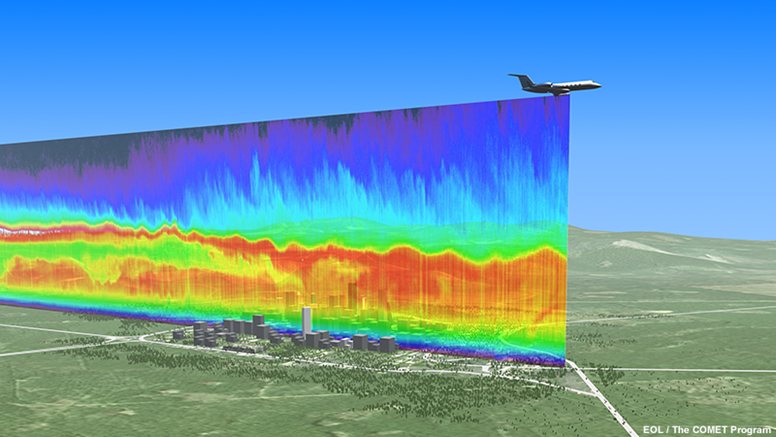
lidar-image
8.2.6.1 Pros and cons of radar and lidar images
Advantages:
- Higher spatial coverage than ground measurements
- High frequency measurements
- Data almost directly available
- Information about the upper air
Disadvantages
- Time series from about the end of the 90’s until present.
- The lidar and radar signal has to be translated into the desired climate variable. This introduces additional uncertainties and ground observations are needed to make this translation
- Systematic disturbances in the signal due to the atmosphere
- No global coverage. Lower coverage in the southern hemisphere, on the ocean and the polar regions.
8.2.7 Satellites
The first weather satellite was launched in 1960. Since then, many more satellites were launched providing a huge amount of atmospheric data.
Satellites are equipped with visible and infra-red imagers and sounders from which one can derive many meteorological parameters, like clouds, temperature, humidity, radiation, wind, wave height, wave patterns, sea currents, ice coverage, greenhouse gases and much more.
The first satellite mission designed to measure CO2 was the Interferometric Monitor for Greenhouse Gases (IMG) on board the ADEOS I satellite in 1996.
8.2.7.1 How do satellites measure CO2?
Solar short wave radiation is reflected by the earth and atmosphere and is measured by satellites. Also long wave radiation from the earth reaches the satellite.
Since different greenhouse gases absorb radiation at different wavelengths, the amount of radiation that reaches the satellite at different wavelengths says something about the composition of the atmosphere.
More information about satellites can be found on: Link.
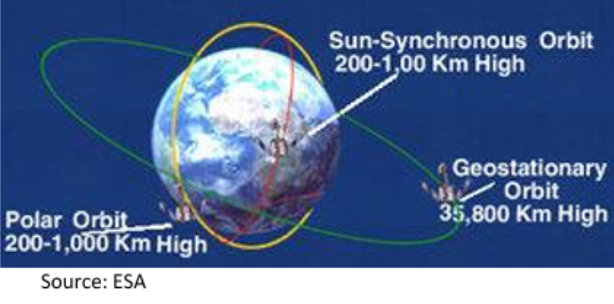
8.2.7.2 Types of satellites
- Geostationary satellite: earth-orbiting satellite placed at an altitude of around 35800 km directly over the equator, that revolves in the same direction the earth rotates (west to east), and therefore constantly observes the same path of the earth.
- Polar orbiting satellite: closely parallels the earth’s meridian lines, thus having a highly inclined orbit close to 90°. It passes over the north and south poles each round. As the earth rotates to the east beneath the satellite, each pass monitors and area to the west of the previous pass. These strips can be pieced together to produce a picture of a larger area.
Several over the polar-orbiting satellites are equipped with sounder instruments that can provide vertical profiles of temperature and humidity in the atmosphere in cloud-free areas. Geostationary satellites can be used to measure e.g. wind velocity in the tropics by tracking clouds and water vapour. Recent developments have made it possible to derive temperature and humidity information directly from satellite information.
The below panel is an example of a climate data set based on a polar orbiting satellite (here: total water vapor in a column). It covers the entire globe, including ocean, desert, and sparsely populated regions.
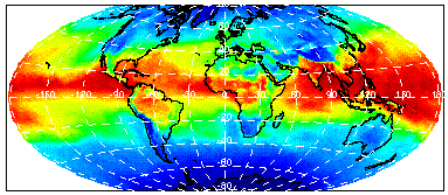
satellite-orbiting
The below panel is an example of a geostationary satellite (here: global radiation), covering only a part of the globe.
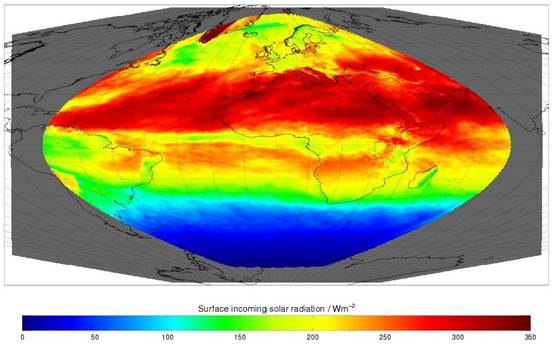
satellite-stationary
8.2.7.3 Pros and cons of satellite measurements
Advantages:
- High spatial coverage (data for regions without ground stations are available) and high spatial resolution
- Data almost directly available
Disadvantages:
- Time series from about the end of the 90’s until present.
- The satellite signal has to be translated into the desired climate variable. This introduces additional uncertainties and ground observations are needed to make this translation
- Systematic disturbances in the signal due to the atmosphere
8.2.8 Historical data records
The first daily time series start around 1850, but were still very scarce. From about 1950 on there was a much better coverage with weather stations. The first climate data were recorded manually, but many have been digitised by now.
Records of the climate before the start of the regular measurement around 1850 are scarce. Therefore scientists have used other types of information to estimate climate variables further back in time:
- Old shipping reports mentioning the weather at sea
- Corals can be used to estimate oceanic temperature and sea-level changes
- Tree-rings and ice-cores can be used to infer changes in temperature and precipitation.
8.2.8.1 Shipping reports
Millions of (mainly wind) observations were made from ships in the late 19th and early 20th centuries or even earlier. Until recently they were only available from paper logbooks, but gradually they are being digitized. Some of these have been included in the latest assessments of climate, like the Intergovernmental Panel on Climate Change (IPCC) report. However, many more logbooks have yet to be included.
Also other written reports, like farmers’ logs, travelers’ diaries and newspaper accounts can tell us something about past climates.
8.2.8.2 Tree rings
Trees can live for hundreds—and sometimes even thousands—of years. Over this long lifetime, a tree can experience a variety of environmental conditions: wet years, dry years, cold years, hot years, early frosts, forest fires and more.
Tree rings can tell us something about the conditions the tree grew in. For example, rings usually grow wider in warm, wet years and they are thinner in years when it is cold and dry. If the tree has experienced stressful conditions, such as a drought, the tree might hardly grow at all in those years.
Scientists can compare modern trees with local measurements of temperature and precipitation from the nearest weather station. Very old trees can give information about the climate before regular weather observations started.
8.2.8.3 Corals
The way corals can tell us about past climates is comparable to tree rings. Like their land-based counterparts, corals add seasonal layers, which appear as bands in their hard calcium-carbonate shells. Corals respond to small changes in temperature, rainfall, and water clarity in a matter of months, making them a uniquely sensitive climate record.
8.2.8.4 Ice cores
In the polar regions and high in the mountains ice has accumulated from snowfall over many millennia. Scientists drill out ice cores from these ice sheets or glaciers. The ice encloses small bubbles of air that contain a sample of the atmosphere. From these it is possible to measure directly the past concentration of gases (including carbon dioxide and methane) in the atmosphere.
Most ice core records come from Antarctica and Greenland, and the longest ice cores extend to 3km in depth. The oldest continuous ice core records to date extend 123,000 years in Greenland and 800,000 years in Antarctica.
8.2.8.5 Pros and cons of historical data
Advantages: long time series, only way to obtain climate information of the past and test climate models
Disadvantages: not as precise as direct instrumental measures, very few proxy datasets.
8.2.9 Global Networks
The World Meteorological Organisation (WMO) facilitates the establishment, maintenance and continuing expansion of a global observation network, the activities of which are coordinated within the Global Observing System (GOS) of the WMO World Weather Watch (WWW).
The WMO co-sponsored Global Climate Observing System (GCOS) and Global Ocean Observing System (GOOS) also play a major role in improving the collection of required data for the development of climate forecasts and climate change detection.
The WMO Integrated Global Observing System (WIGOS) acts as its umbrella for these networks, using the WMO Information System (WIS) to connect together all regions for data exchange, management and processing (source text and figure: WMO (GOS3).
8.3 Describe instrument and measurement uncertainty and the factors that are used to assess systematic and random errors, and the propagation of errors
There are many challenges which have to be tackled when observing the climate, including (Met Office link for more information):
- Incomplete geographical coverage of measurements.
- Gaps in historical climate records.
- The need to use some indirect measurements of climate change.
- Biases and errors in data.
- Varying standards for taking observations.
- Collecting information to assist interpretation of climate records.
- Calculating changes in climate.
- Estimating uncertainties in climate observations.
8.3.1 Measurement guidelines
GCOS (the Global Climate Observing System) issued ten principles climate observation networks should meet to assure data quality and longevity of records. They can be read at link to WMO
Some examples:
- A suitable period of overlap for new and old observing systems is required
- The details and history of local conditions, instruments, operating procedures, data processing algorithms and other factors pertinent to interpreting data (i.e. metadata) should be documented and treated with the same care as the data themselves
- The quality and homogeneity of data should be regularly assessed as a part of routine operations
- Operation of historically-uninterrupted stations and observing systems should be maintained
- High priority for additional observations should be focussed on data-poor regions, poorly-observed parameters and regions sensitive to change
8.3.2 Data homogenisation
Abrupt or gradual changes in data series can develop through:
- Changes in the instrument
- Replacement of the instrument to another location
- Changes in the surrounding of the station, for example the growth of trees or the expansion of cities in the neighbourhood.
The inhomogenities in the climate data series can become so large that without corrections the series cannot be used for climate research any longer. Therefore, methods to correct for these inhomogenities are necessary. After homogenisation, historical values are again comparable with recent values.
Homogenisation of time series is mostly done in a statistical way by calculating corrections from mutual comparisons of stations.
8.3.2.1 Data comparison
One way to study the influence of changes in measurement technique is by making simultaneous measurements with historical and current instruments next to each other.
8.3.2.2 Climate data records
A Climate Data Record (CDR) is “a time series of measurements of sufficient length, consistency and continuity to determine climate variability and change.”
It can be made by combining data from different observational resources, like satellite data, ground observations and airsondes, hereby profiting from all the advantages of the different measurement techniques
Gaps in observational series can be filled with help of climate models. In their turn, CDR’s can also be used as input for climate (reanalysis) models.