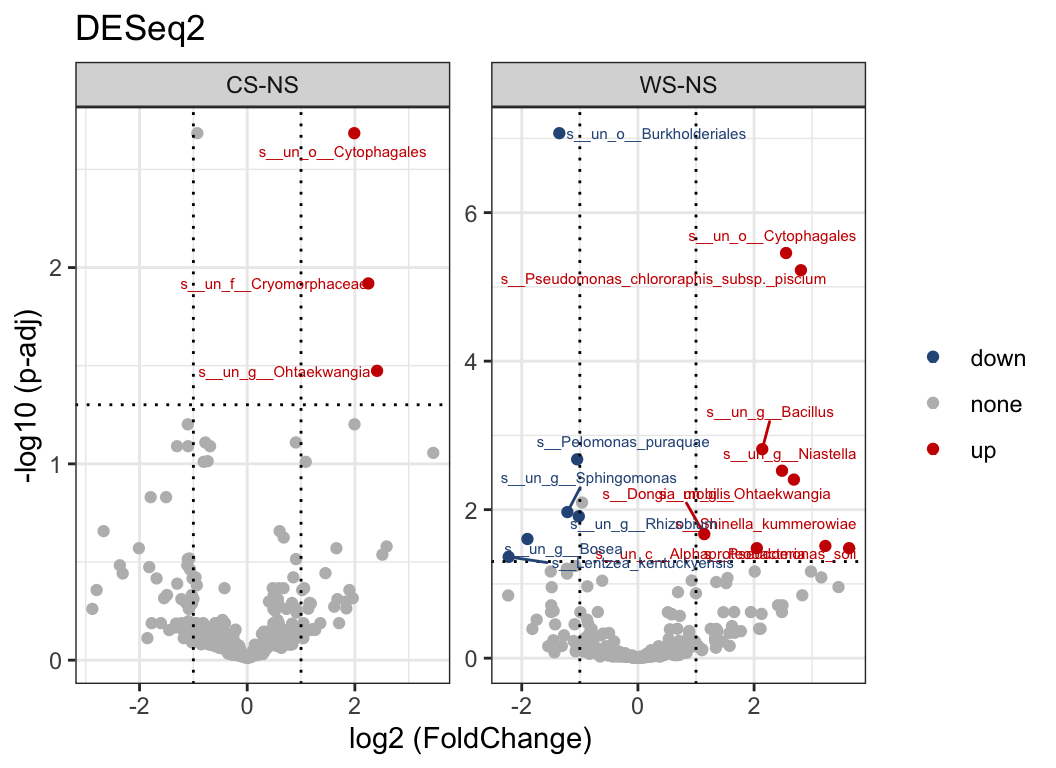
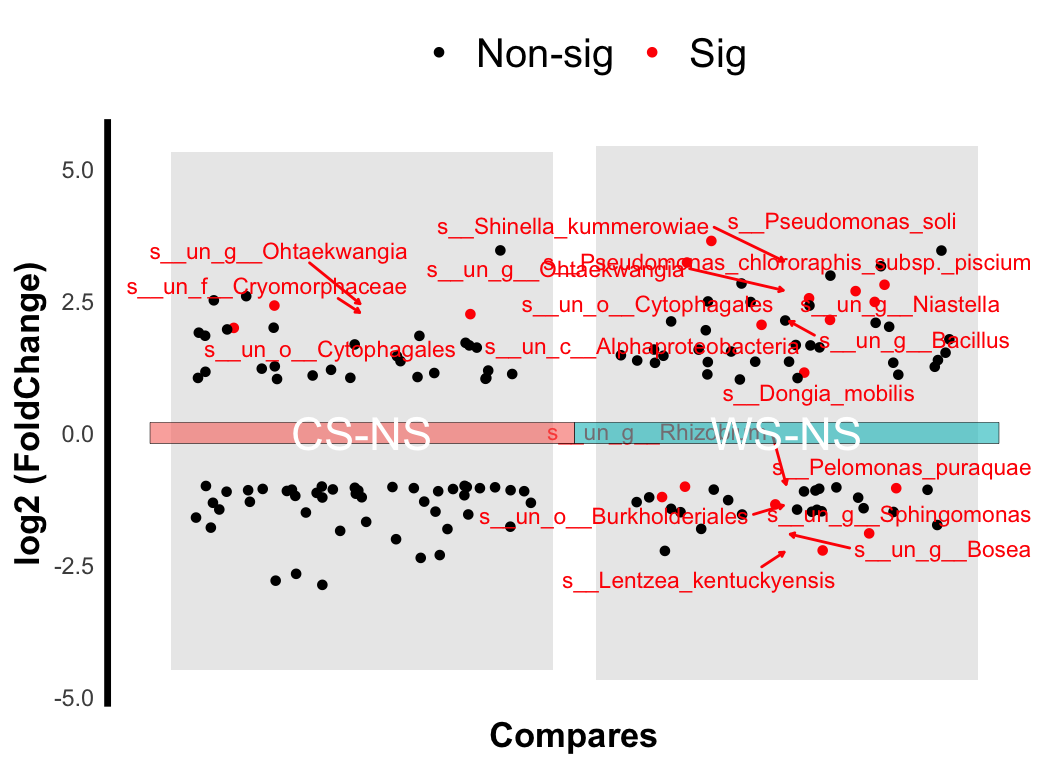
There are also lots of statistic methods for differential analysis: ALDEX, ANCOM2, t.test, wilcox.test… or deseq2, limma, edger (commonly used in transcriptome).
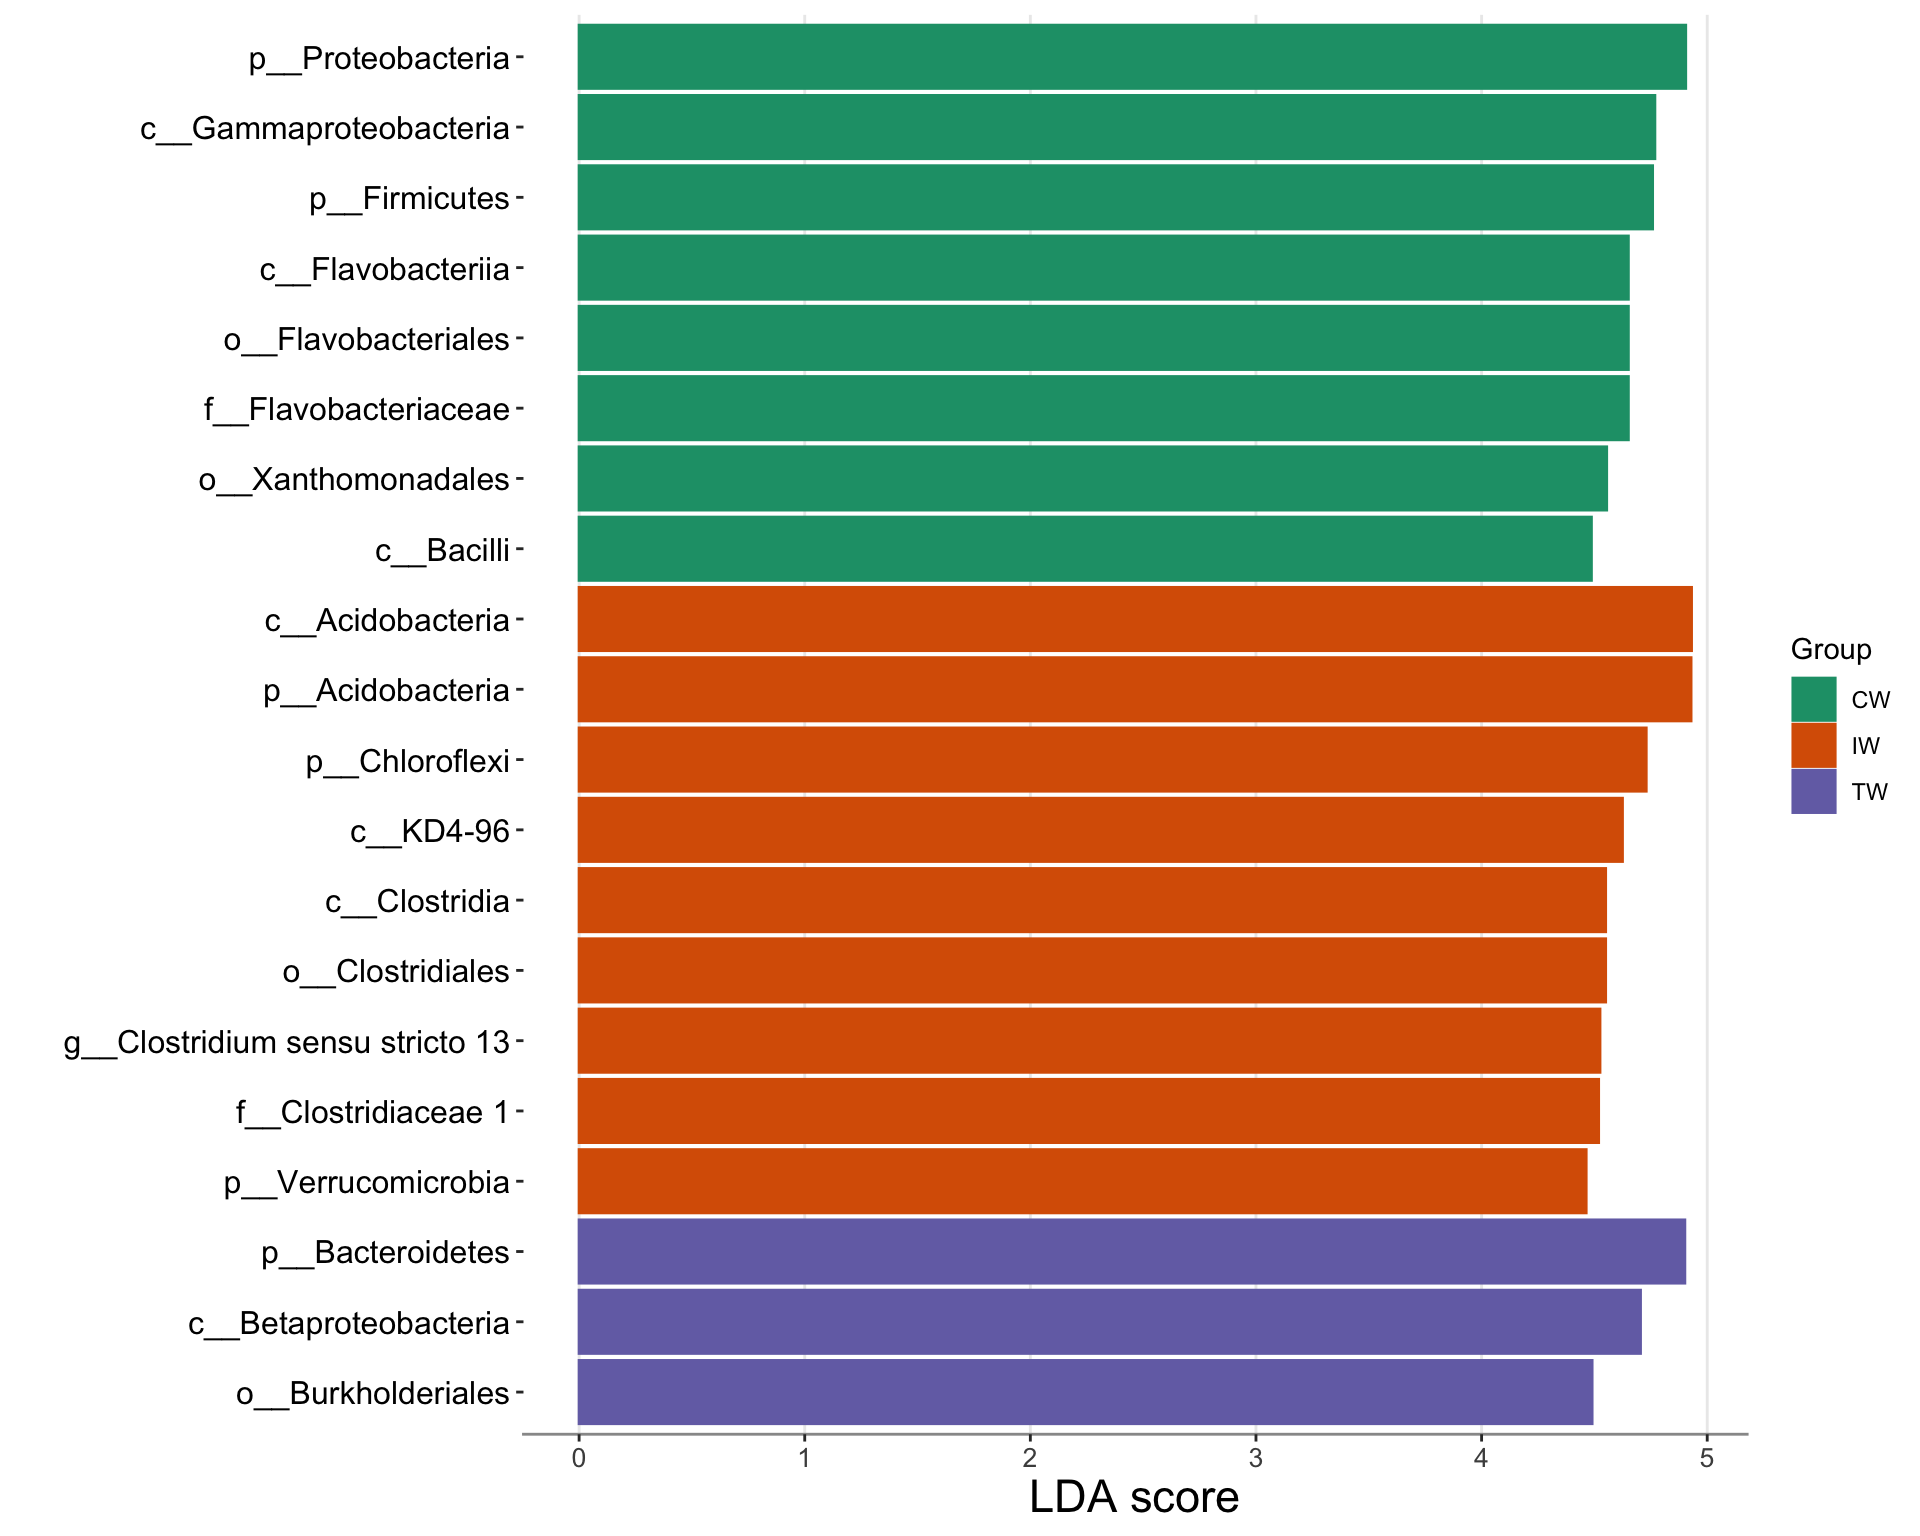
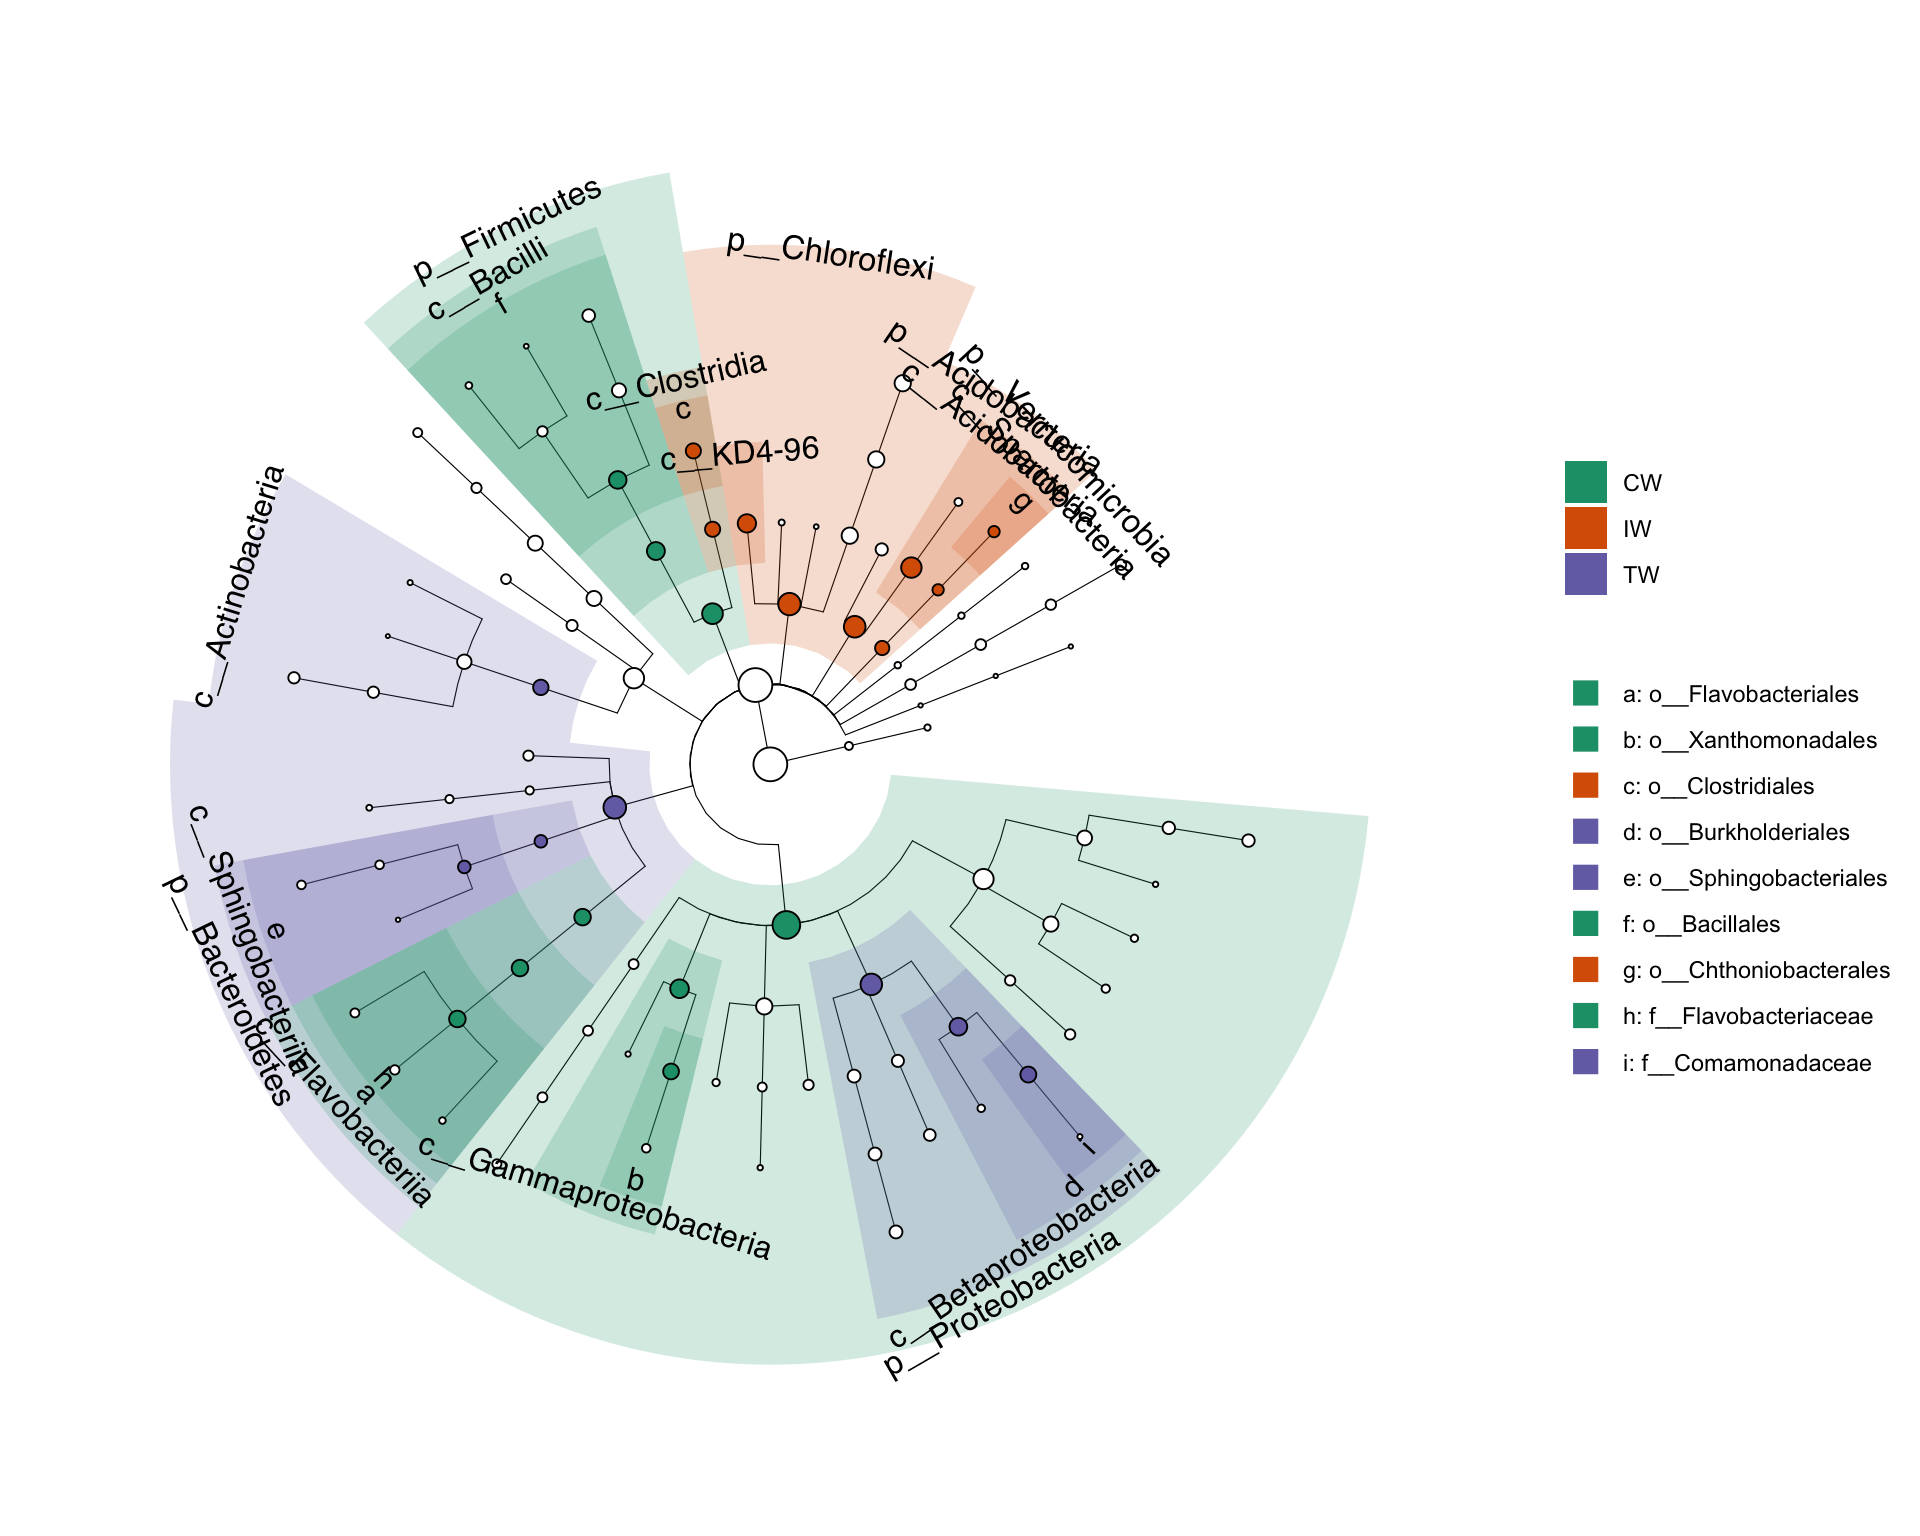
LEfSe (Linear discriminant analysis Effect Size) is a computational tool used for identifying biomarkers that differentially characterize the microbial communities associated with different sample classes.
It employs a combination of statistical tests, including the Kruskal-Wallis sum-rank test and linear discriminant analysis (LDA), to determine features (e.g., taxa, genes) that show significant differences in abundance between classes while also considering the effect size of these differences. LEfSe then ranks these features based on their effect size, allowing researchers to identify the most biologically relevant biomarkers associated with different sample groups.
This approach is particularly useful in microbiome research for identifying taxa or functional genes that are significantly associated with specific experimental conditions or clinical outcomes.
Figure 5.5: Cladogram plot of taxa with significant difference
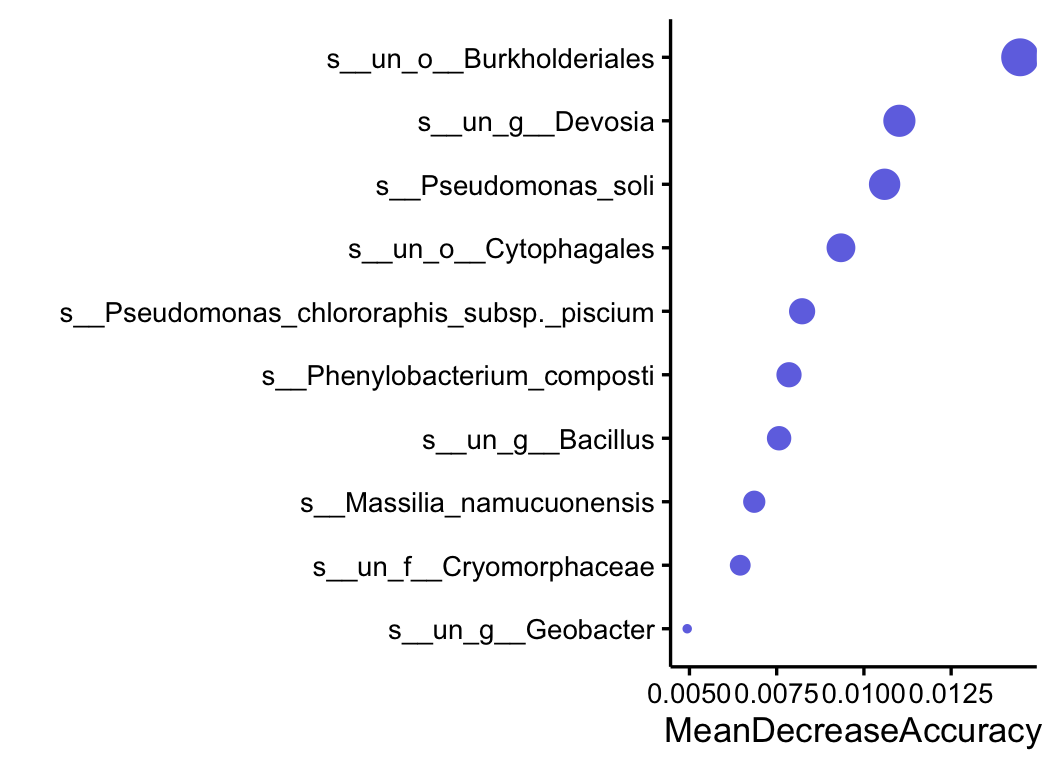
5.2 RandomForest
RandomForest is a machine learning algorithm that can be applied not only for predictive modeling tasks but also for feature selection and differential analysis. It works by constructing multiple decision trees during training and outputting the mode of the classes (classification) or the mean prediction (regression) of the individual trees. In the context of differential analysis,
RandomForest can be used to identify features (e.g., variables, genes, or taxa) that are most informative for classifying samples into different groups. By analyzing the importance scores assigned to each feature by the algorithm, researchers can identify the subset of features that contribute the most to the classification outcome.
This makes RandomForest a versatile tool for feature selection in various domains, including bioinformatics, where it can help in identifying key biomarkers or predictors associated with different experimental conditions or phenotypes.