15.3 Knitting with parameters
There are three ways in which a parameterized report can be knitted:
Using the
Knitbutton within RStudio.rmarkdown::render()with theparamsargument.Using an interactive user interface to input parameter values.
15.3.2 Knit with custom parameters
Even if your document has the params field in the YAML metadata, you can actually override it by providing a custom list of parameter values to the function rmarkdown::render(). For example:
rmarkdown::render("MyDocument.Rmd", params = list(
  year = 2017,
  region = "Asia",
  printcode = FALSE,
  file = "file2.csv"
))
We do not have to explicitly state all parameters in the params argument. Any parameters not specified will default to the values specified in the YAML metadata. For example, this will only override the region parameter:
rmarkdown::render("MyDocument.Rmd", params = list(
  region = "Asia"
))
You may want to integrate these changes into a function. Such a function could also be used to create an output file with a different filename for each of the different combination of parameters. In the following example, a new file Report-region-year.pdf is created for each set of parameters:
render_report = function(region, year) {
  rmarkdown::render(
    "MyDocument.Rmd", params = list(
      region = region,
      year = year
    ),
    output_file = paste0("Report-", region, "-", year, ".pdf")
  )
}
15.3.3 The interactive user interface
We can use a graphical user interface (GUI) based on Shiny to interactively input the parameters of a report. The user interface can be called by either rmarkdown::render("MyDocument.Rmd", params = "ask") or clicking the drop-down menu behind the Knit button and choosing Knit with Parameters in RStudio. Figure 15.1 shows the GUI of rmarkdown asking for inputting parameters.
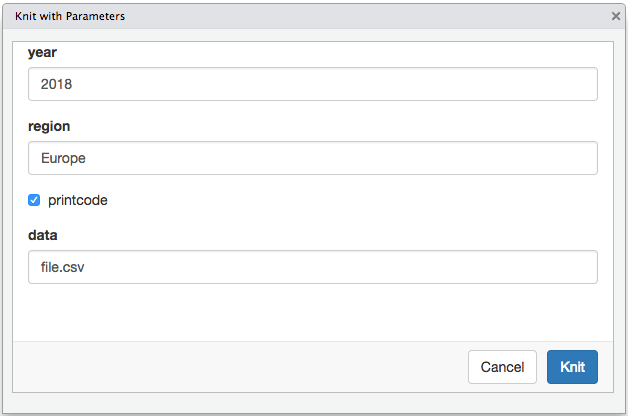
FIGURE 15.1: Input parameter values interactively for parameterized reports.
The input controls for different types of parameters can be customized by specifying additional sub-items within the parameter specification in YAML. For example, sliders, check boxes, and text input boxes can all be used for input controls.
In addition, we can also specify constraints of the values allowed in each parameter. For example, we may only want our model to be run for years between 2010 and 2018. This is particularly beneficial if you would like other users to interact with the report, as it prevents users from attempting to run reports outside of the designed limits.
Adapting our above example to include some settings:
---
title: My Document
output: html_document
params:
  year:
    label: "Year"
    value: 2017
    input: slider
    min: 2010
    max: 2018
    step: 1
    sep: ""
  region:
    label: "Region:"
    value: Europe
    input: select
    choices: [North America, Europe, Asia, Africa]
  printcode:
    label: "Display Code:"
    value: TRUE
  data:
    label: "Input dataset:"
    value: results.csv
    input: file
---
This results in the user interface for the parameters as shown in Figure 15.2.
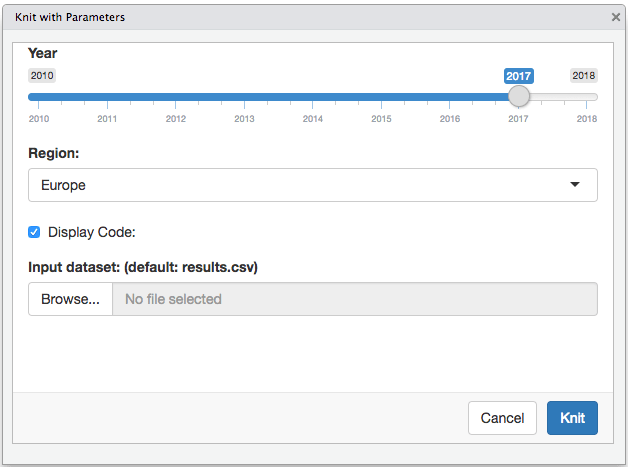
FIGURE 15.2: Custom controls for parameters.
The type of Shiny control used is controlled by the input field. Table 15.1 shows the input types currently supported (see the help page for the associated Shiny function for additional attributes that can be specified to customize the input, e.g., ?shiny::checkboxInput).
| Input Type | Shiny Function |
|---|---|
| checkbox | checkboxInput |
| numeric | numericInput |
| slider | sliderInput |
| date | dateInput |
| text | textInput |
| file | fileInput |
| radio | radioButtons |
| select | selectInput |
| password | passwordInput |