6 Statement of Reasonable Projection
Following the construction of the Loan Calculator in R Shiny, it was decided to develop a calculator to generate figures and charts related to a Statement of Reasonable Projection (SORP). A SORP is a statement that is sent annually to members of a defined contribution pension scheme. It contains an estimate of the value of their pension fund upon retirement.
The calculator allows a user to enter the details of their plan and returns the value of their fund at a specified retirement age. The SORP Calculator outputs the periodic payment received, given that the fund is used to purchase an annuity. Additionally, a graph showing the fund value over time, and a table displaying the time progression of the fund is generated.
The SORP is a more involved actuarial task than a Loan Calculator, and benefits heavily from being implemented in R. A key reason for this is that the SORP is based on various assumptions relating to future contributions, investment returns, and interest rates. These affect the cost of buying an annuity on retirement. The assumptions that are outlined in the Actuarial Standards of Practice (ASP) guidance note [27] were adhered as fully as possible to in the design of the SORP Calculator.2
A central goal in building the SORP Calculator was to ensure it was easy to use, navigate and comprehend. This was regarded as essential as a traditional Statement of Reasonable Projection is meant to be used as an understandable aid by the average person to understand the status of their pension fund. Ideally, anybody would be able to use the calculator and understand its output without guidance from a more knowledgeable party. The decision to develop the app using R Shiny contributed to the SORP Calculator’s ease-of-use. R Shiny’s plentiful display options gives the app great flexibility, with the outputs being communicated via text, a chart and a table. Additionally, the ShinyWidgets [7] package’s capacity for input features such as drop-down menus and sliders allow for the parameters to be altered without issue. R Shiny’s ability to facilitate elegant and intuitive design, as well as its usability, make it a strong choice for performing actuarial tasks in the pensions industry.
shinydashboard [5] facilitates a clear and concise layout for the app. A “sidebar” layout is used both on this page and many others, whereby a side panel of inputs is used to control the outputs displayed in the main panel. This side panel usually defaults to a maroon coloured, borderless panel - however, using shinyJS [6], CSS code was utilised to create a panel with a white background and blue border, similar to the other boxes present on the page. The height of this side panel was also fixed to a set number of pixels, and a scroll-bar added in case of overflow, to maintain consistancy across the page’s UI.
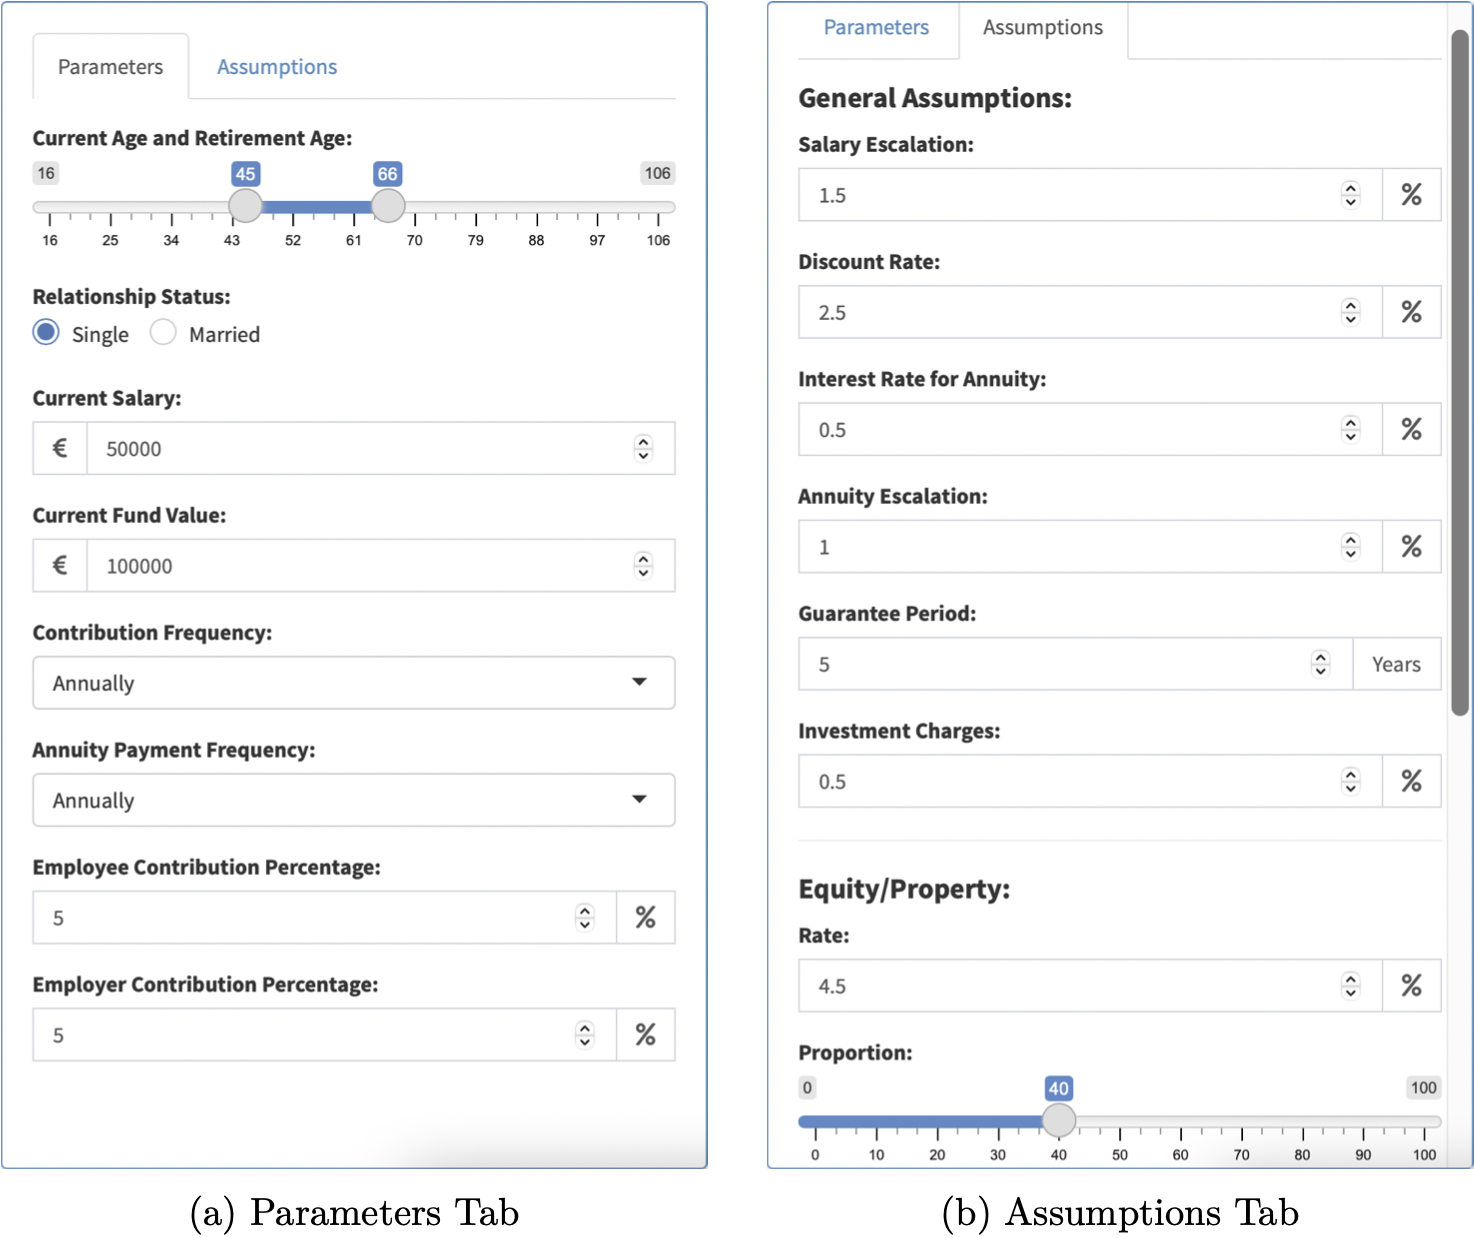
In this sidebar panel, a tabsetPanel is utilised to allow for multiple menus of inputs - there are two tabs labelled “Parameters” and “Assumptions” (Figure 6.1). The SORP Calculator’s inputs were separated in this way for accessibility; rarely will the average user need to change any of the inputs that relate to the underlying assumptions. Having too many inputs can lead to confusion, so keeping these inputs in a separate location avoids over-complicating the page.

Figure 6.1: Inputs
The “Parameters” tab (Figure 6.1a) is where the inputs specific to the individual are entered. The “Assumptions” tab (Figure 6.1b) is where any inputs relating to the assumptions outlined in the ASP are kept. These inputs are automatically set to the values quoted in the ASP, but can be changed so as to facilitate professional judgement by actuaries. In particular worth noting, the breakdown of assets invested in to calculate the projection of the pension pot is controlled by three sliders which can be adjusted by the user. However, these sliders are programmed so that the total proportion never deviates from 100%. The “Reset to Default” button enables the user to reset these inputs to the ASP values. The dynamic nature of the page means that when any input is changed, the outputs will update automatically.
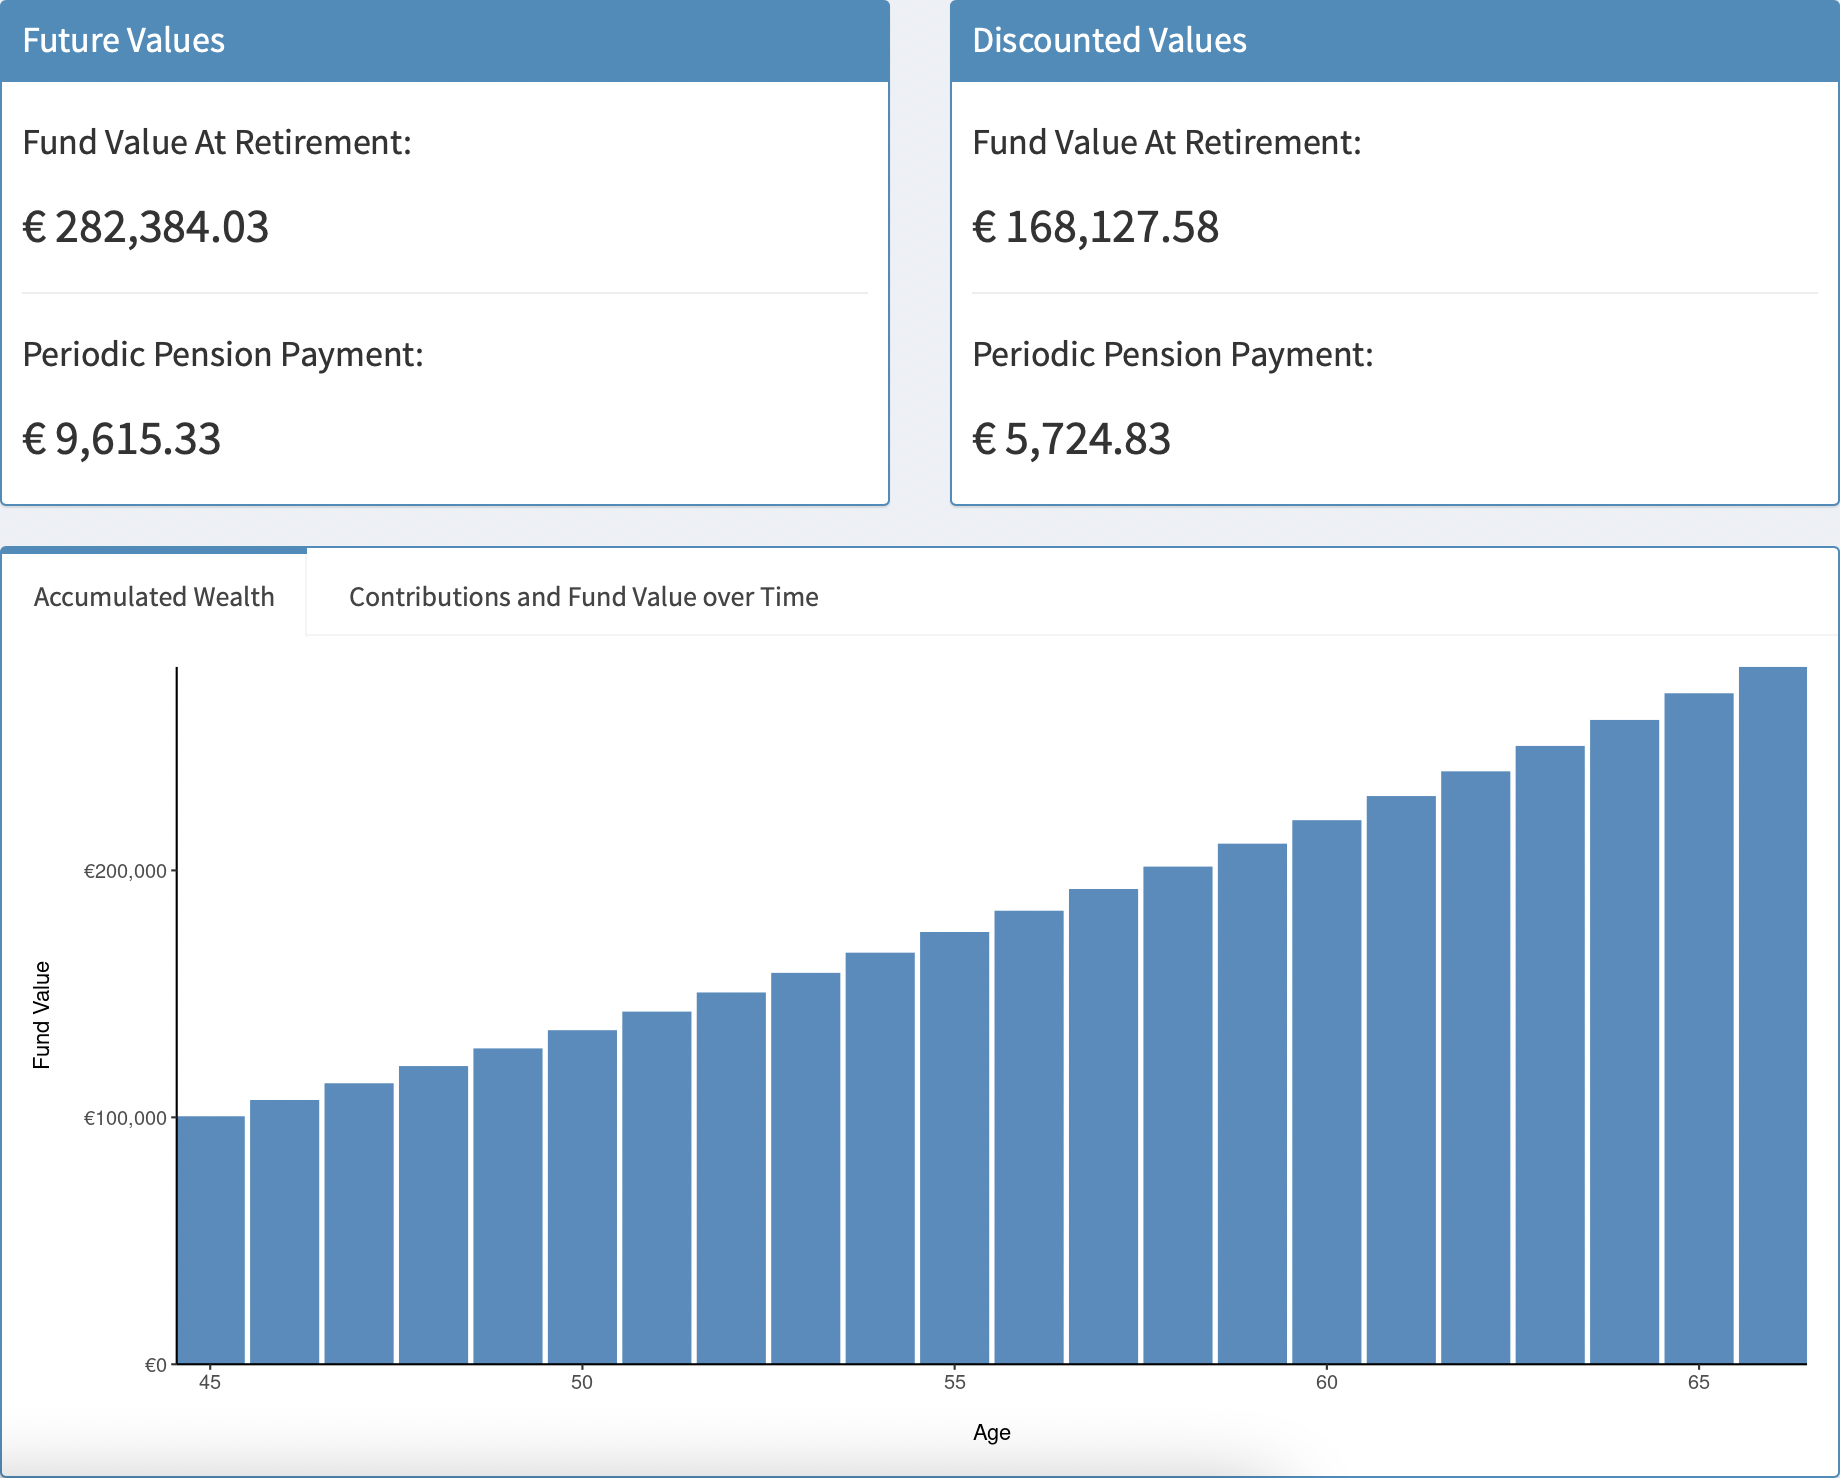
The most important outputs of the SORP Calculator are the fund value at retirement and the periodic payment value from the annuity purchased. These figures are displayed prominently in the main panel as both future and present values. Underneath, a tabBox is shown. The first tabPanel displays a bar chart showing the accumulation of wealth within the pension pot as more and more contributions are made (Figure 6.2).

Figure 6.2: Accumalated Wealth
The second tabPanel contains a record of the fund value after each contribution has been made (Figure 6.3). The breakdown of contributions by the employer and employee, along with the interest accrued on the fund in the period, is also displayed. This table is once again generated using the DT package [8] and is configured in a similar style to the Loan Calculator’s Schedule (Figure 5.2).

Figure 6.3: Contributions and Fund Value over Time
This SORP model is a strong example of a task which leverages the benefits of R. Actuaries in the pensions industry often perform such tasks in Excel as they are more familiar with the software. If one were to create this model in Excel, it would have to be done from first principles. Such time-consuming and complex actuarial calculations can be performed using the annuity functions in the LifeContingencies R package [22]. For instance, using this package, the value of a joint life annuity can be computed with only a couple of lines of R code - this would require an entire worksheet in Excel. Developing a SORP calculator using R and R Shiny leads to more efficient calculations and a more effective presentation of results.