5 Loan Calculator
The first section of the R Shiny app that was built was a Loan Calculator. The purpose of this Loan Calculator is that, given the details of any particular loan, it will calculate the repayment per period. The app will also output a loan schedule showing the breakdown of each individual repayment and two graphs: one displaying the balance remaining on the loan over time; the other showing the interest versus capital breakdown per repayment.
The Loan Calculator was selected to create first as it is a relatively simple task both from a mathematical and programming perspective. While a Loan Calculator can be also created with relative ease in other programs (such as Excel), this calculator was built as a proof-of-concept to ascertain the viability of building other, more complex, actuarial tools in R Shiny. A great understanding of the various R packages that would be used for later endeavours would be also be developed from creating a Loan Calculator.
For the user interface, it was decided that displaying all of the information simultaneously would be the best approach. Due to the limited nature of the Loan Calculator’s output, the functionality of the page is not compromised by of this approach, and in fact this makes the page easier to navigate for the user. The page is dynamic due to the use of R Shiny’s reactive function. The app takes in the details of the loan and the outputs are updated instantaneously.
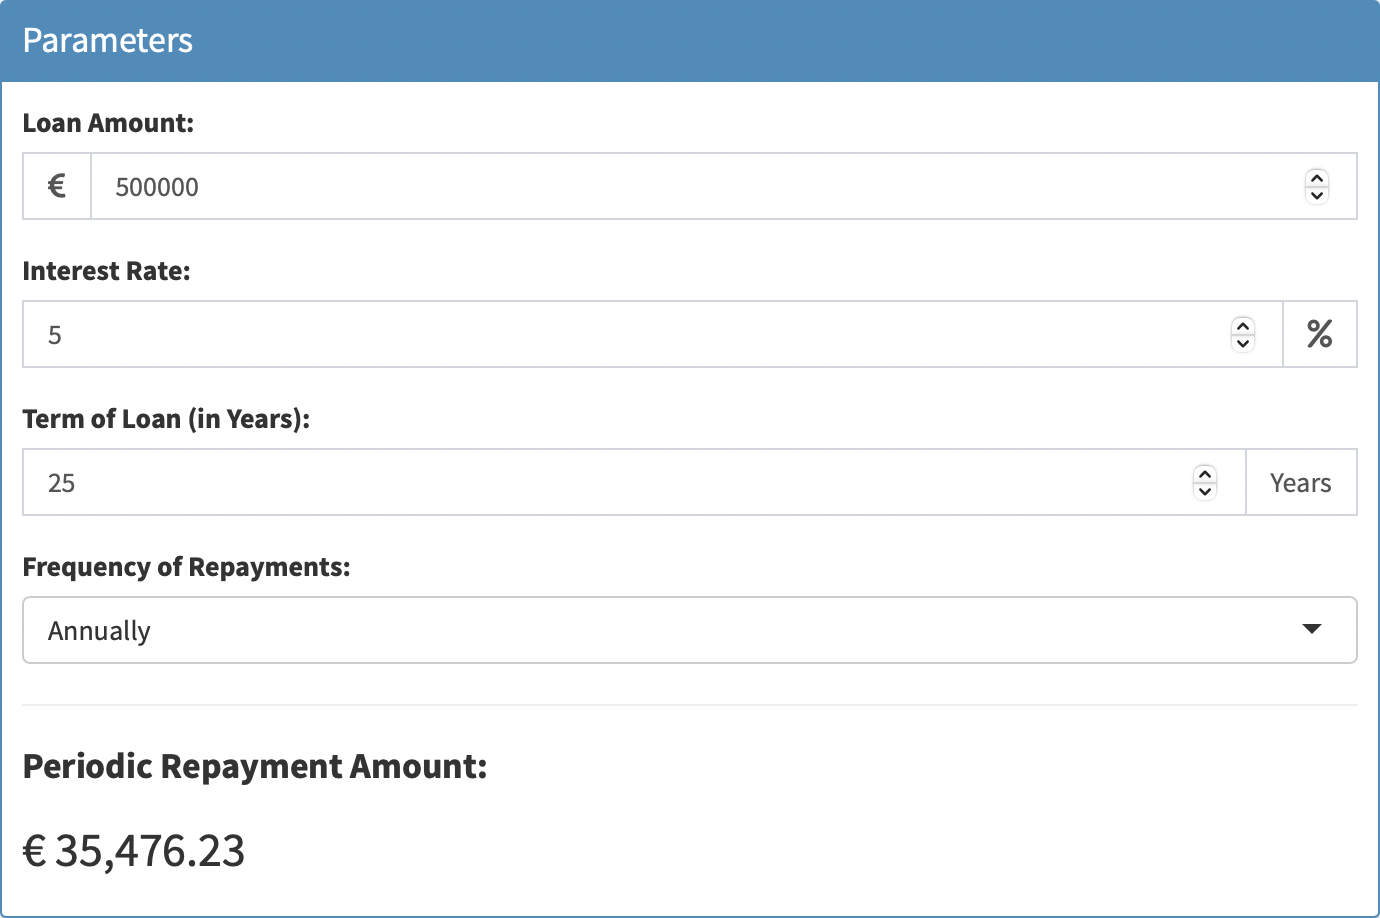
Figure 5.1: Parameters
The “Parameters” section (Figure 5.1) is where the user inputs the details of a loan. For the calculator to work, the user needs to input the loan amount, the interest rate, the term of the loan, and the frequency of repayments.
Once this information is entered by the user, the “Periodic Repayment Amount” will be displayed underneath the inputs. This decision was made as the periodic repayment amount is arguably the most important piece of information generated from the calculator. It is imperative that this figure be highlighted to the end user.
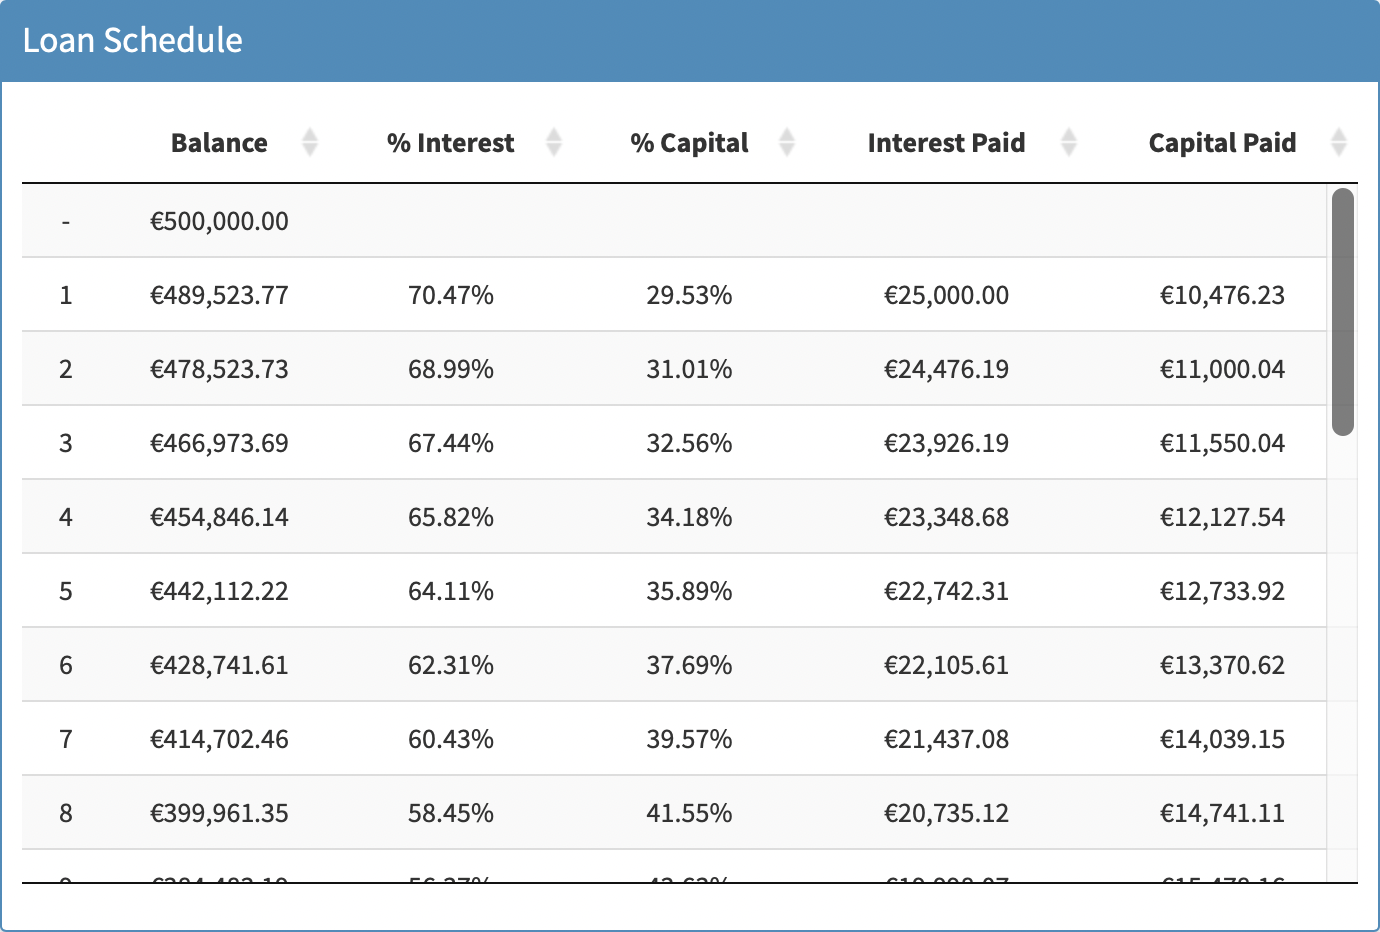
Figure 5.2: Loan Schedule
Next, a loan schedule (Figure 5.2) is generated. Usability was key in the design, as an information-dense loan schedule could end up being cumbersome and cluttered for the user to navigate. Therefore, a scrollable table was created using the DT package [8]. The table’s header remains visable when scrolling to later repayments, so as to avoid confusion as to which column is which. For each individual repayment, this table shows: the remaining balance, the interest charged and the capital repaid. The percentage breakdown of interest and capital per repayment is also on display.
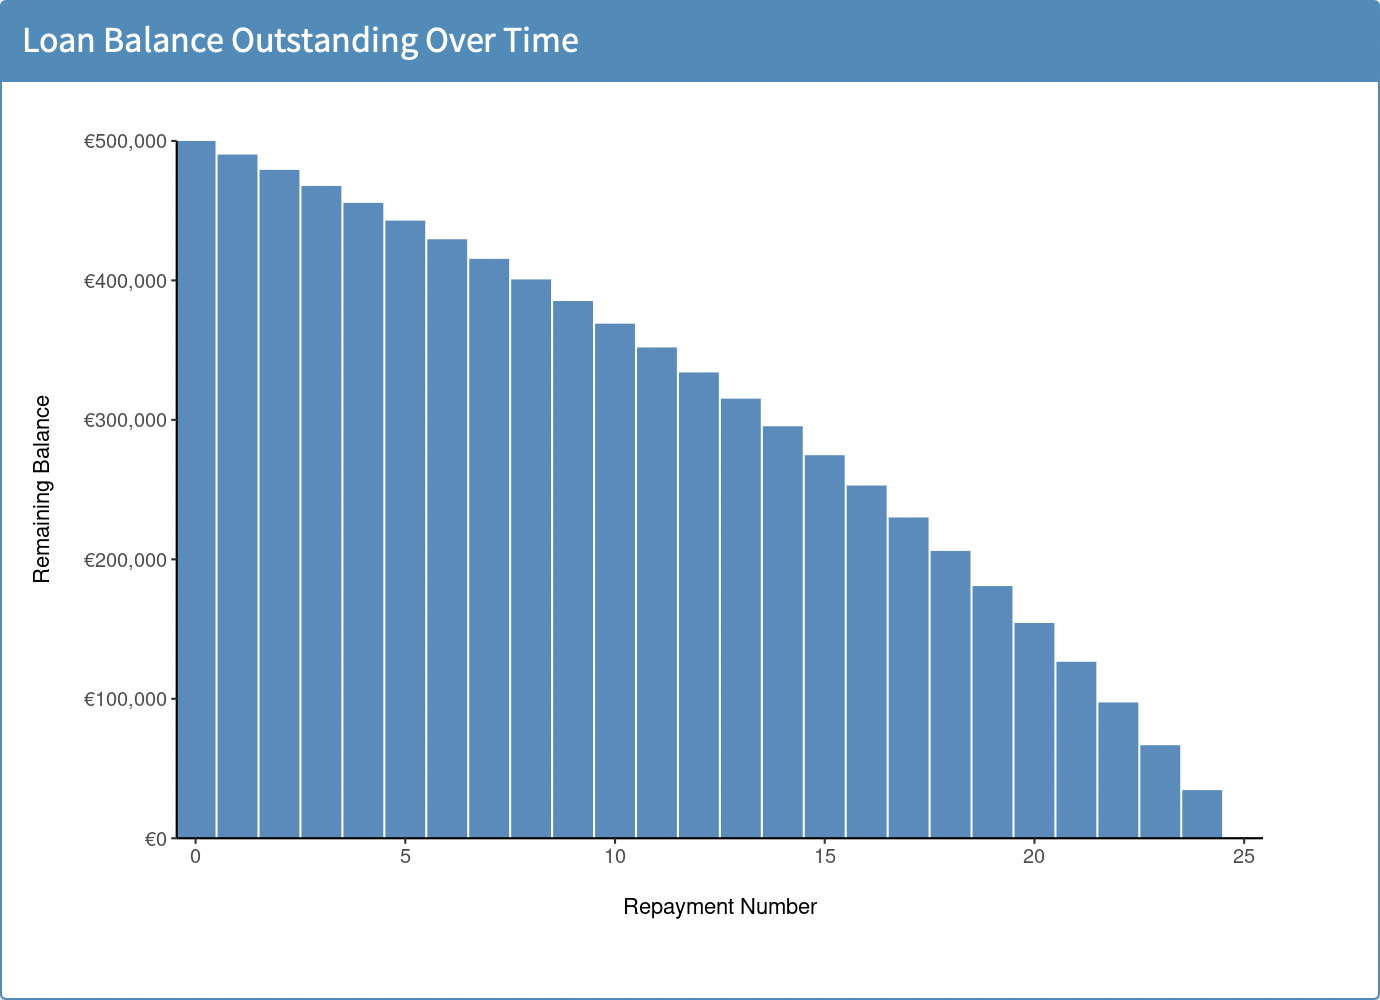
Figure 5.3: Loan Balance Outstanding Over Time
Finally, two graphs are presented: one showing the balance of the loan reducing over time (Figure 5.3), and the other displaying the progression in the breakdown of interest vs capital in each repayment (Figure 5.4). These two graphs were created using ggplot2 from the Tidyverse package [9], and were included to give the user a clear visual of the impact of interest on the total cost of the loan. Naturally, any user of this calculator would wish to see how their balance wittles away over the course of the loan. However, the inclusion of the interest vs capital graph highlights the impact that interest rates have on borrowings, and to a lay-person using this application, the costs of borrowing becomes immediately clear.
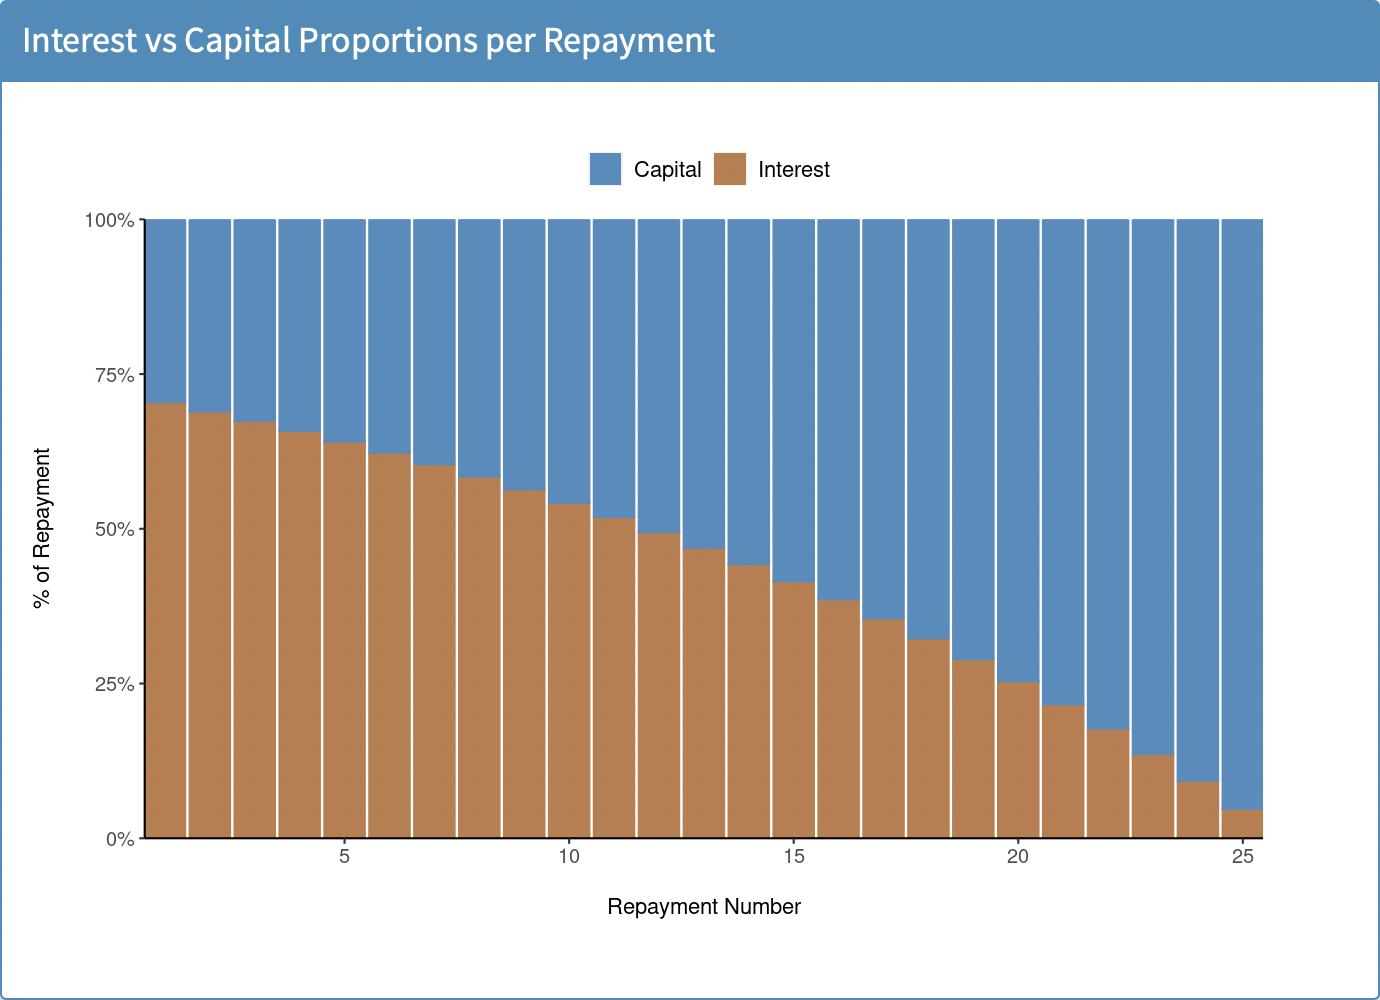
Figure 5.4: Interest vs Capital Proportions per Payment