9 SORP Calculator and Drawdown Simulation
Once both the SORP Calculator and the Drawdown Simulator were built, it became apparent that the logical next step should be to create a combination of the two. For anybody using the application, it would only be natural to try and compare outcomes and data when deciding between purchasing an annuity with their retirement pot, or drawing down their pension fund.
Both the SORP Calculator and Drawdown Simulator were designed with the ability to replicate tasks in mind - both the core back-end functions that generate the data, as well as all of the outputs and visualisations were coded as functions so that they could be called from anywhere in the app rather than repeating blocks of code unnecessarily. This ability was leaned on heavily in the creation of the combined tool.
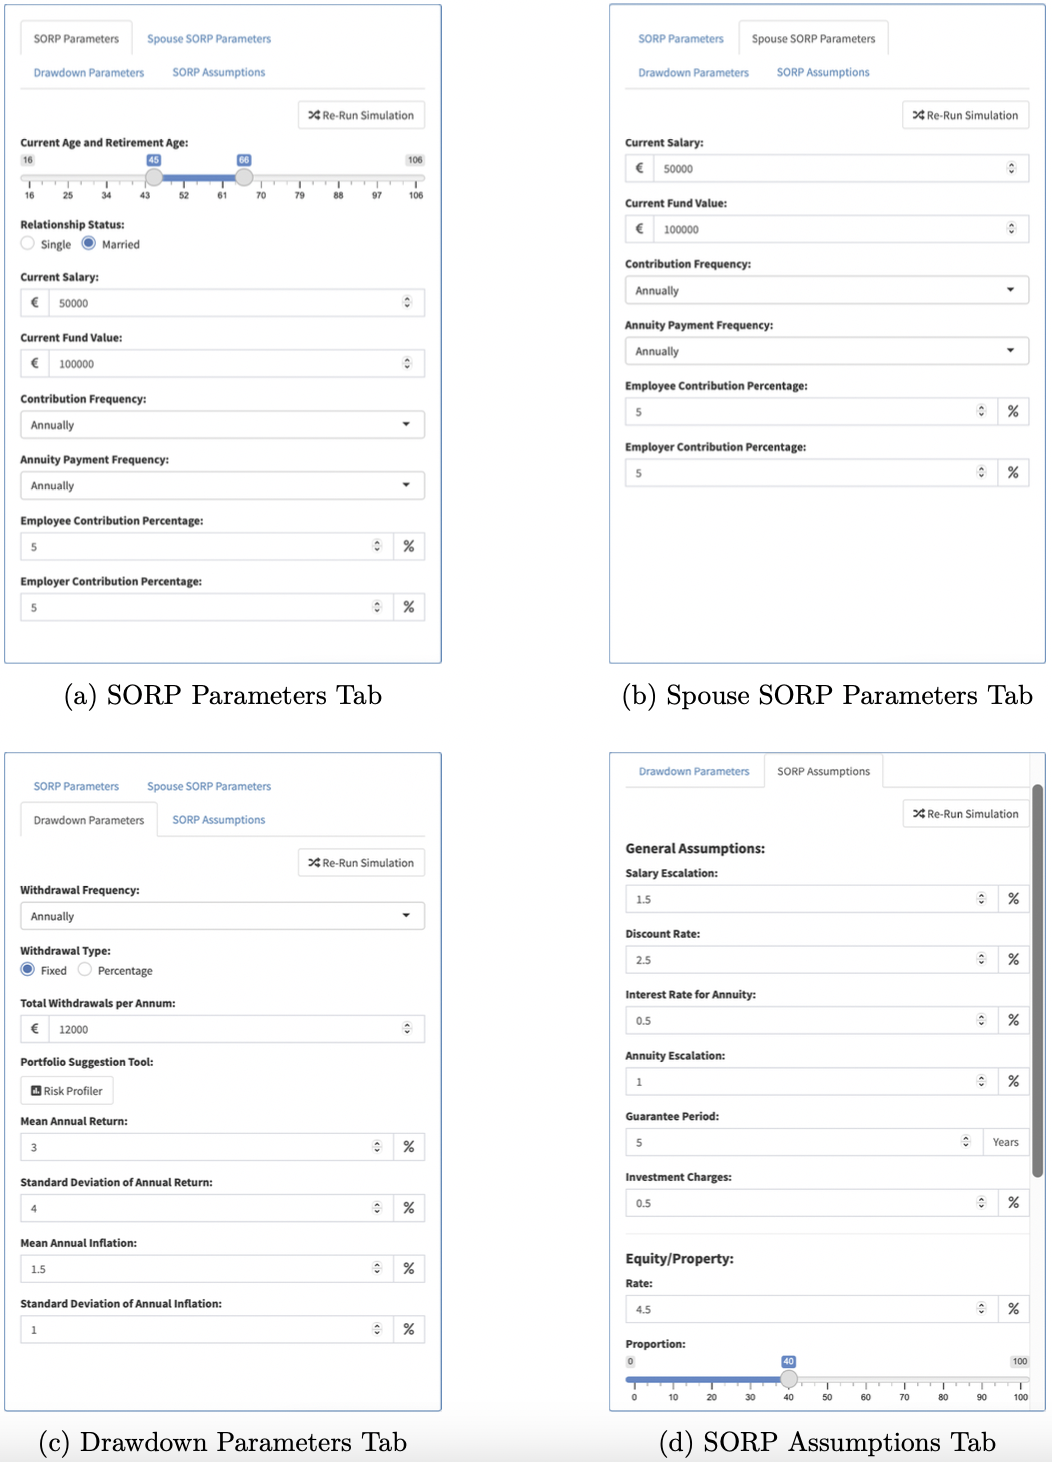
Figure 9.1: Inputs
In the side panel, tabs are once again utilised to separate the SORP Parameters and Assumptions, along with the Drawdown Parameters (Figure 9.1). The key difference here is that the final fund value of the SORP is used as the starting capital of the Drawdown simulations - but the withdrawal and market parameters remain adjustable. This part of the app also allows the user to specify whether they are married - and if so, using the ShinyJS package, an extra SORP Parameters panel appears for the user’s spouse’s details, so that they can be incorporated into the Drawdown’s starting capital (Figure 9.2). A Re-Run Simulation Button is placed on the top-right of each input tab, so that no matter which order the tabs are completed, the user can always run the simulations with ease.
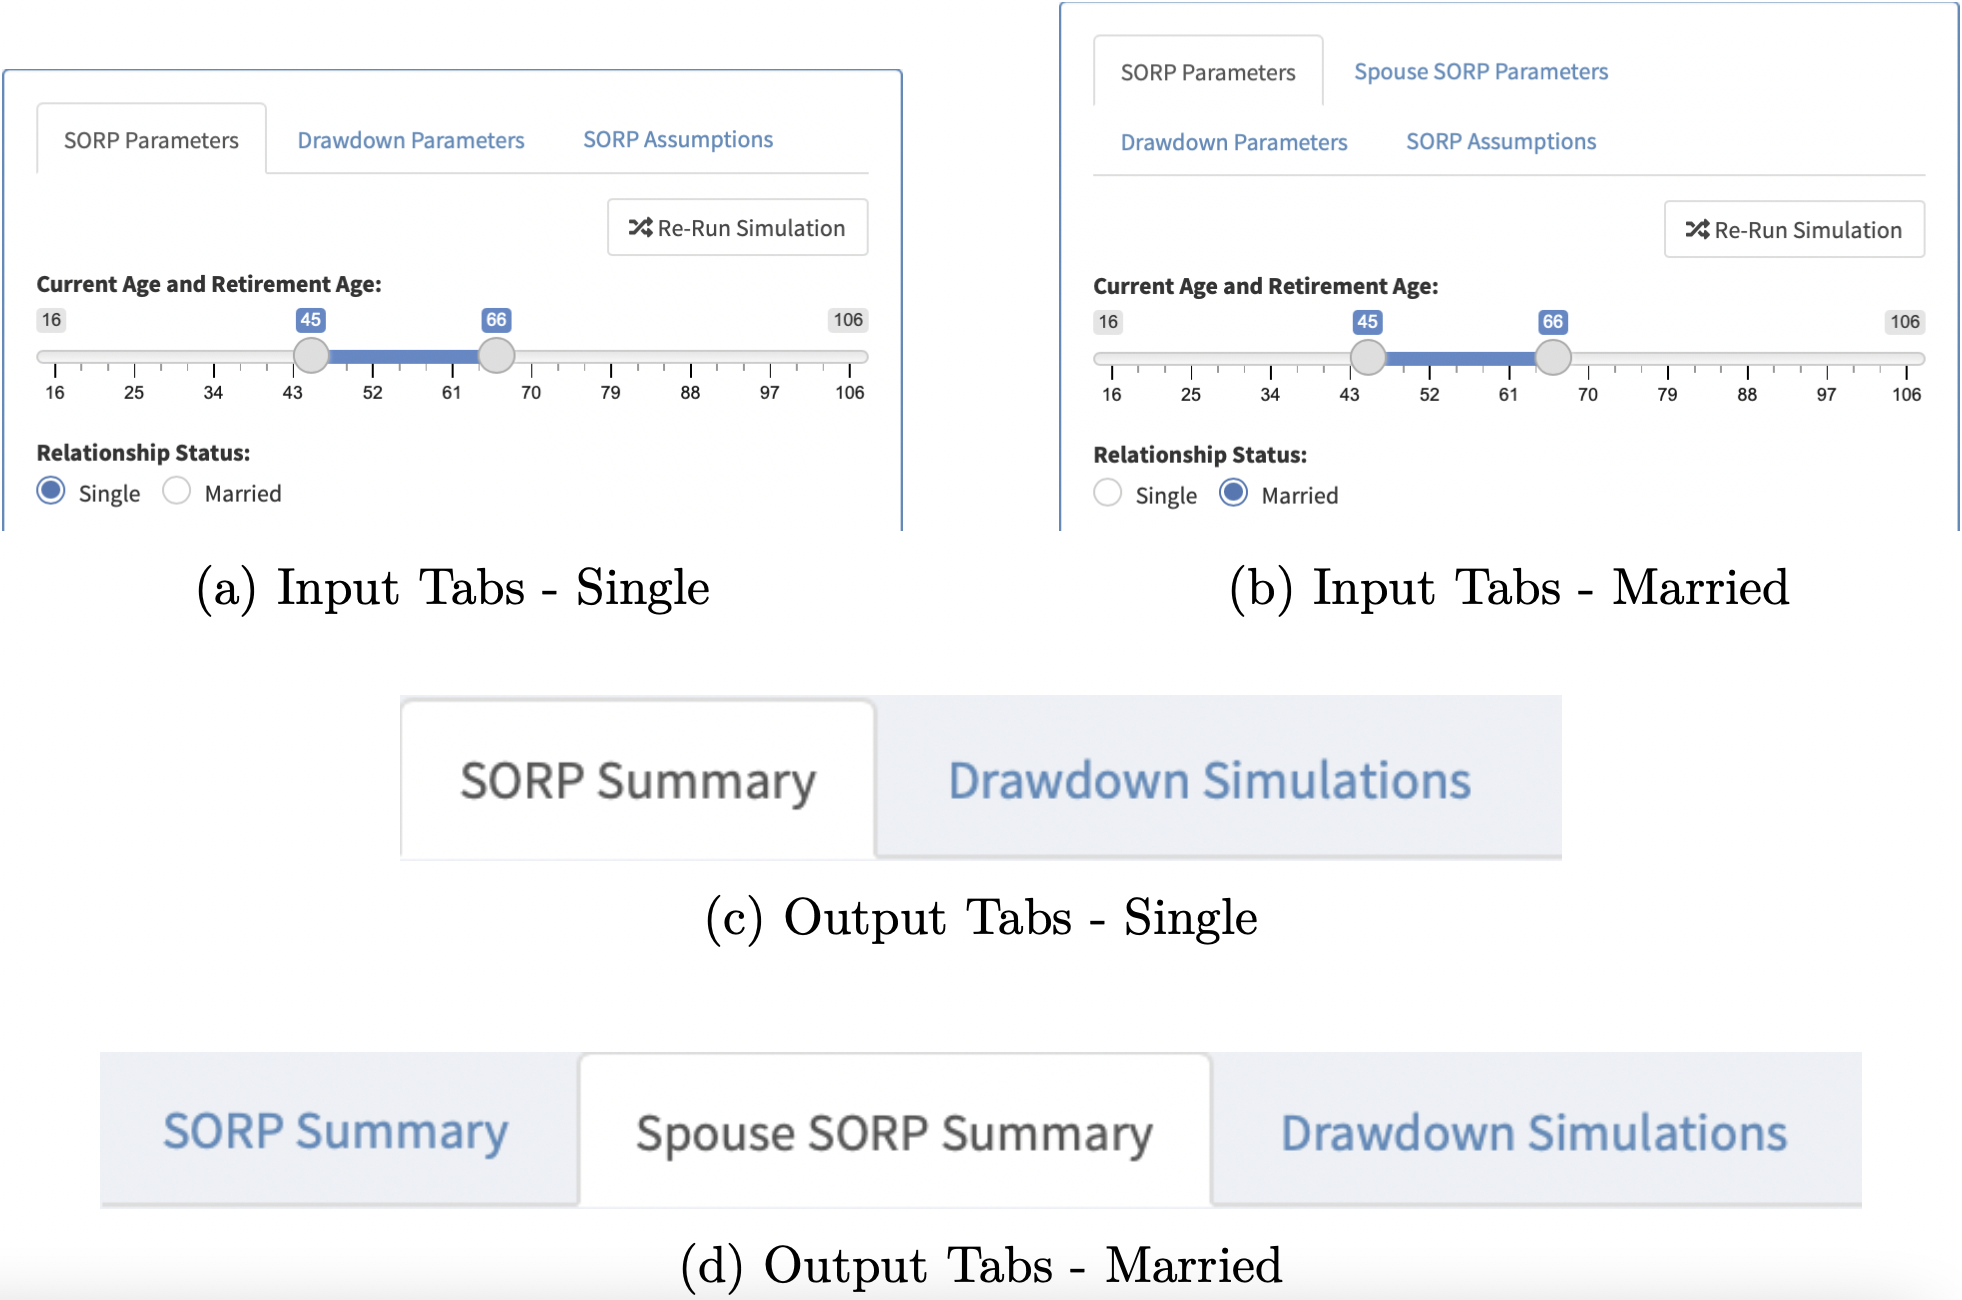
Figure 9.2: Input & Output Tabs - Single vs Married
Once the simulation is run (either on startup or by using the Re-Run Simulation buttons), two different tabs appear in the main panel (Figure 9.3). Firstly, the SORP statistics from earlier are displayed (i.e. fund values, periodic payments, the accumulated wealth graph, and contributions made over time). If a spouse’s details are provided, an additional SORP Summary tab is generated based on these parameters (Figure 9.2).
In the second tab, the same Drawdown data as discussed previously is generated, using the final fund values of the SORPs as the starting capital. Using this combined tool, the user is able to compare some of the differences in opting for a Drawdown retirement strategy over purchasing an annuity.
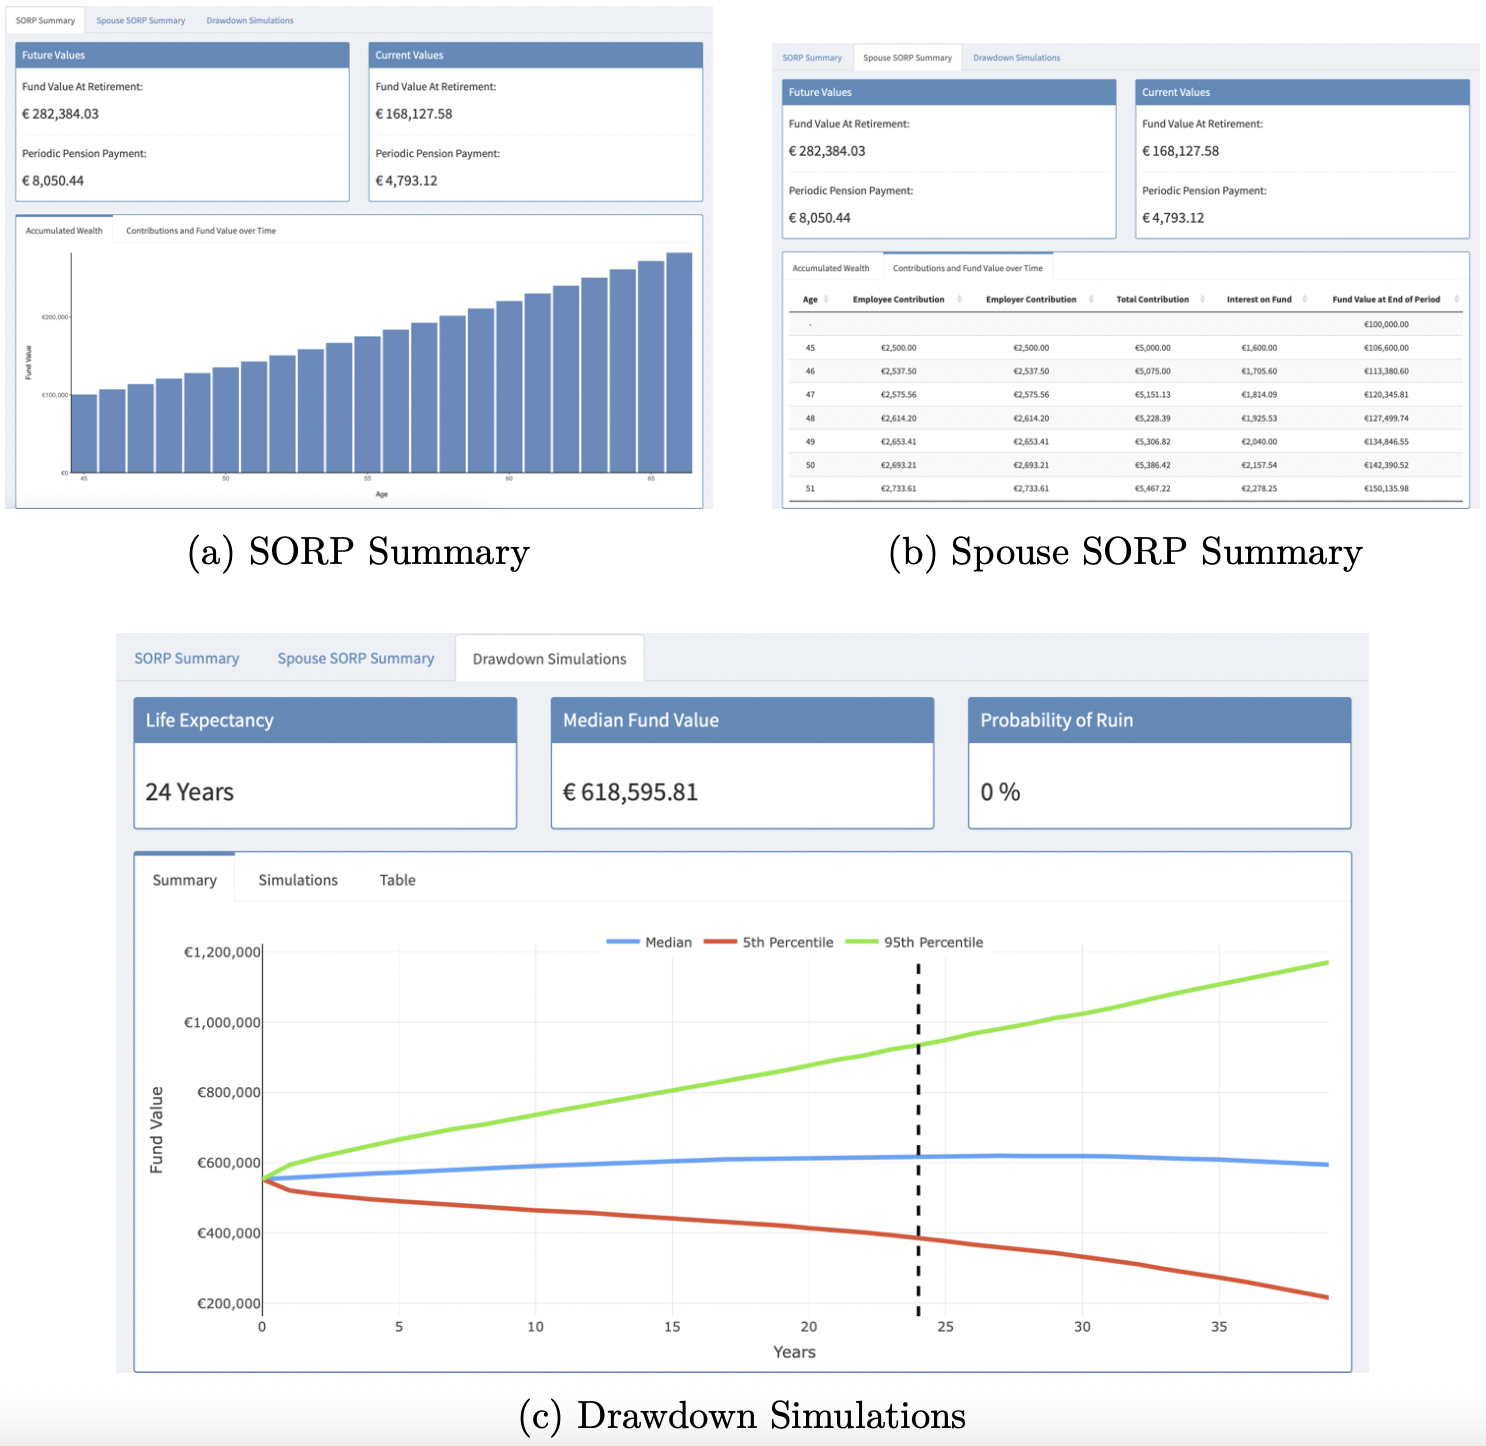
Figure 9.3: Outputs
This ability to recycle code is invaluable - this page is built on top of all the functionality created for the two separate SORP and Drawdown pages, and the modularisation of code in this fashion is an incredible advantage of R and other programming languages over the typical spreadsheet approach to solving actuarial problems.