4 Analyses (Scale Definitions)

4.1 Pilot analyses
282 people responded. We may want to further screen these 282 responses for short response durations. According to communications with Qualtrics in early December, this is the number of seconds to complete the entire survey. Currently, the “number of people who clicked on the assessment link (330)” versus valid n (282) may take care of our very low duration respondents. The shortest response duration in the 330 datafile is 101 whereas the lowest in the 282 datafile is 43. All analyses were performed via R version R version 4.1.3 (2022-03-10) (R Core Team, 2022). Demographic consituency of the pilot sample is located in Appendix C.
4.1.1 Classical test theory
In addition to the below interactive plot [via plotly version 4.10.0; Sievert et al. (2021)], a full inter-item correlation matrix is located in Appendix D.
## Some items ( I find it difficult to mentally disconnect from work. ) were negatively correlated with the total scale and
## probably should be reversed.
## To do this, run the function again with the 'check.keys=TRUE' option
4.1.1.1 Internal consistency estimates
Condition 1 administered items within the substantive dimensions (with successive randomized blocks of Cognitive, Affective, and Behavioral items). Condition 2 administered items within the attitudinal dimensions (with successive randomized blocks of Absorption, Vigor, and Dedication items). Condition 3 stressed the substantive dimensions (with items fully randomized regardless of attitudinal association). Condition 4 stressed the attitudinal dimensions (with items fully randomized within attitudinal dimension regardless of substantive scale association, see Chapter 3.1 and Appendix B). All internal consistency estimates were generated via psych version 2.2.3 (Revelle, 2022). Alphas for the candidate 12-item scales were:
| Dimension | Undifferentiated | Condition 1 | Condition 2 | Condition 3 | Condition 4 |
|---|---|---|---|---|---|
| Affective | 0.87 | 0.88 | 0.84 | 0.88 | 0.87 |
| Behavioral | 0.79 | 0.73 | 0.84 | 0.76 | 0.87 |
| Cognitive | 0.81 | 0.79 | 0.85 | 0.8 | 0.87 |
| Absorption | 0.74 | 0.72 | 0.77 | 0.72 | 0.87 |
| Vigor | 0.85 | 0.8 | 0.88 | 0.84 | 0.87 |
| Dedication | 0.9 | 0.9 | 0.91 | 0.91 | 0.87 |
“Cell” level alphas (4 items each scale, responses collapsed across administrative conditions) were:
| Cell | Alpha |
|---|---|
| Affective - Absorption | 0.66 |
| Affective - Vigor | 0.71 |
| Affective - Dedication | 0.75 |
| Behavioral - Absorption | 0.56 |
| Behavioral - Vigor | 0.7 |
| Behavioral - Dedication | 0.64 |
| Cognitive - Absorption | 0.59 |
| Cognitive - Vigor | 0.62 |
| Cognitive - Dedication | 0.83 |
Corrected item-total correlations are presented in Appendix E
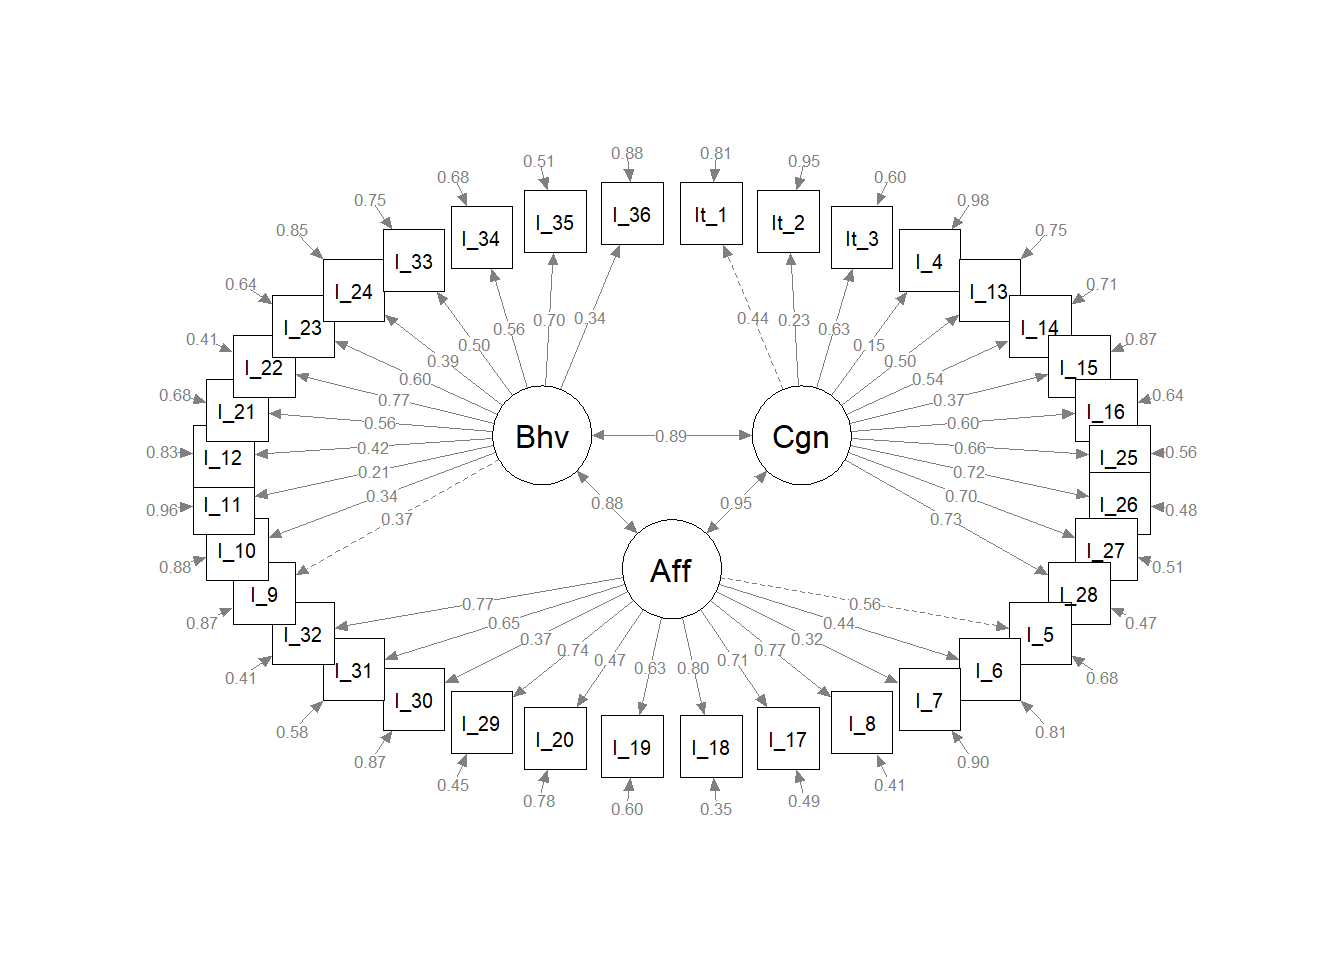
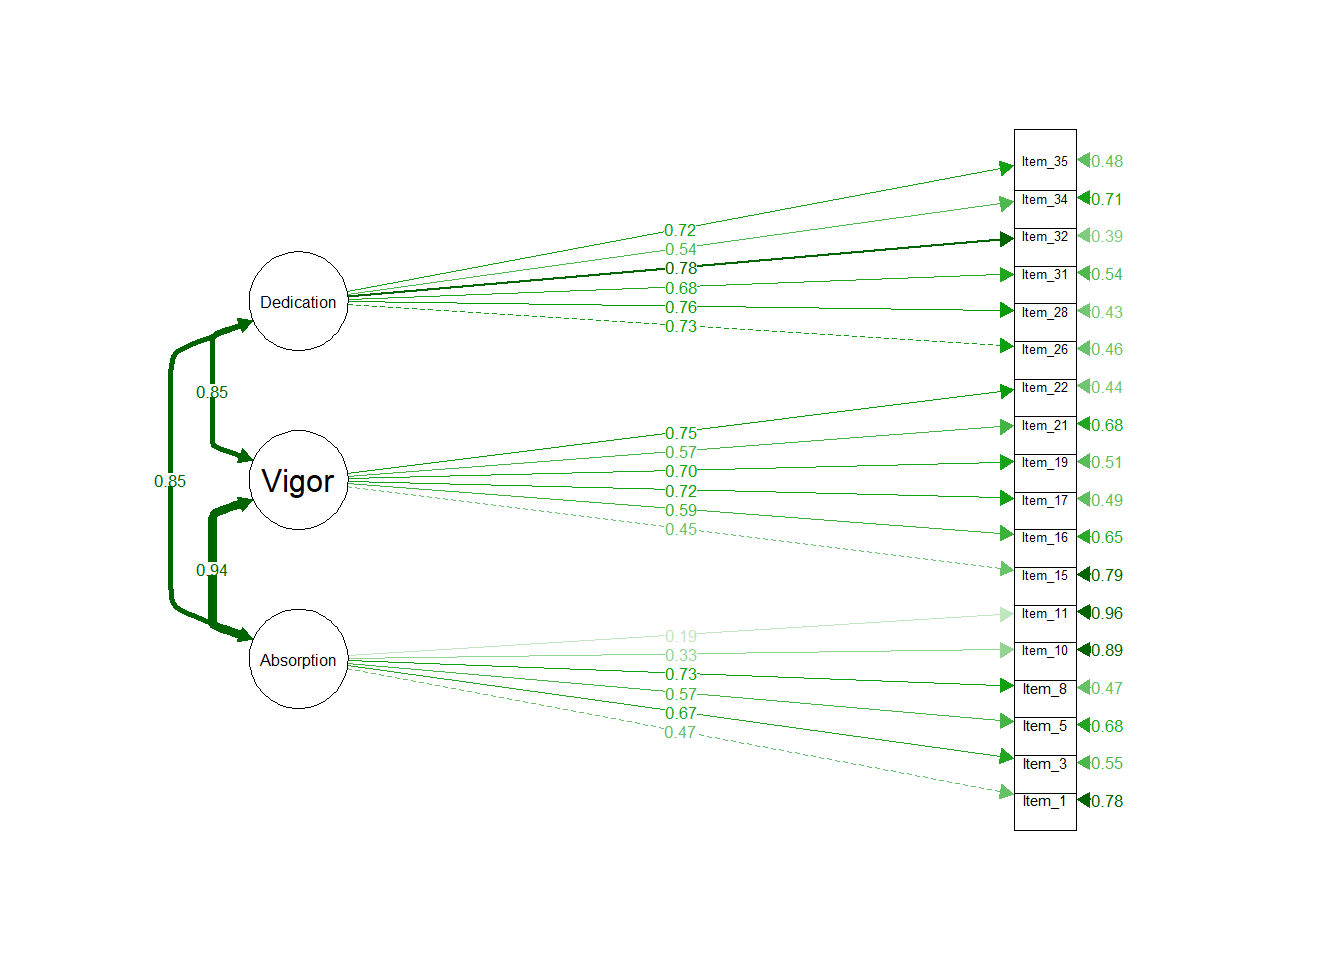
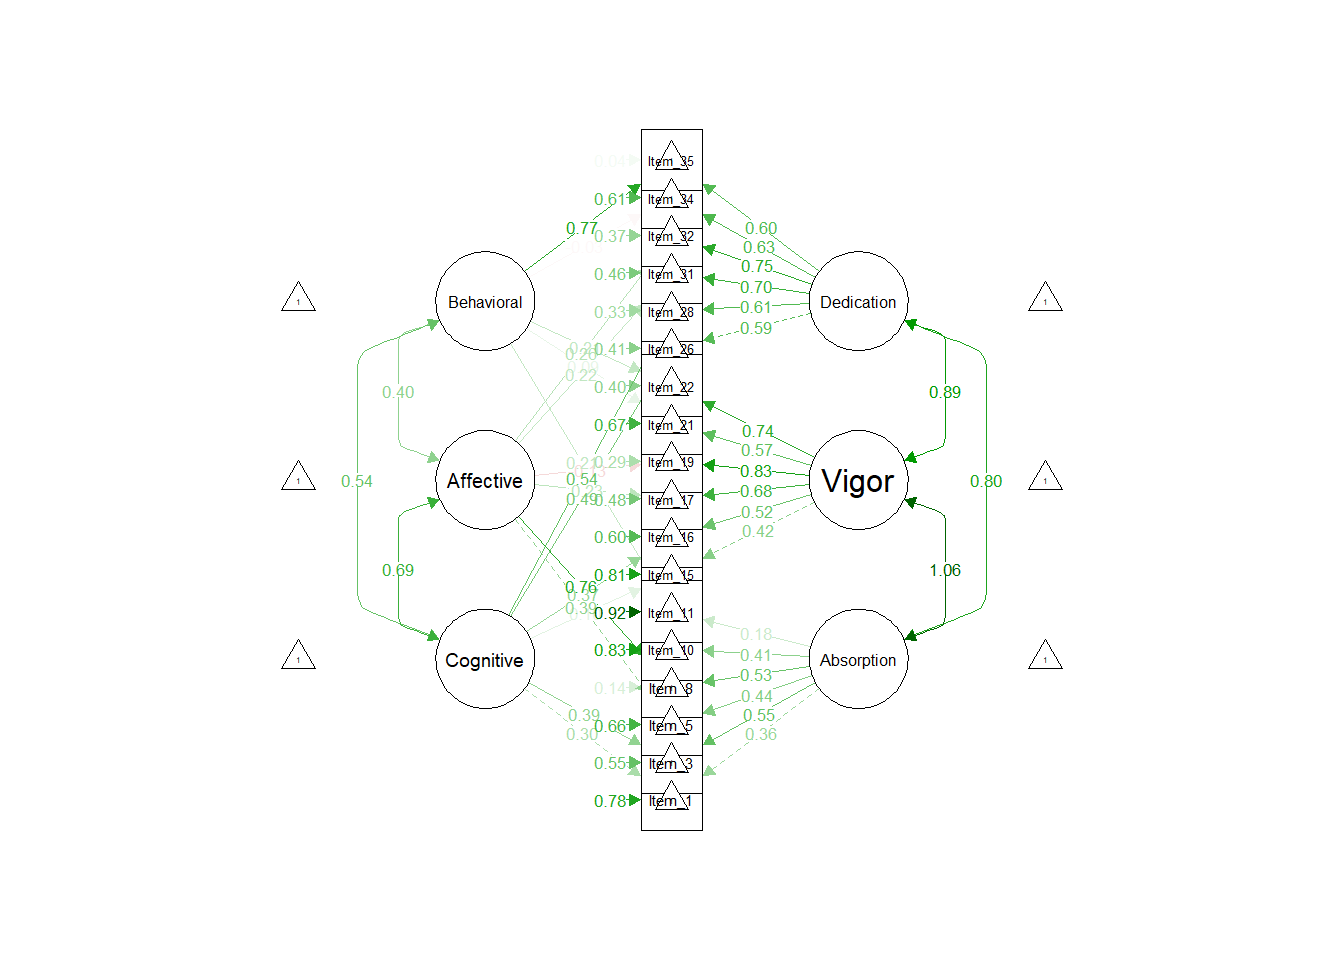
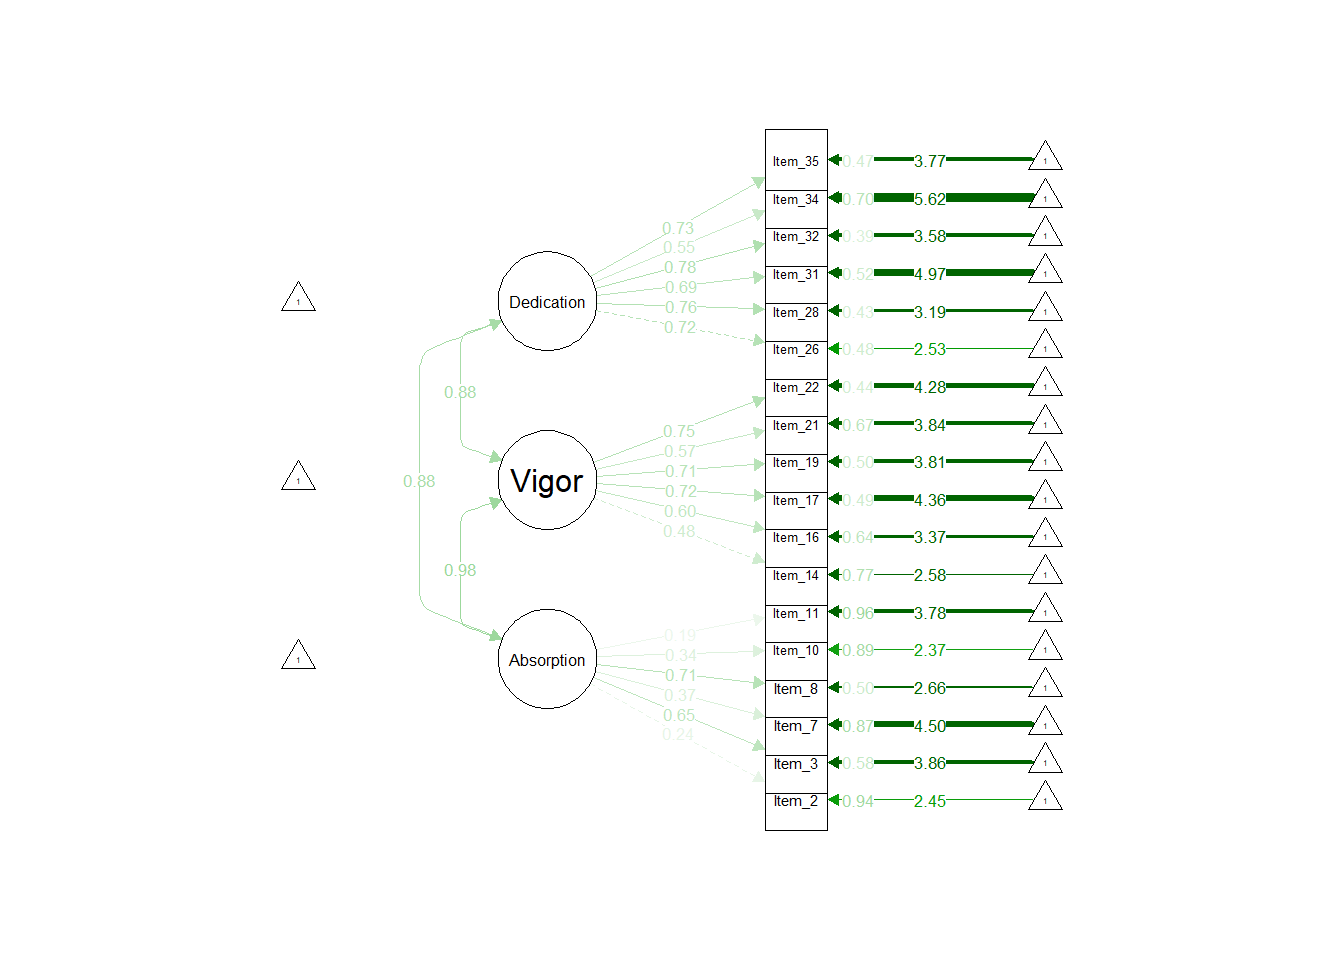
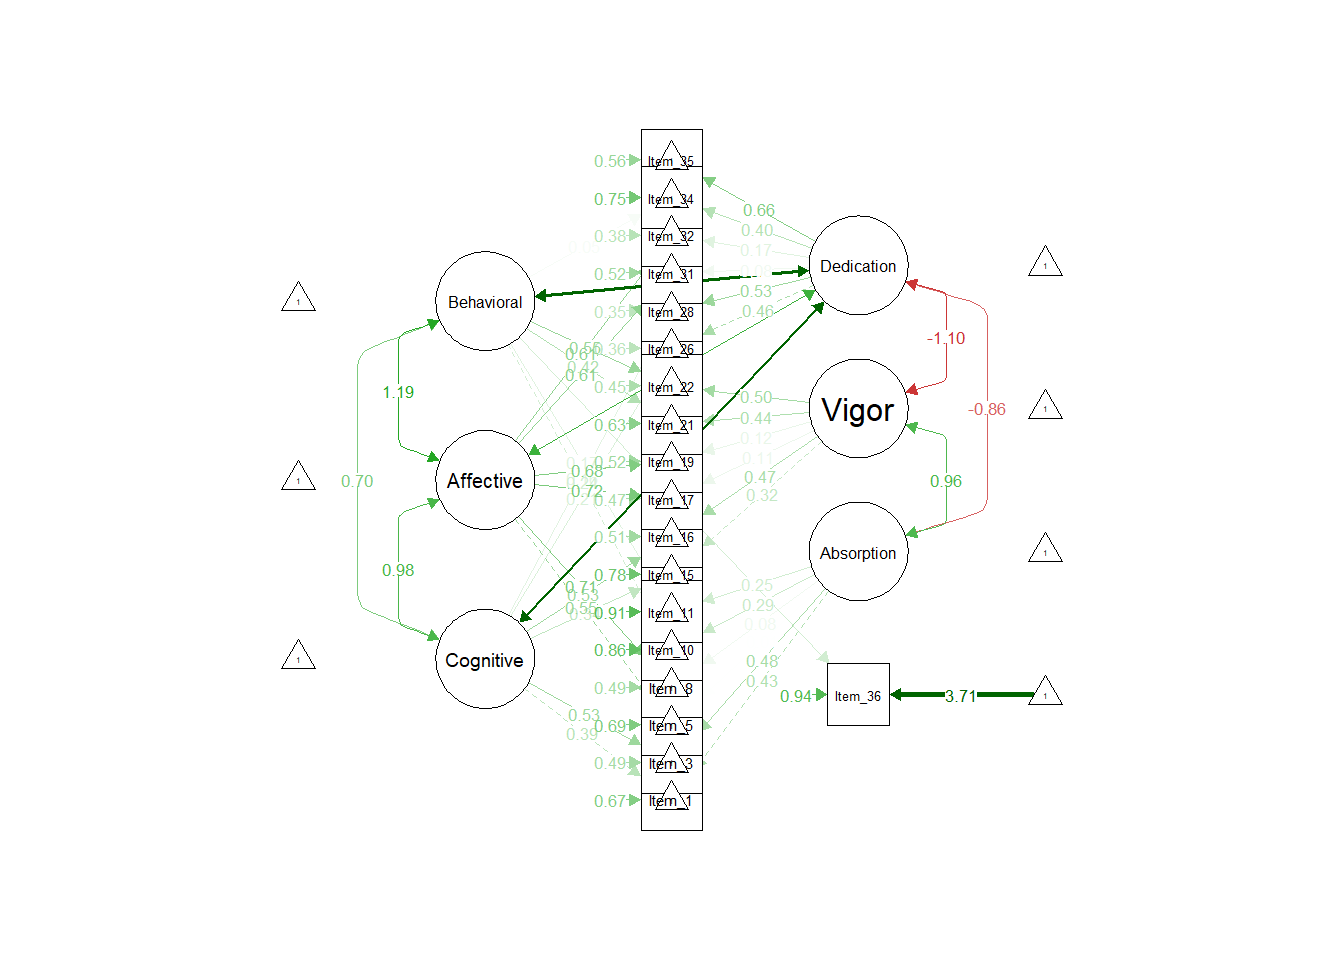
4.1.2 Confirmatory factor analyses
We used lavaan version 0.6.11 (Rosseel et al., 2022) and semPlot version 1.1.5 (Epskamp, 2022)
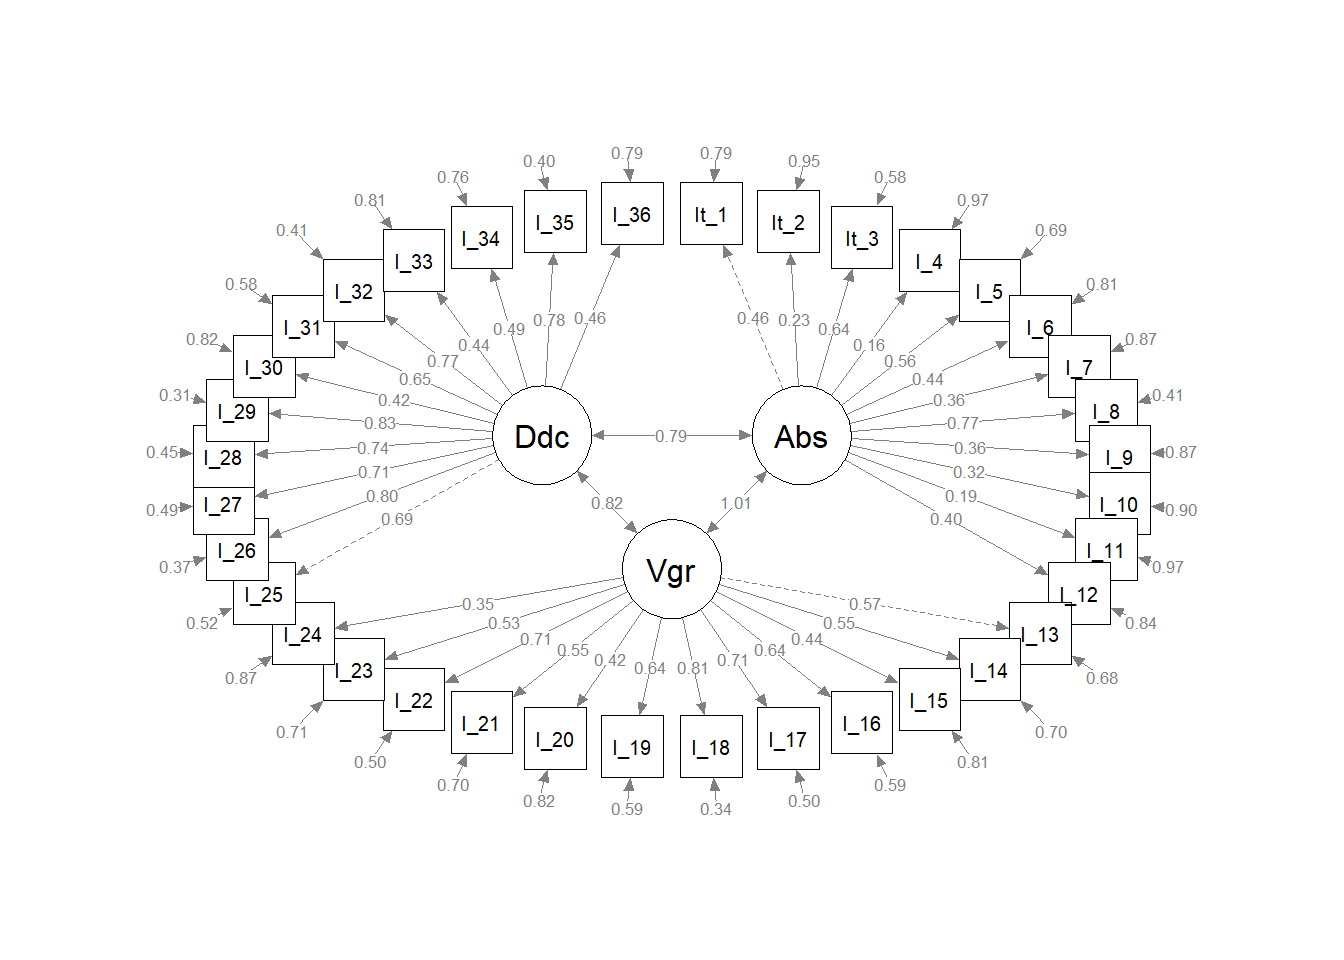
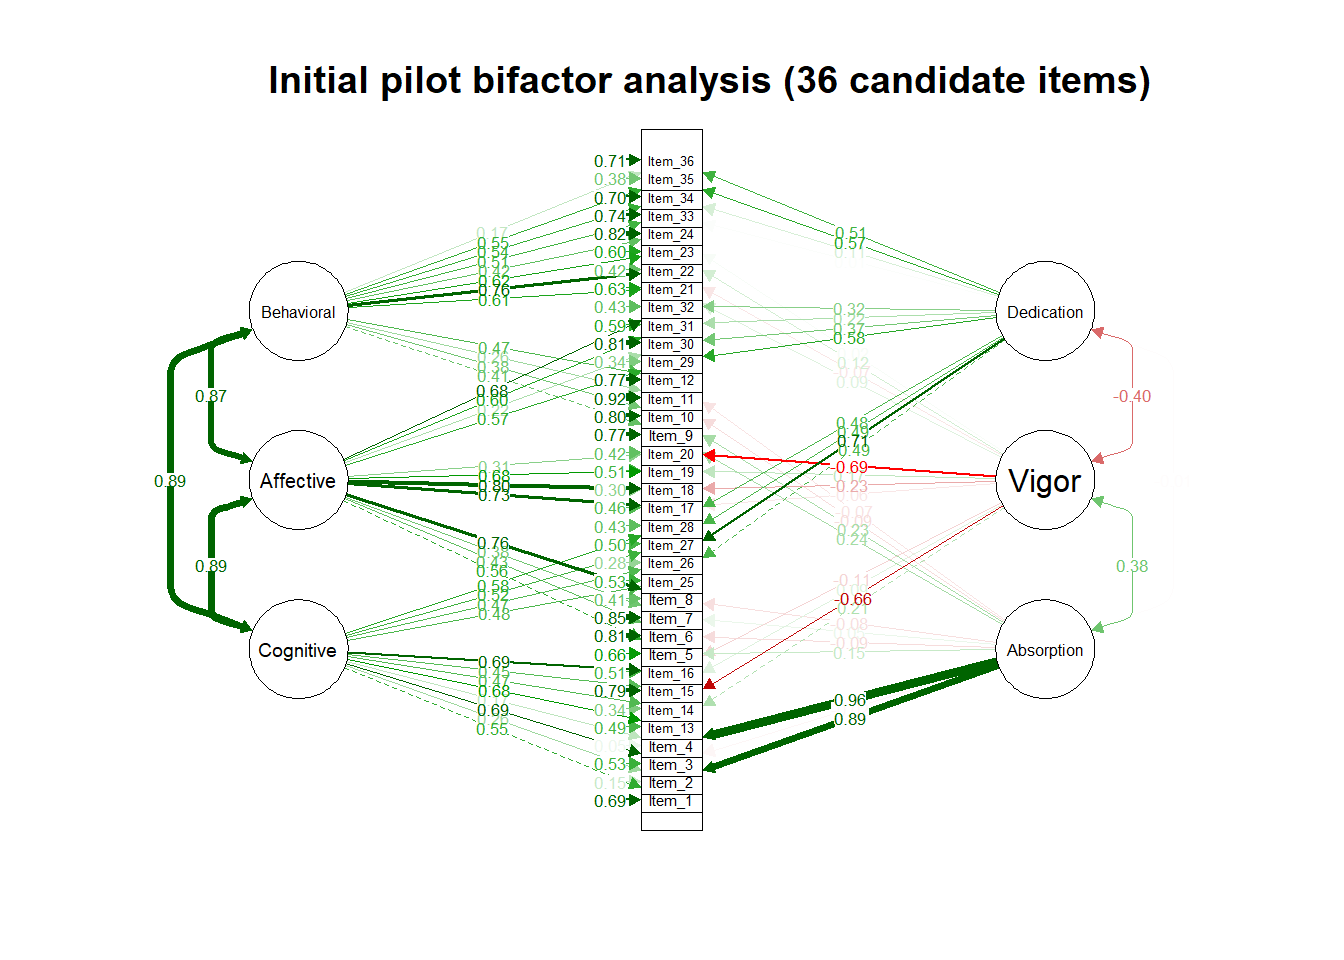
Bifactor analysis are most commonly applied in the exploration of common method variance (see, for example, Reise, 2012; Rodriguez et al., 2016). Most commonly attributed to Holzinger & Swineford (1937), Giordano et al. (2020) provide an overview regarding past and potential applications of exploratory bifactor analysis and cite Reise (2012) as an influential impetus for the resurgence of bifactor models in general. Giordano & Waller (2020) has a recent review of seven different bifactor model applications.
Deese guys also do bifactor stuff: Mansolf & Reise (2017)
| Model | \(\chi^2\) | df | RMSEA | SRMR | CFI | TLI | AIC |
|---|---|---|---|---|---|---|---|
| 3-factor substantive | 2159.21 | 591 | 0.11 | 0.1 | 0.64 | 0.62 | 25481.97 |
| 3-factor attitudinal | 2318.92 | 591 | 0.11 | 0.1 | 0.6 | 0.58 | 25641.68 |
Note. The bifactor model did not actually converge, so no fit indices are available for the bifactor analysis of the 36-item pilot instrument.
4.2 Scale Reduction
Final scale definitions were primarily informed by two sets of indices: 1) corrected item-total correlations, and 2) CFA modification indices. We approached these two procedures as competing item-reduction techniques rather than complementary indices - we did this with the forethought of presenting the competing finalized models within a research context (for example, SIOP). The initially computed corrected item-total correlations can be found in Appendix E. The CFA modification indices extracted from the initial 36-item scale definitions are located in Appendix G.
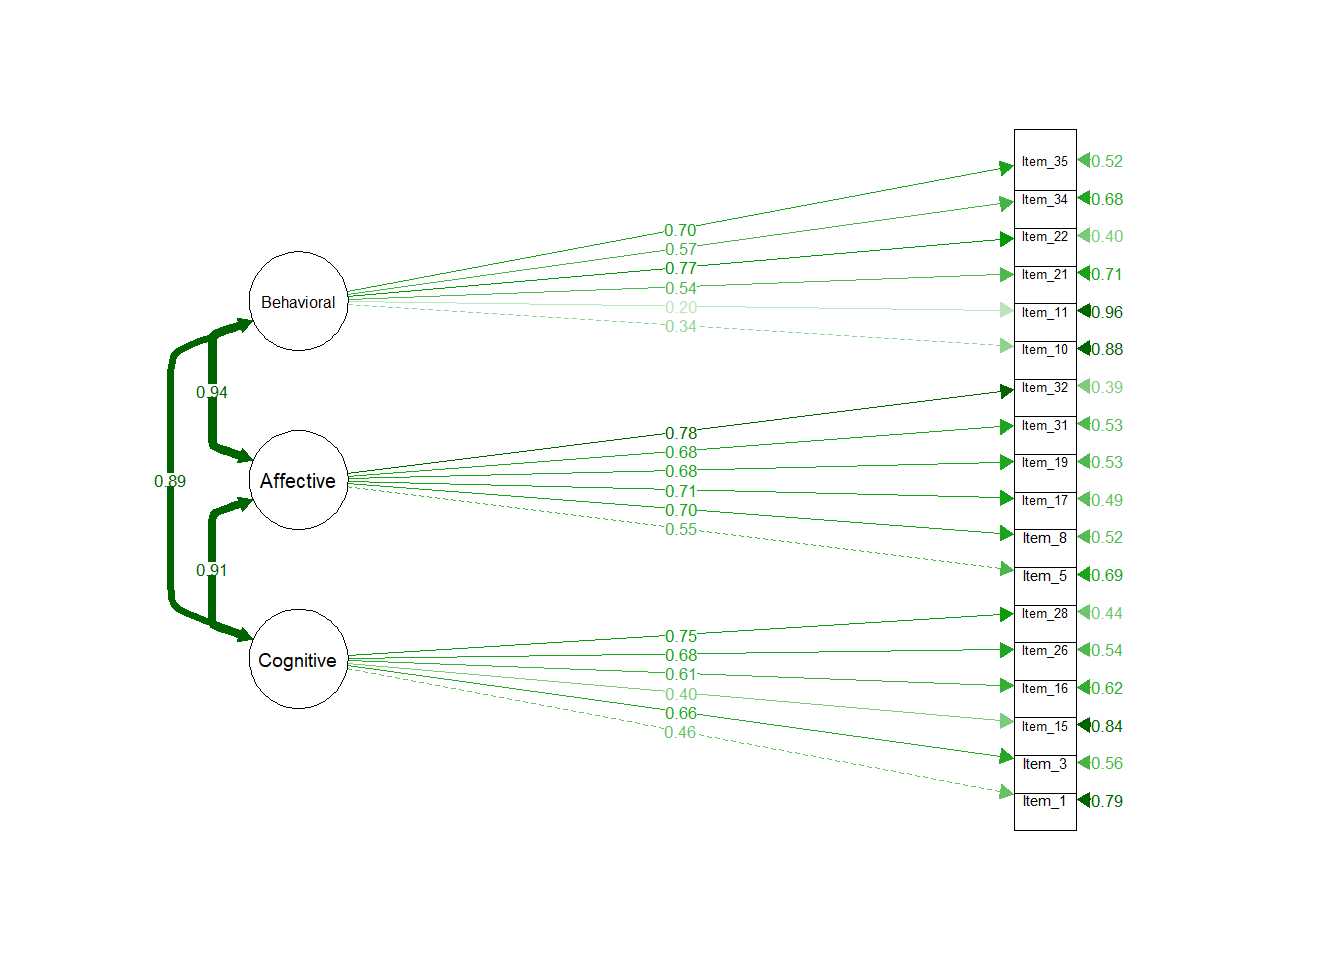
4.2.2 Modification index-informed scale definitions
Scale reduction was performed from 36 to 22 items using modification indices from the two independent models. For example, if modification indices implicated residual covariances between substantive model indicators, and these indicators were furthermore potentially explained by the items both being, for example, “Affective”, then those items were retained. Similarly, if modification indices from the attitudinal model CFA implicated residual item covariances, and these items were associated via the substantive model, those two items were given preference for retention. This process became less instructive after the reduction of 14 items. The goal of the assessment was a finalized 18 (6 per dimension and 2 per dimensional “intersection”), so we prioritized empirial factor loadings (from both substantive and attitudinal models) for the final 4 item reductions. This resulted in two possible final scale definitions: one giving “priority” to the attitudinal model, and one giving “priority” to information extracted from the substantive model.

| 18-Item Model | \(\chi^2\) | df | RMSEA | SRMR | CFI | TLI | AIC |
|---|---|---|---|---|---|---|---|
| substantive (att priority) | 430.47 | 132 | 0.09 | 0.07 | 0.84 | 0.81 | 13467.84 |
| attitudinal (att priority) | 396.01 | 132 | 0.09 | 0.06 | 0.85 | 0.83 | 13433.39 |
| substantive (sub priority) | 460.61 | 132 | 0.09 | 0.07 | 0.83 | 0.8 | 14216.13 |
| attitudinal (sub priority) | 447.7 | 132 | 0.09 | 0.07 | 0.82 | 0.8 | 14424.26 |
| bifactor (sub priority) | 336.58 | 126 | 0.08 | 0.06 | 0.89 | 0.86 | 15026.75 |
4.3 Final proposed structure
The two approaches were applied in the interest of a research question. From a more practical sense, the final scale definitions were informed by these two approaches as well as a consideration of item content (was the indicator an important inclusion for proper content domain sampling?).
4.3.1 Omega
Omega reliability (\(\omega\)) estimates independent latent construct reliability absent the effect of other constructs. Rodriguez et al. (2016) identify “Omega Hierarchical” (\(\omega_H\)) as particularly applicable for bifactor models. Specifically, \(\omega_H\) “…estimates the proportion of variance in total scores that can be attributed to a single general factor, thereby, treating variability in scores due to group factors as measurement error” (p. 150).