3 Collecting structured and unstructured data from the Web
In this chapter we will use four new packages:
* httr handles API calls.
* rtweet which is an R package for efficient use of the Twitter API.
* tidyquant which focuses on financial analysis.
* rvest which allows us to scrape HTML web pages.
We will first install these packages (only once):
install.packages(c("httr","rtweet","tidyquant","rvest"))Then we will load them into our environment as follows:
library(tidyverse)
library(ggformula)
library(ggthemes)
library(httr)
library(jsonlite)
library(rtweet)
library(tidyquant)
library(lubridate)
library(rvest)
3.1 API calls
We will first collect structured output from Application Programming Interfaces (APIs).
3.1.1 Simple API calls: dog-facts
We will starts by using the package httr to make simple API calls. httr allows us to retrieve and post information from specific URLs (AKA endpoints). It has two basic functions: the GET() function that retrieves information from a given URL, and the POST() function that transfers information to a given URL.
As an example, we will use the dog-facts API (https://dukengn.github.io/Dog-facts-API/):
r = GET("https://dog-facts-api.herokuapp.com/api/v1/resources/dogs/all")
r
## Response [https://dog-facts-api.herokuapp.com/api/v1/resources/dogs/all]
## Date: 2021-11-06 20:41
## Status: 200
## Content-Type: application/json
## Size: 57.7 kB
## [
## {
## "fact": "All dogs can be traced back 40 million years ago to a weasel-lik...
## },
## {
## "fact": "Ancient Egyptians revered their dogs. When a pet dog would die, ...
## },
## {
## "fact": "Small quantities of grapes and raisins can cause renal failure i...
## },
## ...One way to access the information of any R object, is to call the function names():
names(r)## [1] "url" "status_code" "headers" "all_headers" "cookies"
## [6] "content" "date" "times" "request" "handle"By running names(r) we observe that there is a field content. This field stores the response of the API call in binary format. We can access any field of an R object with the dollar sign $ as follows:
# Run r$content in your machine to see the results.
# I omit the output here for presentation purposes.
r$content
Recall that the dollar sign
$can also be used to access any columncfrom a tibblet(t$c).
As humans, we can’t really work with binary code; to encode and translate this binary response we can use the rawToChar() function and get the result as a JSON object:
j = rawToChar(r$content)The results are in JSON format because this is how the specific API formats its responses. Most APIs return JSON objects, but some might occassionaly return different formats (e.g., CSV or XML).
Now we can call the function fromJSON() from package jsonlite (see Section 2.2.2) that immediately transforms a JSON object into a data frame:
t = fromJSON(rawToChar(r$content))
t %>% head
## fact
## 1 All dogs can be traced back 40 million years ago to a weasel-like animal called the Miacis which dwelled in trees and dens. The Miacis later evolved into the Tomarctus, a direct forbear of the genus Canis, which includes the wolf and jackal as well as the dog.
## 2 Ancient Egyptians revered their dogs. When a pet dog would die, the owners shaved off their eyebrows, smeared mud in their hair, and mourned aloud for days.
## 3 Small quantities of grapes and raisins can cause renal failure in dogs. Chocolate, macadamia nuts, cooked onions, or anything with caffeine can also be harmful.
## 4 Apple and pear seeds contain arsenic, which may be deadly to dogs.
## 5 Rock star Ozzy Osborne saved his wife Sharon’s Pomeranian from a coyote by tackling ad wresting the coyote until it released the dog.
## 6 Dogs have sweat glands in between their paws.Recall that a data frame behaves almost identical to a tibble. Yet, for consistency, we can use the function as_tibble to transform its internal representation into a tibble. Combining with the code from the previous chunk:
t = as_tibble(fromJSON(rawToChar(r$content)))
t %>% head
## # A tibble: 6 × 1
## fact
## <chr>
## 1 All dogs can be traced back 40 million years ago to a weasel-like animal call…
## 2 Ancient Egyptians revered their dogs. When a pet dog would die, the owners sh…
## 3 Small quantities of grapes and raisins can cause renal failure in dogs. Choco…
## 4 Apple and pear seeds contain arsenic, which may be deadly to dogs.
## 5 Rock star Ozzy Osborne saved his wife Sharon’s Pomeranian from a coyote by ta…
## 6 Dogs have sweat glands in between their paws.Now we have a final clean tibble that we can explore and manipulate as we discusses earlier in Section 2.
3.1.2 API calls with parameters
Besides getting all available information from an API endpoint, we often need to specify the chunks of information that we are interested in.
To show an example we will use the COVID-19 API that allows us to get live stats on COVID infections, recoveries, and deaths, per country. The API’s documentation can be found here: https://documenter.getpostman.com/view/10808728/SzS8rjbc (Main website: https://covid19api.com)
Assume that we want to get the confirmed cases in the Greece, between June 1st and August 26th.
To do so, we add after the endpoint a question mark ?, followed by the parameters that define the period we are looking for:
r = GET("https://api.covid19api.com/country/greece/status/confirmed?from=2021-06-01T00:00:00Z&to=2021-08-26T00:00:00Z")
r
## Response [https://api.covid19api.com/country/greece/status/confirmed?from=2021-06-01T00:00:00Z&to=2021-08-26T00:00:00Z]
## Date: 2021-11-06 20:41
## Status: 200
## Content-Type: application/json; charset=UTF-8
## Size: 15 kB
## [{"Country":"Greece","CountryCode":"GR","Province":"","City":"","CityCode":""...Similar to before, we transform the result to a tibble:
r1 =  as_tibble(fromJSON(rawToChar(r$content)))
r1 %>%  head
## # A tibble: 6 × 10
## Country CountryCode Province City CityCode Lat Lon Cases Status Date
## <chr> <chr> <chr> <chr> <chr> <chr> <chr> <int> <chr> <chr>
## 1 Greece GR "" "" "" 39.07 21.82 404163 confir… 2021-0…
## 2 Greece GR "" "" "" 39.07 21.82 405542 confir… 2021-0…
## 3 Greece GR "" "" "" 39.07 21.82 406751 confir… 2021-0…
## 4 Greece GR "" "" "" 39.07 21.82 407857 confir… 2021-0…
## 5 Greece GR "" "" "" 39.07 21.82 408789 confir… 2021-0…
## 6 Greece GR "" "" "" 39.07 21.82 409368 confir… 2021-0…3.1.3 Handling dates
If we examine the resulting tibble, we can see that there is a column named Date. However R thinks that this is character (<chr>) column.
Fortunately, we can transform this column to a date type with the function as_date() from the package lubridate:
r1$Date = as_date(r1$Date)
r1 %>%  head
## # A tibble: 6 × 10
## Country CountryCode Province City CityCode Lat Lon Cases Status
## <chr> <chr> <chr> <chr> <chr> <chr> <chr> <int> <chr>
## 1 Greece GR "" "" "" 39.07 21.82 404163 confirmed
## 2 Greece GR "" "" "" 39.07 21.82 405542 confirmed
## 3 Greece GR "" "" "" 39.07 21.82 406751 confirmed
## 4 Greece GR "" "" "" 39.07 21.82 407857 confirmed
## 5 Greece GR "" "" "" 39.07 21.82 408789 confirmed
## 6 Greece GR "" "" "" 39.07 21.82 409368 confirmed
## # … with 1 more variable: Date <date>Note that we have already loaded the package
lubridatein our working environment in the begining.
Once we transform the column into a date type, we can use date-specific functions from the package lubridate that can manipulate dates. For instance, we can use the function wday() which will return the day of the week for each date:
wday(r1$Date, label = T) %>% head## [1] Tue Wed Thu Fri Sat Sun
## Levels: Sun < Mon < Tue < Wed < Thu < Fri < SatIn the previous call of
wdaywe setlabel = T. This argument returns the results in labels (such as Fri, Sat, Sun, Mon, etc.). Experiment with runningwday()withlabel = Fto see the difference.
3.1.4 Data analysis of data collected from an API
Let us assume now that we want to estimate the number of confirmed cases per weekday. First, we need to create a weekday column that stores the day of the week:
r2 = r1 %>% mutate(weekday = wday(Date, label=T))
r2 %>% head
## # A tibble: 6 × 11
## Country CountryCode Province City CityCode Lat Lon Cases Status
## <chr> <chr> <chr> <chr> <chr> <chr> <chr> <int> <chr>
## 1 Greece GR "" "" "" 39.07 21.82 404163 confirmed
## 2 Greece GR "" "" "" 39.07 21.82 405542 confirmed
## 3 Greece GR "" "" "" 39.07 21.82 406751 confirmed
## 4 Greece GR "" "" "" 39.07 21.82 407857 confirmed
## 5 Greece GR "" "" "" 39.07 21.82 408789 confirmed
## 6 Greece GR "" "" "" 39.07 21.82 409368 confirmed
## # … with 2 more variables: Date <date>, weekday <ord>Now if we look at the data, the API provides commutative numbers of confirmed cases in each area. So in order to get the new number of confirmed cases per day, we will need to subtract from each day the number of confirmed cases from the previous day.
R has a function lag() that takes as input a variable and shifts the variable one time period so that each observation stores the value of the previous period. This is particularly useful in time series data.
lag() to work properly the tibble must be ordered. In this example, it is already ordered by the API response.
lag() function here: https://dplyr.tidyverse.org/reference/lead-lag.html
As an example, check out the first six values of the original Cases column:
r2 = r1
r2$Cases %>%  head
## [1] 404163 405542 406751 407857 408789 409368Now see how the lag() function shifts those values:
lag(r2$Cases) %>% head## [1] NA 404163 405542 406751 407857 408789With lag() we can estimate the numberOfNewCases for each day by subtracting the number of previous cases stored in the lagged variable. Then, we can group by the new column weekday to estimate the average number of new cases per weekday:
r1 %>%  mutate(weekday = wday(Date, label=T), numberOfNewCases = Cases - lag(Cases)) %>%
        select(Cases,weekday,numberOfNewCases) %>% group_by(weekday) %>%
        summarize(averageCases = mean(numberOfNewCases, na.rm = T))
## # A tibble: 7 × 2
## weekday averageCases
## <ord> <dbl>
## 1 Sun 1153.
## 2 Mon 1531.
## 3 Tue 2975.
## 4 Wed 2121.
## 5 Thu 2077.
## 6 Fri 2008.
## 7 Sat 1905.Alternatively, we can plot the number of new cases over time:
r1 %>%   mutate(weekday = wday(Date, label=T),numberOfNewCases = Cases - lag(Cases)) %>%
  gf_line(numberOfNewCases~Date) %>% gf_smooth(se=T)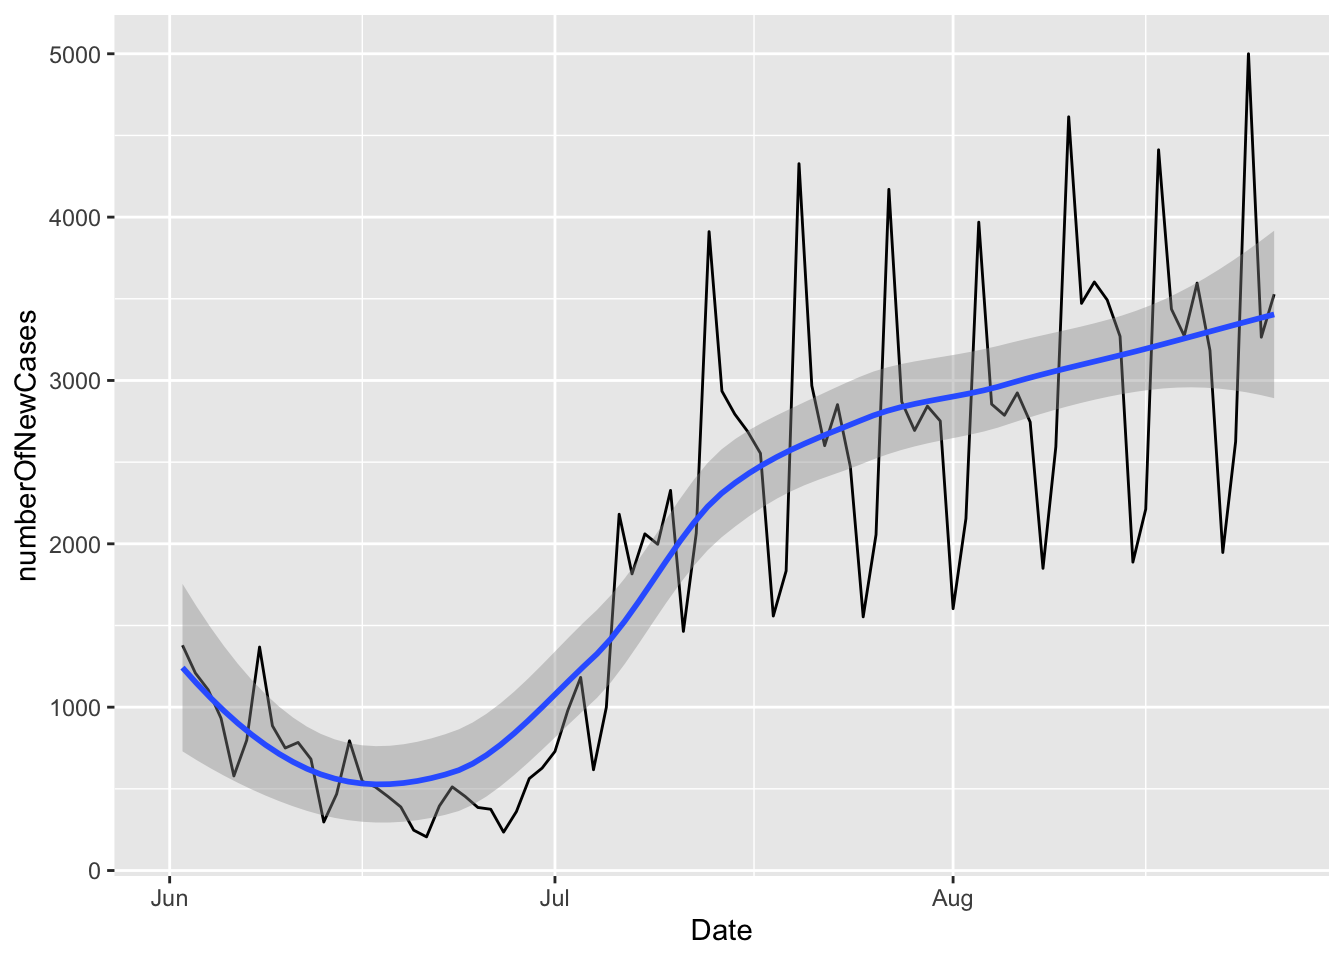
Note that
gf_lineknows how to use theDatecolumn as a date: it automatically transforms the date values intoJun,Jul, andAug.
3.1.5 Authentication with the Twitter API wrapper rtweet
Not every API is open for everyone to query. Some APIs require authentication. Take for instance the Twitter API. In order to gain access to Twitter data, we first need to have a Twitter account, and submit an application that explains the reasons that we want to use the Twitter API. You can find more info here: https://developer.twitter.com/en/docs
Instead of using the GET() function to access the Twitter API, we will use the package rtweet which is an API wrapper.
API wrappers are language-specific packages that wrap API calls into easy-to-use functions. So instead of using every time the function GET with a specific endpoint, wrappers include functions that encapsulate these end points and streamline the communication between our program and the API.
rtweet wrapper` here:https://github.com/ropensci/rtweet
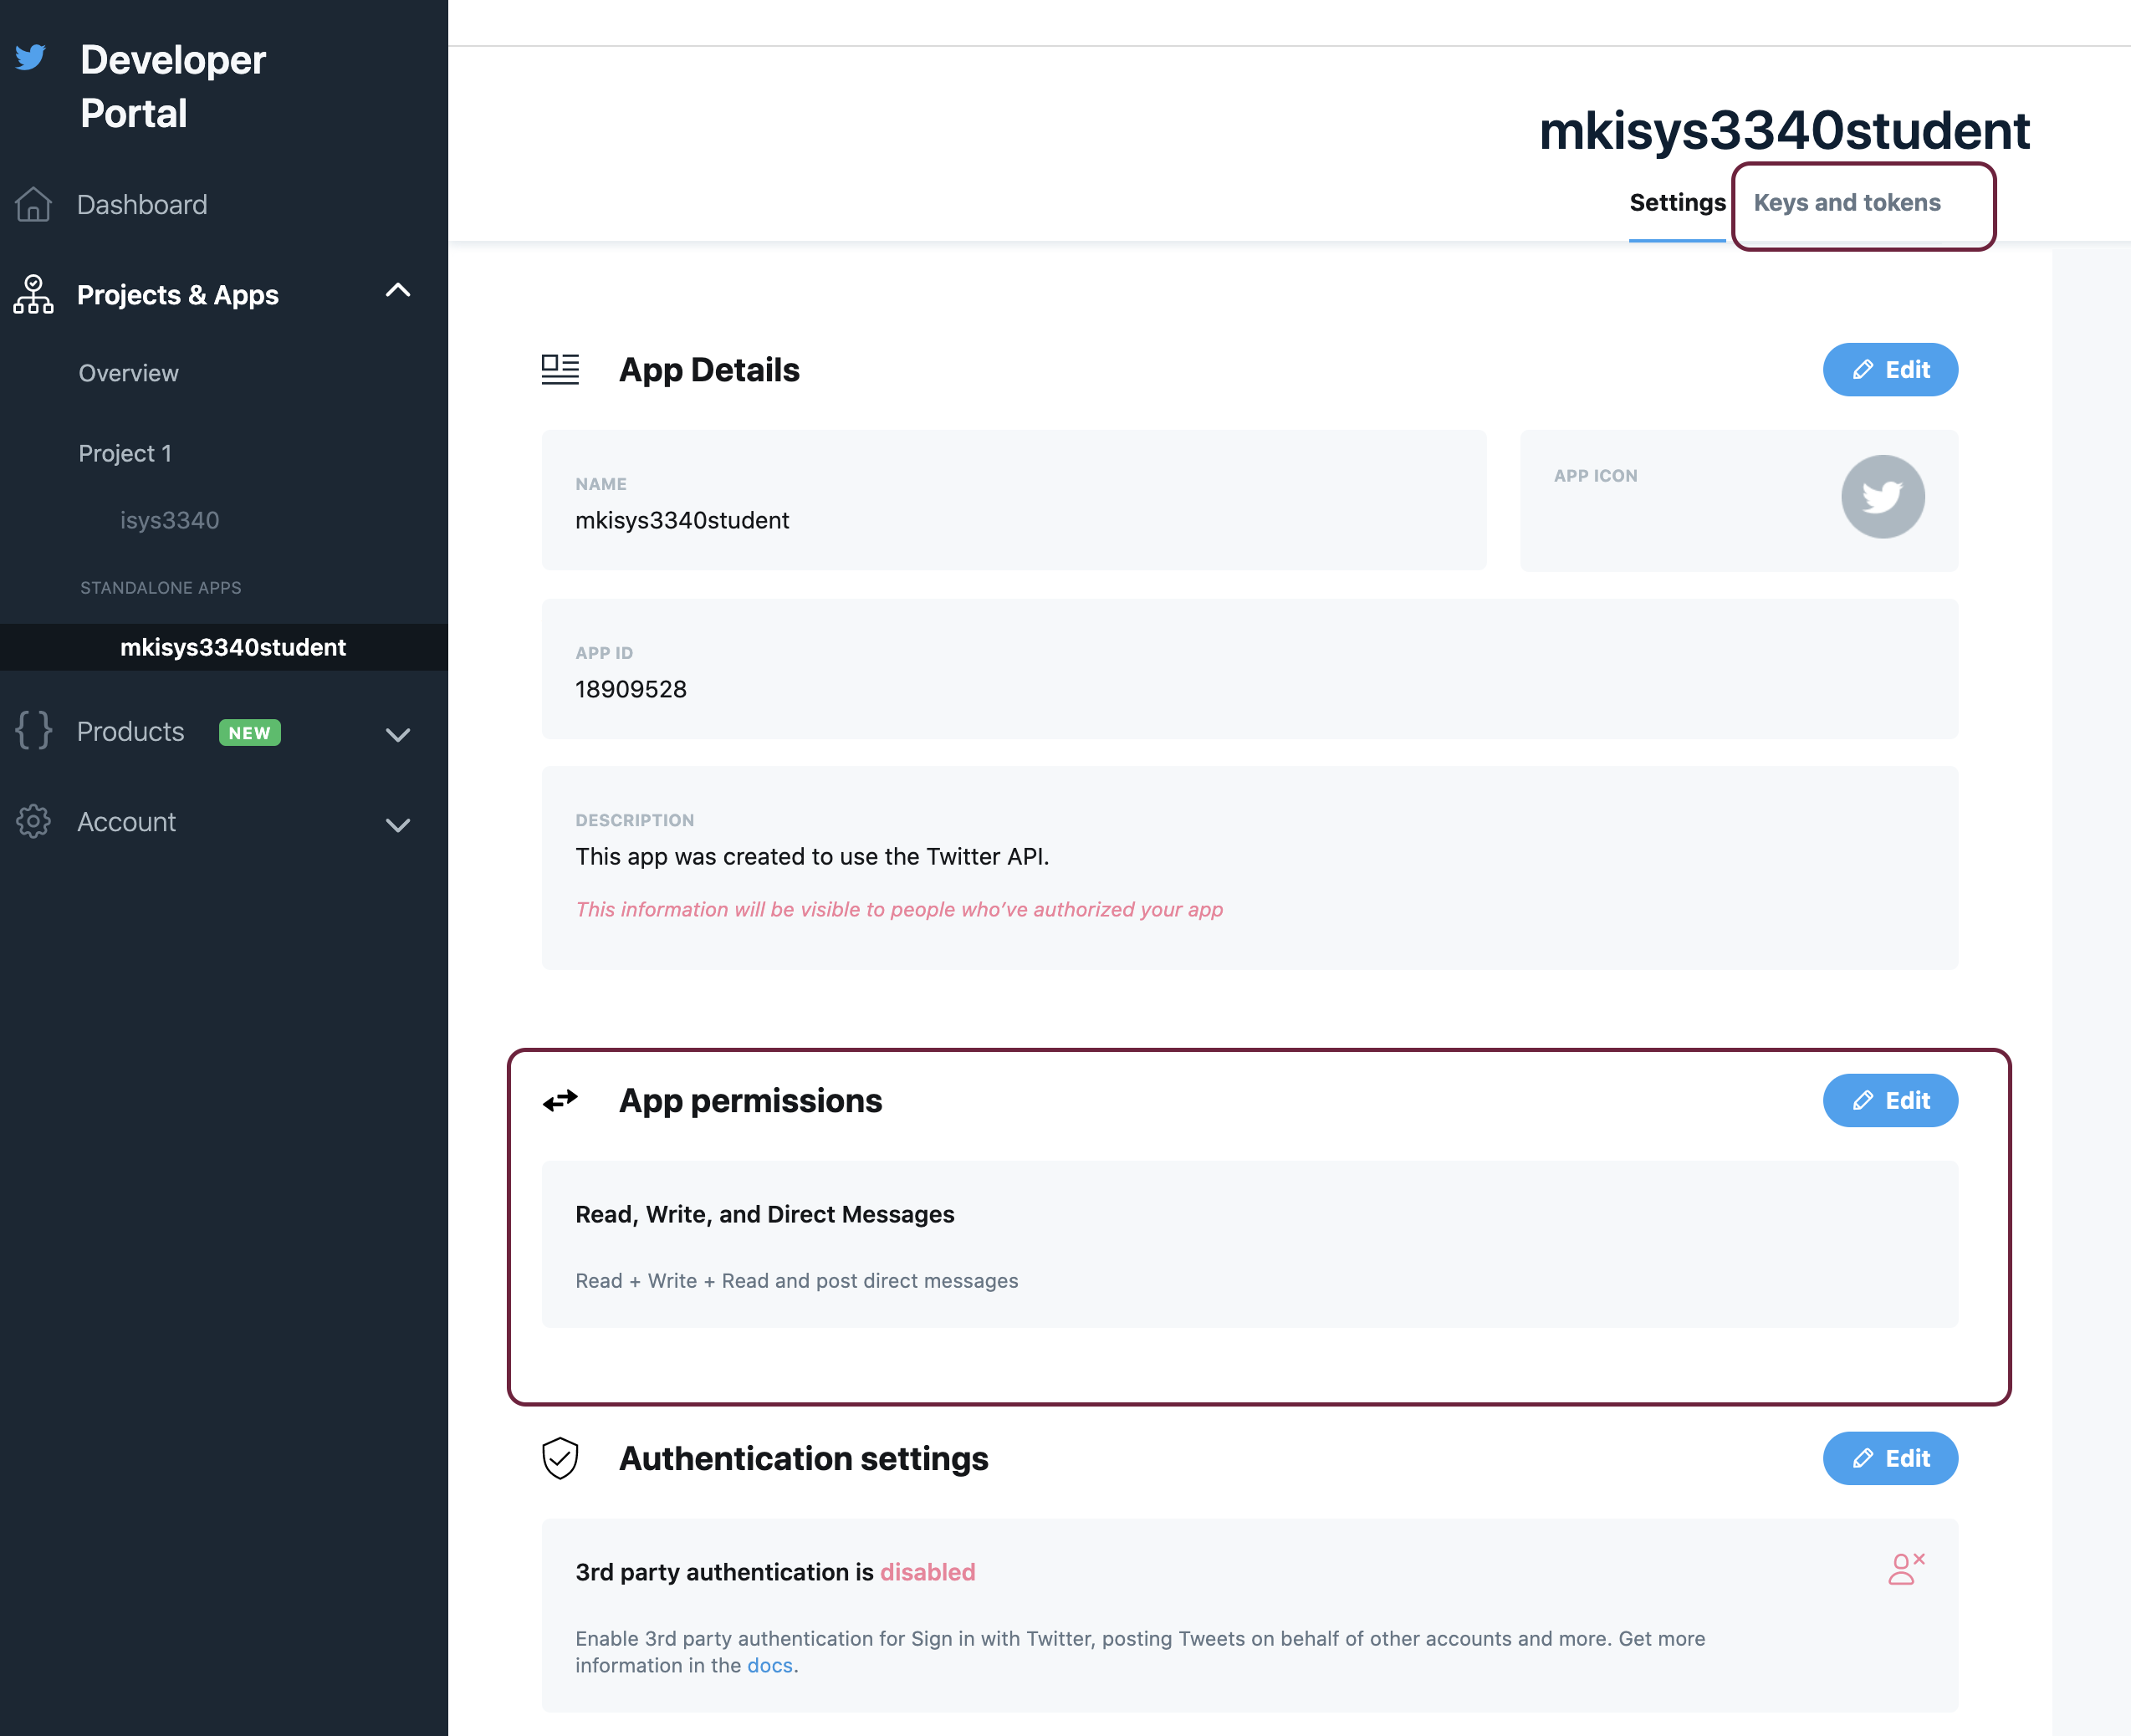
3.1.5.1 create_token()
The first thing we will do in order to use the wrapper rtweet is to create a unique signature that allows us to completely control and manipulate our twitter account. We will need the key, secret key, access token, secret access token, and the application name. We can get this info from our developer twitter account (keys and tokens section).
Then, we can store these keys into variables as follows:
key = "key"
secret = "secret"
access = "access"
access_secret = "access_secret"
app_name = "appname"
Once we have the necessary keys, we can use the function create_token() to generate our unique signature.
myToken = create_token(app = app_name,
             consumer_key = key,
             consumer_secret = secret,
             access_token = access,
             access_secret = access_secret)
3.1.5.2 post_tweet()
Now we can use our signature along with the function post_tweet to post a new tweet:
post_tweet("The students of ISYS3350 are the best! Period.", token = myToken)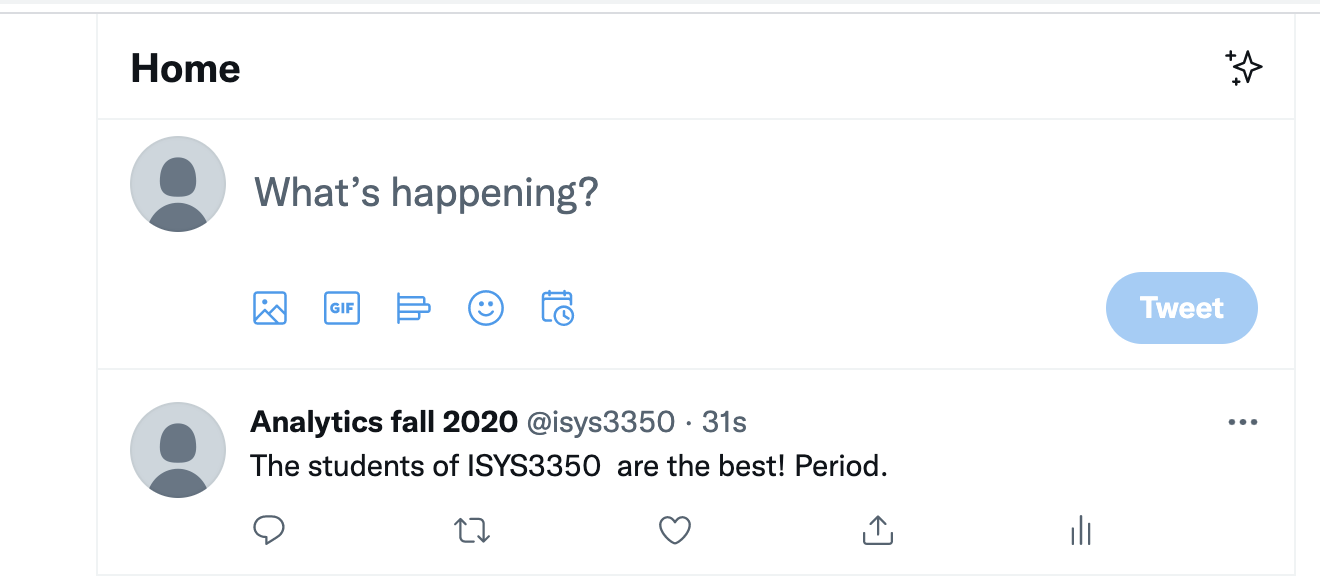
3.1.5.3 search_tweets()
We can use the function search_tweets() to look for specific tweets, for instance, tweets that include the hashtag #analytics:
analytics = search_tweets("#analytics", n=50,token = myToken,
                          include_rts = F)
analytics %>% head
## # A tibble: 6 × 90
## user_id status_id created_at screen_name text source
## <chr> <chr> <dttm> <chr> <chr> <chr>
## 1 939462156 145708561… 2021-11-06 20:40:55 tweetgirlmem "I need… Twitt…
## 2 900369386715979776 145708537… 2021-11-06 20:40:00 DataVault_UK "Should… Semru…
## 3 3219670842 145708517… 2021-11-06 20:39:11 njoyflyfish… "Total … smcap…
## 4 3219670842 145708453… 2021-11-06 20:36:38 njoyflyfish… "Total … smcap…
## 5 3219670842 145707754… 2021-11-06 20:08:52 njoyflyfish… "Total … smcap…
## 6 3219670842 145708067… 2021-11-06 20:21:18 njoyflyfish… "Total … smcap…
## # … with 84 more variables: display_text_width <dbl>, reply_to_status_id <lgl>,
## # reply_to_user_id <lgl>, reply_to_screen_name <lgl>, is_quote <lgl>,
## # is_retweet <lgl>, favorite_count <int>, retweet_count <int>,
## # quote_count <int>, reply_count <int>, hashtags <list>, symbols <list>,
## # urls_url <list>, urls_t.co <list>, urls_expanded_url <list>,
## # media_url <list>, media_t.co <list>, media_expanded_url <list>,
## # media_type <list>, ext_media_url <list>, ext_media_t.co <list>, …Note that you can increase the argument
n=50to fetch more tweets. The argumentinclude_rts=Ftellsrtweetto not return retweets.
3.1.6 tidyquant
A different wrapper that focuses on financial markets is the tidyquant wrapper. This is a package that facilitates financial analysis, as it focuses on providing the tools to perform stock portfolio analysis at scale.
For our example, we want to plot the stock prices for “AAPL”,‘TSLA’, and ‘ZM’, for 9 months, between January 2021 and September 2021. The function tq_get() returns quantitative data in tibble format:
r = c("AAPL",'TSLA','ZM') %>% tq_get(get = "stock.prices",
                                 from = "2021-01-01",
                                 to = "2021-09-01")
## Registered S3 method overwritten by 'tune':
## method from
## required_pkgs.model_spec parsnip## Warning: `type_convert()` only converts columns of type 'character'.
## - `df` has no columns of type 'character'
## Warning: `type_convert()` only converts columns of type 'character'.
## - `df` has no columns of type 'character'
## Warning: `type_convert()` only converts columns of type 'character'.
## - `df` has no columns of type 'character'r %>% head## # A tibble: 6 × 8
## symbol date open high low close volume adjusted
## <chr> <date> <dbl> <dbl> <dbl> <dbl> <dbl> <dbl>
## 1 AAPL 2021-01-04 134. 134. 127. 129. 143301900 129.
## 2 AAPL 2021-01-05 129. 132. 128. 131. 97664900 130.
## 3 AAPL 2021-01-06 128. 131. 126. 127. 155088000 126.
## 4 AAPL 2021-01-07 128. 132. 128. 131. 109578200 130.
## 5 AAPL 2021-01-08 132. 133. 130. 132. 105158200 131.
## 6 AAPL 2021-01-11 129. 130. 128. 129. 100384500 128.Now we can plot the results:
r %>% gf_line(adjusted ~date,color = ~symbol) %>%
  gf_smooth(se=T, fill = ~symbol)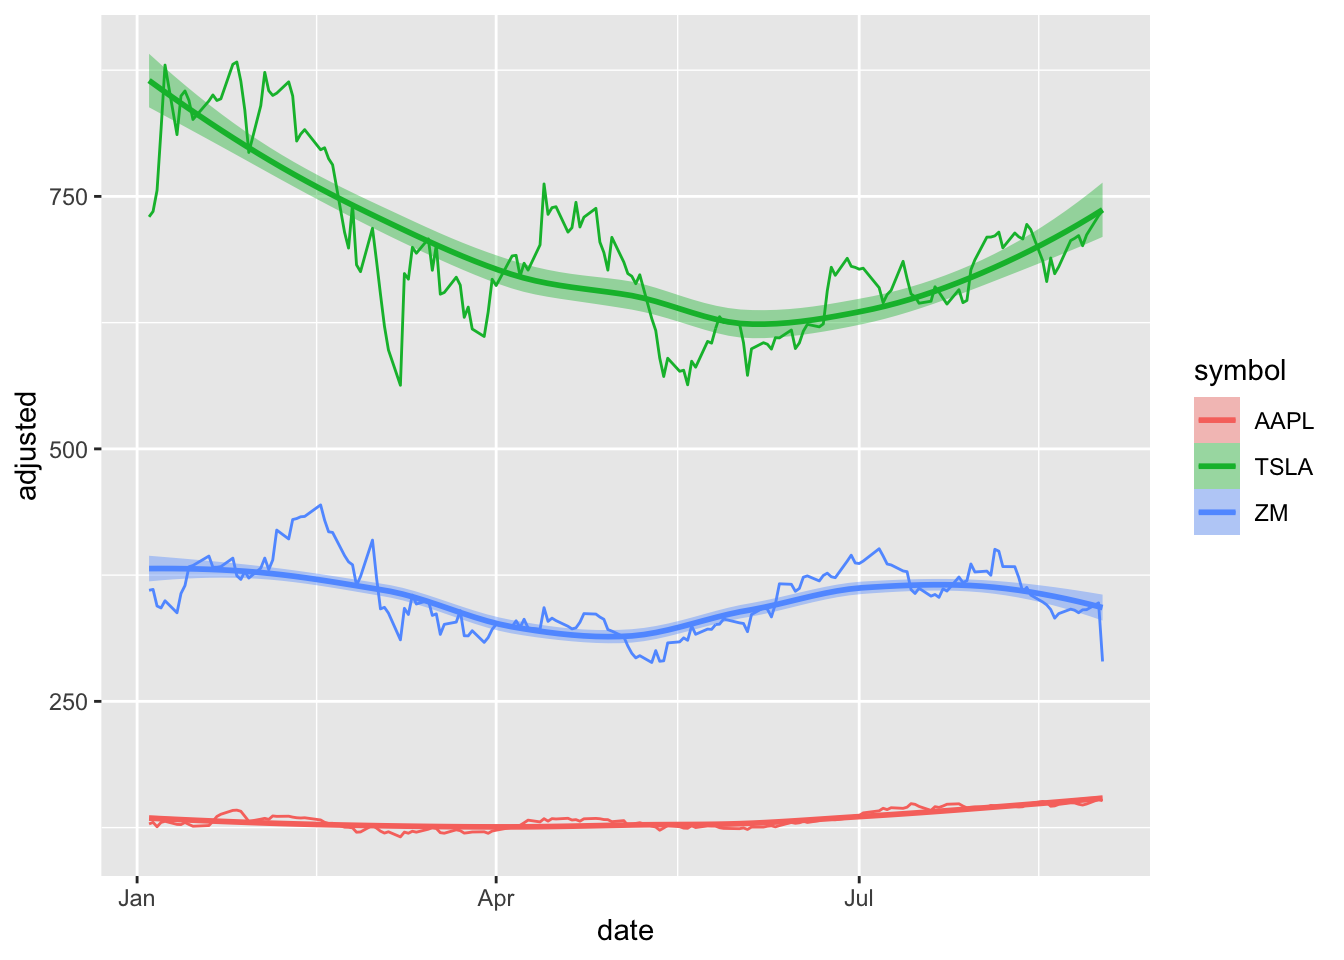
3.2 Web scraping
Web pages are written in various coding languages that web browses can read and understand. When scraping web pages, we deal with their code. This code is often written in three languages: Hypertext Markup Language (HTML), Cascading Style Sheets (CSS), and Javascript.
- HTML code defines the structure and the content of a web page.
- CSS code customizes the style and look of a page.
- Javascript makes a page dynamic and interactive.
In this Section we’ll focus on how to use R to scrape to read the static parts of a webpage that are written in HTML and CSS.
At the end of this Section you can find a brief optional introduction on how to scrape dynamic web pages.
Unlike R, HTML is not a programming language. Instead, it is called a markup language — it describes the content and structure of a web page. HTML is organized using tags, which are surrounded by <> symbols. Different tags perform different functions. Together, many tags form the content of a web page.
When we scrape a web page, we are downloading its HTML, CSS and Javascript code. Hence, in order to extract any useful information from a web page,
we will need to know its HTML structure and target specific HTML and CSS tags that we care about.
3.2.1 Scraping random quotes
Lets start with something very simple. Let’s try to scrape some quotes from http://quotes.toscrape.com/
First, we need to download the contents of the page that we are interested in.
The function read_html() from package rvest does that by reading any webpage from a given URL.
s = read_html("http://quotes.toscrape.com/")
s
## {html_document}
## <html lang="en">
## [1] <head>\n<meta http-equiv="Content-Type" content="text/html; charset=UTF-8 ...
## [2] <body>\n <div class="container">\n <div class="row header-box"> ...Instead of manually exploring HTML tags and trying to identify how to parse valuable information, we can use the Chrome extension SelectorGadget.
In our example, by clicking on the quote text of the http://quotes.toscrape.com/ web page we can identify that they are surrounded by the tag “.text”.
Once we have the relevant tag keyword that we are interested in, we can use the function html_nodes() from the package rvest to extract all the information stored within the tags that we selected. (Note that, the function html_nodes() works particularly well with the SelectorGadget extension.)
s %>% html_nodes(".text")## {xml_nodeset (10)}
## [1] <span class="text" itemprop="text">“The world as we have created it is a ...
## [2] <span class="text" itemprop="text">“It is our choices, Harry, that show ...
## [3] <span class="text" itemprop="text">“There are only two ways to live your ...
## [4] <span class="text" itemprop="text">“The person, be it gentleman or lady, ...
## [5] <span class="text" itemprop="text">“Imperfection is beauty, madness is g ...
## [6] <span class="text" itemprop="text">“Try not to become a man of success. ...
## [7] <span class="text" itemprop="text">“It is better to be hated for what yo ...
## [8] <span class="text" itemprop="text">“I have not failed. I've just found 1 ...
## [9] <span class="text" itemprop="text">“A woman is like a tea bag; you never ...
## [10] <span class="text" itemprop="text">“A day without sunshine is like, you ...This is nice, as we now got all the quotes that we were interested in.
However, we only care about the actual quote text and not about the accompanying HTML tags.
Thankfully, the rvest package offers the function html_text(), which extracts the text out of the html tags:
s1 = s %>% html_nodes(".text") %>% html_text()
s1
## [1] "“The world as we have created it is a process of our thinking. It cannot be changed without changing our thinking.”"
## [2] "“It is our choices, Harry, that show what we truly are, far more than our abilities.”"
## [3] "“There are only two ways to live your life. One is as though nothing is a miracle. The other is as though everything is a miracle.”"
## [4] "“The person, be it gentleman or lady, who has not pleasure in a good novel, must be intolerably stupid.”"
## [5] "“Imperfection is beauty, madness is genius and it's better to be absolutely ridiculous than absolutely boring.”"
## [6] "“Try not to become a man of success. Rather become a man of value.”"
## [7] "“It is better to be hated for what you are than to be loved for what you are not.”"
## [8] "“I have not failed. I've just found 10,000 ways that won't work.”"
## [9] "“A woman is like a tea bag; you never know how strong it is until it's in hot water.”"
## [10] "“A day without sunshine is like, you know, night.”"The result of this process is not a tibble, but instead, a vector of characters:
class(s1)## [1] "character"We can transform a vector into a single-columned tibble, with the function as_tibble_col:
s1 = s %>% html_nodes(".text") %>%  html_text() %>% as_tibble_col("quote")
s1
## # A tibble: 10 × 1
## quote
## <chr>
## 1 “The world as we have created it is a process of our thinking. It cannot be …
## 2 “It is our choices, Harry, that show what we truly are, far more than our ab…
## 3 “There are only two ways to live your life. One is as though nothing is a mi…
## 4 “The person, be it gentleman or lady, who has not pleasure in a good novel, …
## 5 “Imperfection is beauty, madness is genius and it's better to be absolutely …
## 6 “Try not to become a man of success. Rather become a man of value.”
## 7 “It is better to be hated for what you are than to be loved for what you are…
## 8 “I have not failed. I've just found 10,000 ways that won't work.”
## 9 “A woman is like a tea bag; you never know how strong it is until it's in ho…
## 10 “A day without sunshine is like, you know, night.”Inside the function as_tibble_col, we can provide the column name that we want our single-column tibble to have.
The function
as_tibble_colis a member of the larger family of functionsas_tibble. Run?as_tibblein the console for more information.
3.2.2 Binding columns
Let’s assume that besides the quote, we also care about the quote’s author. By using the SelectorGadget extension we identify that the tag “.author” encapsulates the author information:
s2 = s %>% html_nodes(".author") %>% html_text() %>% as_tibble_col("author")
s2
## # A tibble: 10 × 1
## author
## <chr>
## 1 Albert Einstein
## 2 J.K. Rowling
## 3 Albert Einstein
## 4 Jane Austen
## 5 Marilyn Monroe
## 6 Albert Einstein
## 7 André Gide
## 8 Thomas A. Edison
## 9 Eleanor Roosevelt
## 10 Steve MartinNow we have two tibbles, s1 and s2, but we want to combine them so that we get one tibble with columns “quote, author”. The function bind_cols allows us to place the two tibbles side by side:
t = bind_cols(s1,s2)
t
## # A tibble: 10 × 2
## quote author
## <chr> <chr>
## 1 “The world as we have created it is a process of our thinking… Albert Einste…
## 2 “It is our choices, Harry, that show what we truly are, far m… J.K. Rowling
## 3 “There are only two ways to live your life. One is as though … Albert Einste…
## 4 “The person, be it gentleman or lady, who has not pleasure in… Jane Austen
## 5 “Imperfection is beauty, madness is genius and it's better to… Marilyn Monroe
## 6 “Try not to become a man of success. Rather become a man of v… Albert Einste…
## 7 “It is better to be hated for what you are than to be loved f… André Gide
## 8 “I have not failed. I've just found 10,000 ways that won't wo… Thomas A. Edi…
## 9 “A woman is like a tea bag; you never know how strong it is u… Eleanor Roose…
## 10 “A day without sunshine is like, you know, night.” Steve Martin3.2.3 Scraping Yahoo! finance comments and reactions
Next, we will try to do something a little bit more substantial. Assume that we want to create a unique dataset about a set of securities that we care about. Perhaps, we can find some unique information into every day comments and reactions of people who post on the Yahoo! finance board. For instance, assume that we care about the the AAPL stock:
j = read_html("https://finance.yahoo.com/quote/AAPL/community?p=AAPL")
j
## {html_document}
## <html id="atomic" class="NoJs desktop" lang="en-US">
## [1] <head prefix="og: http://ogp.me/ns#">\n<meta http-equiv="Content-Type" co ...
## [2] <body>\n<div id="app"><div class="" data-reactroot="" data-reactid="1" da ...By using the SelectorGadget Chrome extension, we identify the tag “.Pend\(8px\)”, which encapsulates users’ comments/responses:
j1 = j %>% html_nodes(".Pend\\(8px\\)") %>% html_text()
head(j1)
## [1] "Apple (AAPL) recently released the latest version of iOS, the operating system that powers millions of iPhones. And with it comes a feature called SharePlay, which Apple has been previewing since its big developers conference back in June. I love This Platform https://perfectroi.today/x8gjgn ! This is the most amazing piece of software I have ever used. Totally customizable and incredibly powerful. There is very little I want that it doesn't already have."
## [2] "apple just hired Tesla's autopilot software director. fabulous news."
## [3] "WOW!! Who bought 7 400 000 AAPL shares for $1,117,992,000 at close! ??Similar transaction yesterday..."
## [4] "Every other fang stock moves up and down so fast except Apple, another tight range on Friday! Just take a look at fb, Amazon, msft, tesla, goog and more!"
## [5] "How can qcomm beat like that and have no supply issues in this environment. Sounds like Tim and Luca just being super conservative as always with next quarter. I’m thinking supply chain getting better and Apple going to have a blowout holiday quarter."
## [6] "WE posted \"A move stays on the board.\" This week the profits on the Nov 5 algorithim is just one example.WE posted AAPL is undervalued at $150.Our target is $160.AAPL has printed $157 twice. AAPL trades in trends of three.WE have no time table on this."Let’s now add an additional column in the tibble that identifies the symbol of the stock:
d = j %>% html_nodes(".Pend\\(8px\\)") %>%
  html_text() %>% as_tibble_col("comment") %>%
  mutate(stockCode = "AAPL")
head(d)
## # A tibble: 6 × 2
## comment stockCode
## <chr> <chr>
## 1 "Apple (AAPL) recently released the latest version of iOS, the oper… AAPL
## 2 "apple just hired Tesla's autopilot software director. fabulous ne… AAPL
## 3 "WOW!! Who bought 7 400 000 AAPL shares for $1,117,992,000 at clo… AAPL
## 4 "Every other fang stock moves up and down so fast except Apple, ano… AAPL
## 5 "How can qcomm beat like that and have no supply issues in this env… AAPL
## 6 "WE posted \"A move stays on the board.\" This week the profits on … AAPL3.2.4 Repetitive operations with purr::map
Often we are not interested only in a single stock, but instead, we want to collect information on multiple stocks. One way to do this would be to manually go and update each time the URL of the stock that we care about. However, this is not particularly efficient, or sustainable, especially when we are dealing with hundreds of stocks.
Luckily, the tidyverse package purr and its family of functions map() allow us to perform such repetitive operations efficiently. Specifically the map() function transforms the input object by applying a given function to each element of the input. For instance, we can apply the function nchar to each comment we scraped by calling map():
d %>% select(comment) %>% map(nchar)## $comment
## [1] 529 69 104 153 251 252 94 104 318 490 146 110 378 295 198 187 259 58 121
## [20] 177Function
nchar(x)calculates the number of cahracters ofx.
Function map() returns an object of type list.
However, we often would like to get different results. For instance, we might want to estimate the average number of characters of each comment. The function map_dbl allows us to get this value directly as double, instead as a list:
d %>% select(comment) %>% map(nchar) %>% map_dbl(mean)## comment
## 214.653.2.5 Custom R functions
Now back to our original problem. Based on what we have seen so far, it would have been nice to use the map function and apply the same process repeatedly to different stocks to extract their comments and reactions into one unified tibble. But how can we do this? What function goes on yahoo finance and extracts the information we want for an arbitrary set of stocks?
This is a rhetoric question: there isn’t a function that does that. But luckily, we can create our own unique function to do so:
getYahooFinanceComments = function(stockSymbol){
  j = read_html(paste("https://finance.yahoo.com/quote/",stockSymbol,"/community?p=", stockSymbol, sep=""))
  j = j %>% html_nodes(".Pend\\(8px\\)") %>%
    html_text() %>% as_tibble_col("comment") %>%
    mutate(stockCode = stockSymbol)
  return(j)
}
There are some things to point out here:
- The keyword
function(){}identifies that this will be a custom R function. - The name
getYahooFinanceCommentsis arbitrary. You can give your function any name you like. - Inside the parentheses of
function(), a function can have any number of parameters. - Inside the brackets
{}we identify the functionality of the function. If a function has parameters, these parameters are accessed and used inside the brackets{}. - The special keyword
return()returns the result of the function. This result can be a tibble, a vector, a number, a string, or any other R object we would like it to be. - To define the function you will have to run it. If you update the code of the function, you will need to re-rerun it in order for the updates to take effect.
Inside the
getYahooFinanceCommentscustom function we use for the first time in this book the functionpaste(). This function concatenates vectors after converting them to characters. Runpaste("one","apple")to see the result. Then re-run it with the optionsep="_"as follows:paste("one","apple", sep="_").
Function getYahooFinanceComments consolidates the steps we discussed above and returns a final tibble with two columns for a given stock symbol.
For clarity, this is what the paste() function does inside read_html:
stockSymbol = "ZM"
paste("https://finance.yahoo.com/quote/",stockSymbol,"/community?p=", stockSymbol, sep="")
## [1] "https://finance.yahoo.com/quote/ZM/community?p=ZM"Once a function is defined in our environment, we can call it, similarly to how we call any other R function such us filter, summarize, mean, and so on. For instance, I can call the new function getYahooFinanceComments on the TSLA stock:
resultTibble = getYahooFinanceComments("TSLA")
resultTibble
## # A tibble: 20 × 2
## comment stockCode
## <chr> <chr>
## 1 "I don’t care where the stock price goes today or tomorrow. I’m wi… TSLA
## 2 "Ahahaha Elon Musik did twitter for $GME TY Elon, will buy more $T… TSLA
## 3 "THIS WEEK Tesla will be reporting the number of deliveries for th… TSLA
## 4 "Circuits in all markets will break today. Historic. This is wonde… TSLA
## 5 "bBeing evasive and coy has worked for Tesla/Musk for almost 10 ye… TSLA
## 6 "CEO from $TSLA new vendor $OZSC, \"Right now companies like Tesla… TSLA
## 7 "May 27, 2020 - Tesla cuts prices on ALL Models July 2, 2020 - Te… TSLA
## 8 "Recently, Goldman Sachs upgraded $TSLA to a buy, and gave a new p… TSLA
## 9 "#MARA Montana Business Digest: Marathon Digital \"Flips the Switc… TSLA
## 10 "$TSLA beats Q1 earnings:$0.93 non-GAAP EPS vs consensus $0.80EPS … TSLA
## 11 "Tesla paradox alert: Tesla claims they will grow 50% yoy for mul… TSLA
## 12 "Tesla's market cap is now higher than Berkshire Hathaway. Sales (… TSLA
## 13 "Join the NIO opportunity... TSLA shipped 90K cars per Q1NIO shipp… TSLA
## 14 "A short squeeze is a rapid increase in the price of a stock owing… TSLA
## 15 "Goldman Sachs Upgrades $TSLA to Buy, price target to $780 on Impr… TSLA
## 16 "As a former short of this stock I learned the hard way. That is t… TSLA
## 17 "Morgan Stanley upgrades $TSLA to Overweight, raises price target … TSLA
## 18 "Elon says Tesla is \"open\" to selling software and drive train c… TSLA
## 19 "If you bought a TESLA when the stock IPO’d you would have paid ju… TSLA
## 20 "I have a great feeling we’re going to see some nice gains tomorro… TSLA3.2.6 Combining custom functions with map
Now, we can use the function map along with our custom function getYahooFinanceComments to scrape multiple stocks with one simple command, without manually adjusting the code.
Specifically, we will use the function map_dfr that will return the result as a single tibble (data frame):
d = c("AAPL",'TSLA','ZM') %>% map_dfr(getYahooFinanceComments)
d %>% head
## # A tibble: 6 × 2
## comment stockCode
## <chr> <chr>
## 1 "Apple (AAPL) recently released the latest version of iOS, the oper… AAPL
## 2 "apple just hired Tesla's autopilot software director. fabulous ne… AAPL
## 3 "WOW!! Who bought 7 400 000 AAPL shares for $1,117,992,000 at clo… AAPL
## 4 "Every other fang stock moves up and down so fast except Apple, ano… AAPL
## 5 "How can qcomm beat like that and have no supply issues in this env… AAPL
## 6 "WE posted \"A move stays on the board.\" This week the profits on … AAPL3.3 Optional and Advanced: Scraping dynamic pages with R Selenium
So far we have talked about scraping static web pages. Often, many of the pages that we care about are dynamic (interactive). In those cases, we need more advanced techniques to web scrabe.
The package RSelenium automates web browser’s actions and facilitates the scraping of dynamic web pages.
First we need to install and load the package:
install.packages("RSelenium")
library(RSelenium)
For RSelenium to work we need to use a browser driver (code that mimics a browser).
Hence, we will install a Firefox webdriver (this is different than your browser).
Download it from here (make sure you also have a Firefox on your machine): https://github.com/mozilla/geckodriver/releases/tag/v0.27.0
Store the driver in your Rmd folder.
If you do not have
Javainstalled on your machine, you will also need to download a recent JDK from here: https://www.oracle.com/java/technologies/javase-jdk15-downloads.html
Once you complete the setup, you can run the following, and you should observe a Firefox browser opening up:
driver<- rsDriver(browser=c("firefox"),port=4449L)
remDr <- driver[["client"]]
Next we can use the command navigate to visit a URL. Let us visit the Yahoo! finance main web page (by running this code, you should be able to see the webpage in your Firefox browser):
remDr$navigate("https://finance.yahoo.com")Assume that our goal is to be able to search anything on the Yahoo! finance. We first need to identify the tags of the search box.
Similar to the SelectorGadget chrome extension, you can install on chrome the Selenium IDE extension. This extension will allow you to record your actions, and extract the necessary tags.
Function findElement allows us to identify the element that we are looking for. Here, the next line, identifies the position of the Yahoo! finance search box in the main page:
search_box <- remDr$findElement(using = 'id', value = 'yfin-usr-qry')Once we have identified the location of the search box, we can send to it any information we want to search for with the function sendKeysToElement(). For instance, the ETF VTI:
search_box$sendKeysToElement(list("VTI"))With the previous command, you should be able to see the letters VTI appearing in the search box. Mind-blowing right? :)
Now we will identify the search box tag, and then click on it with the function clickElement:
clickSearch <- remDr$findElement(using = 'css', value = "#header-desktop-search-button > .Cur\\(p\\)")
clickSearch$clickElement()RSelenium here: https://cran.r-project.org/web/packages/RSelenium/RSelenium.pdf
For comments, suggestions, errors, and typos, please email me at: kokkodis@bc.edu