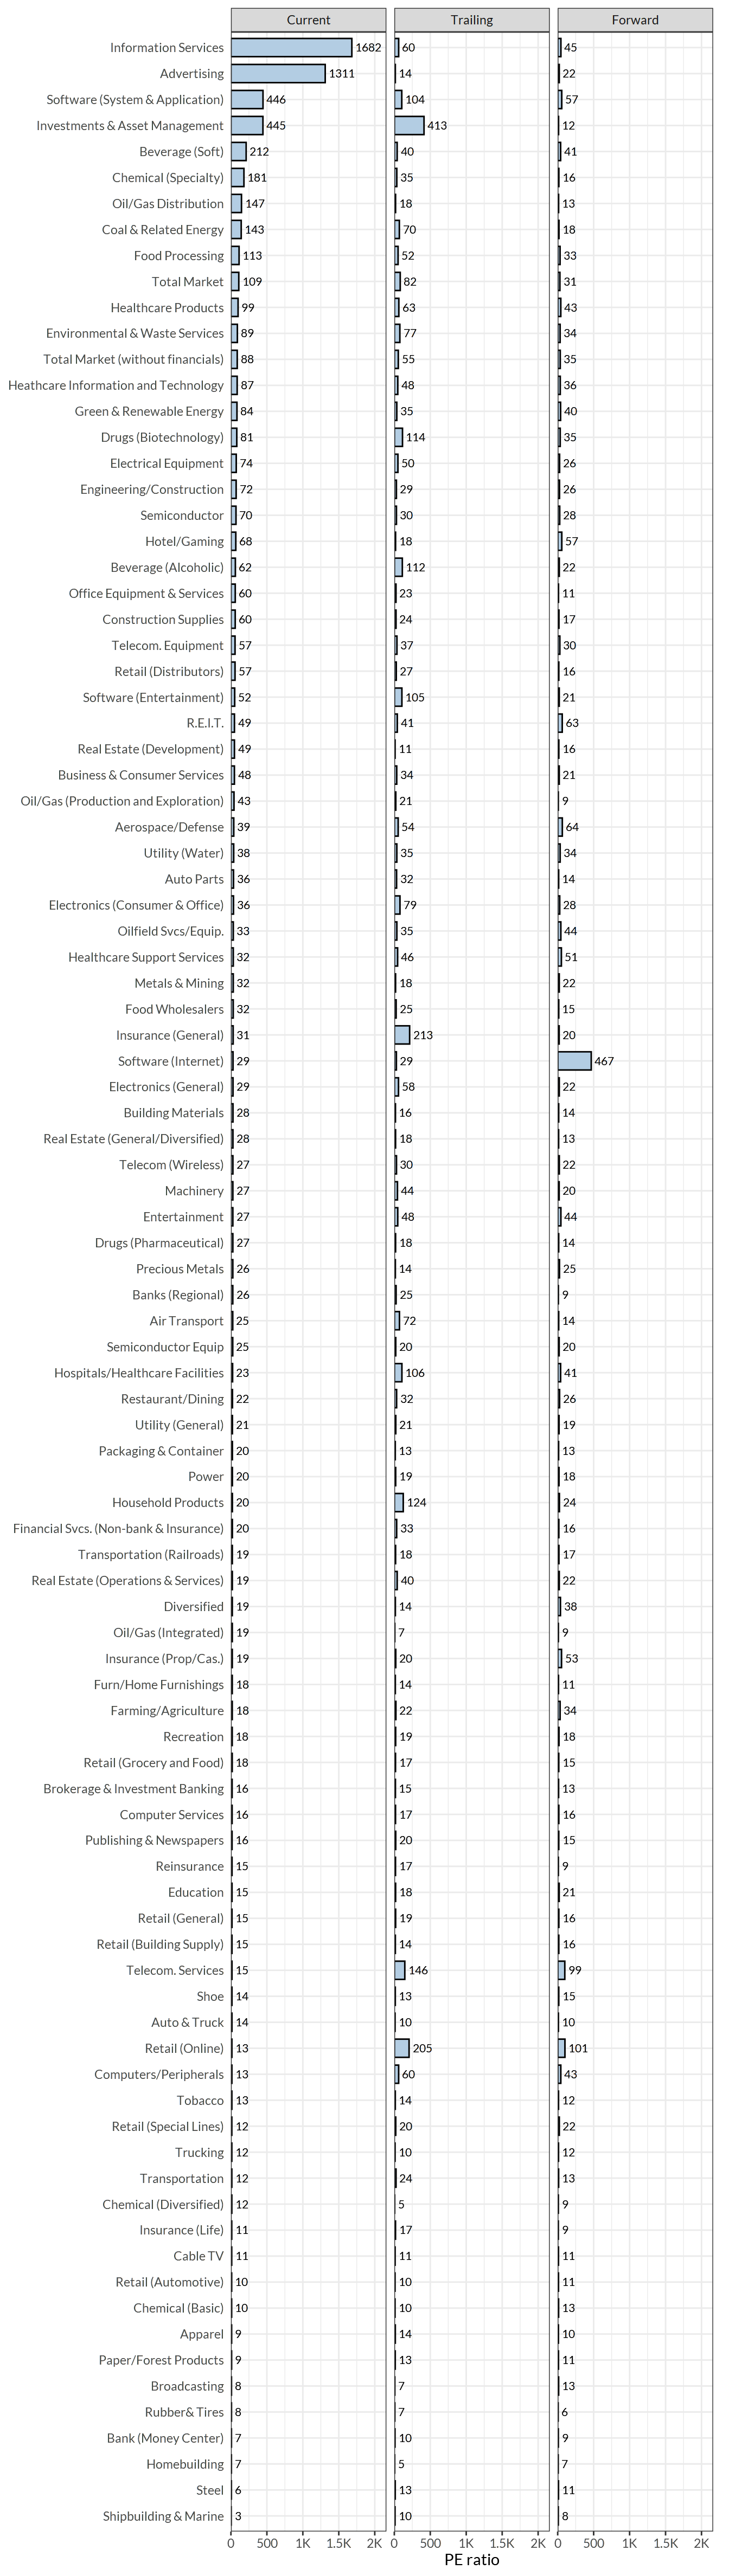
Figure 9.1: Current, trailing, and forward PE ratio by industry sector (note the x-axis is in log scale)
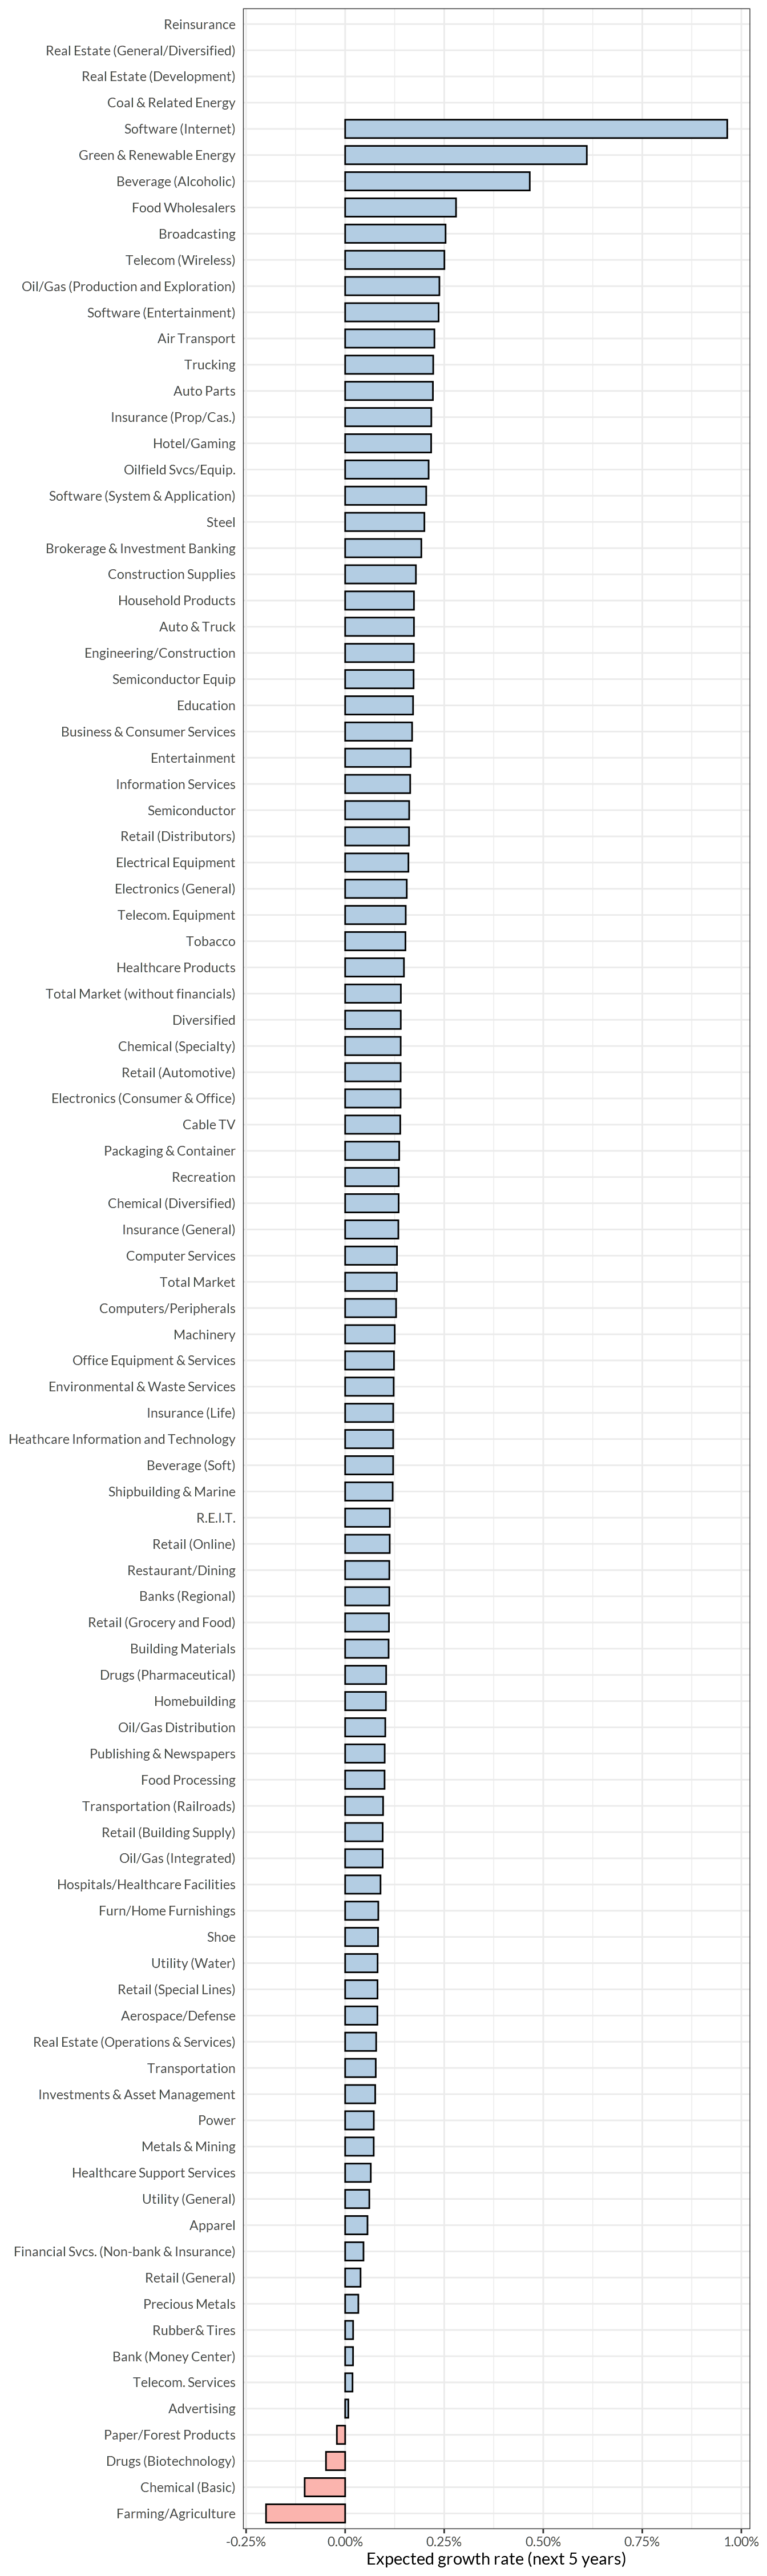
Figure 9.2: Expected growth rate for the next 5 years by industry sector
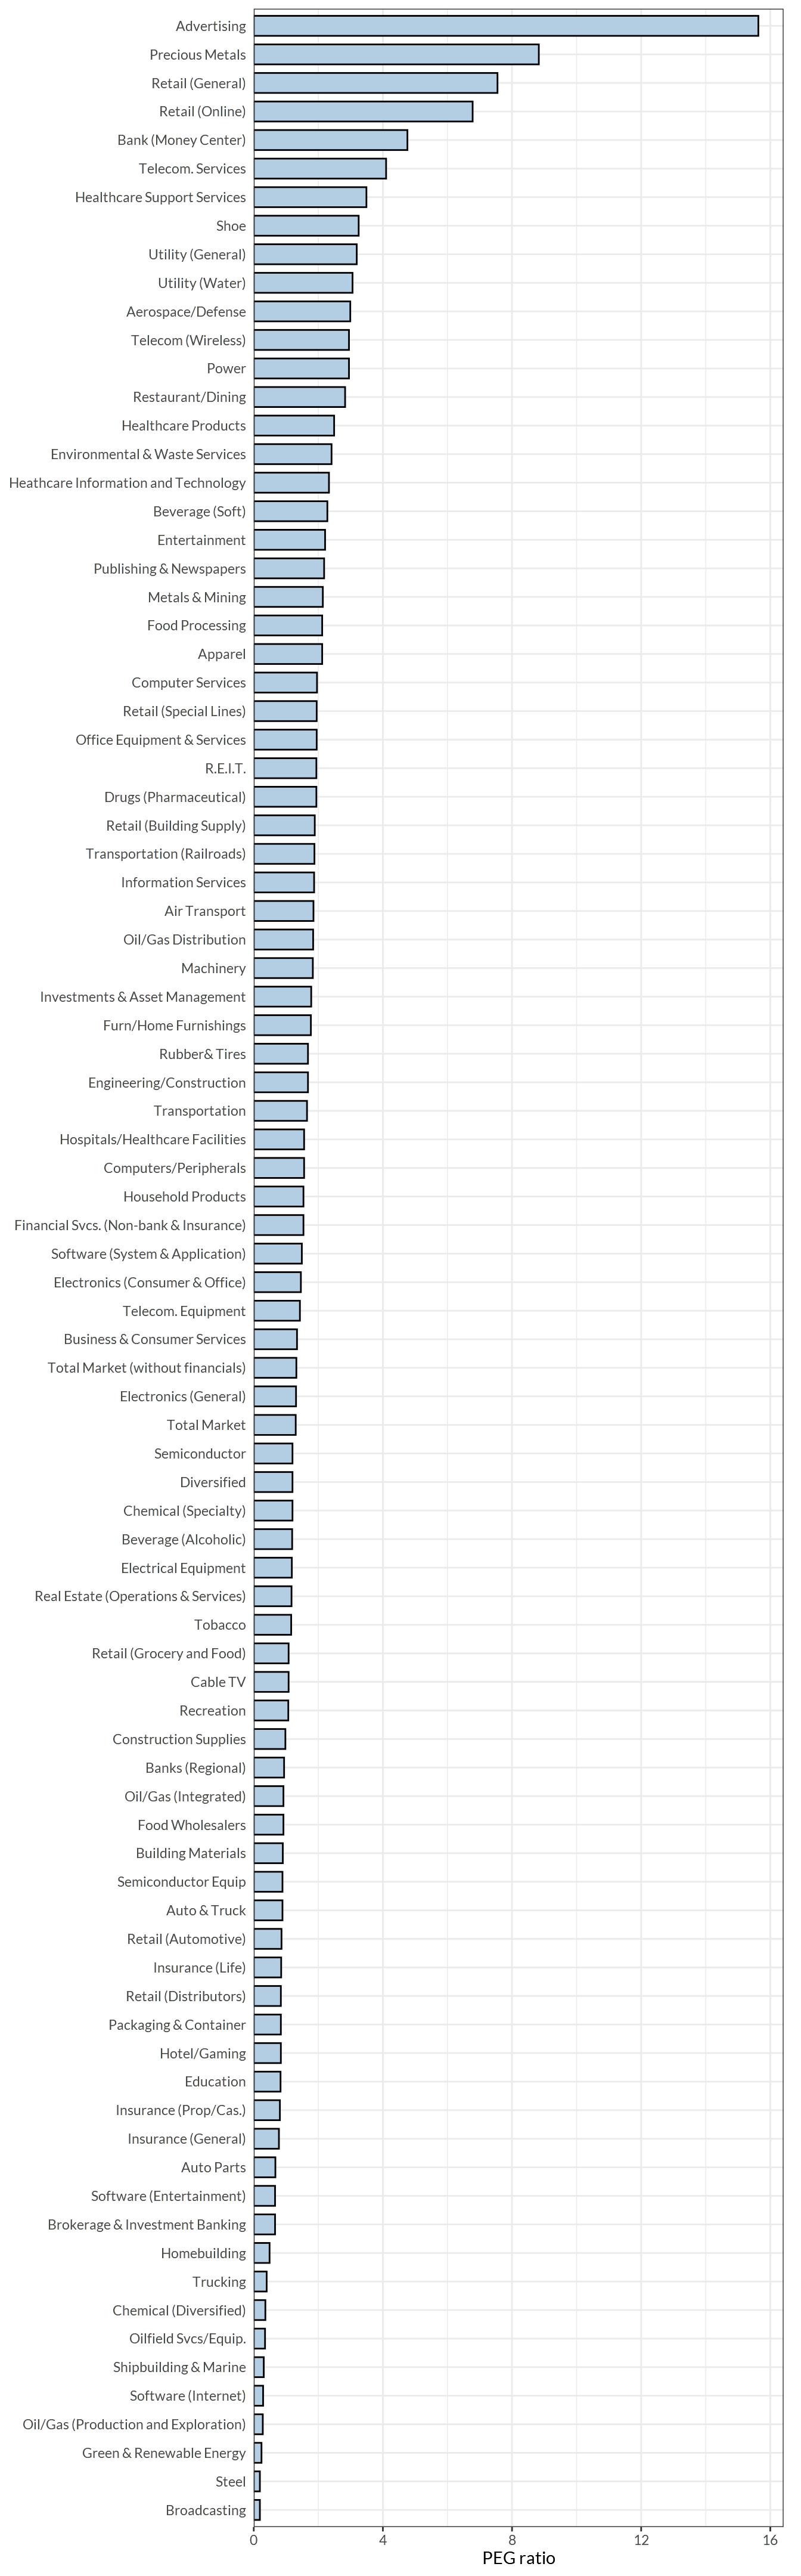
Figure 9.3: PEG ratio by industry sector
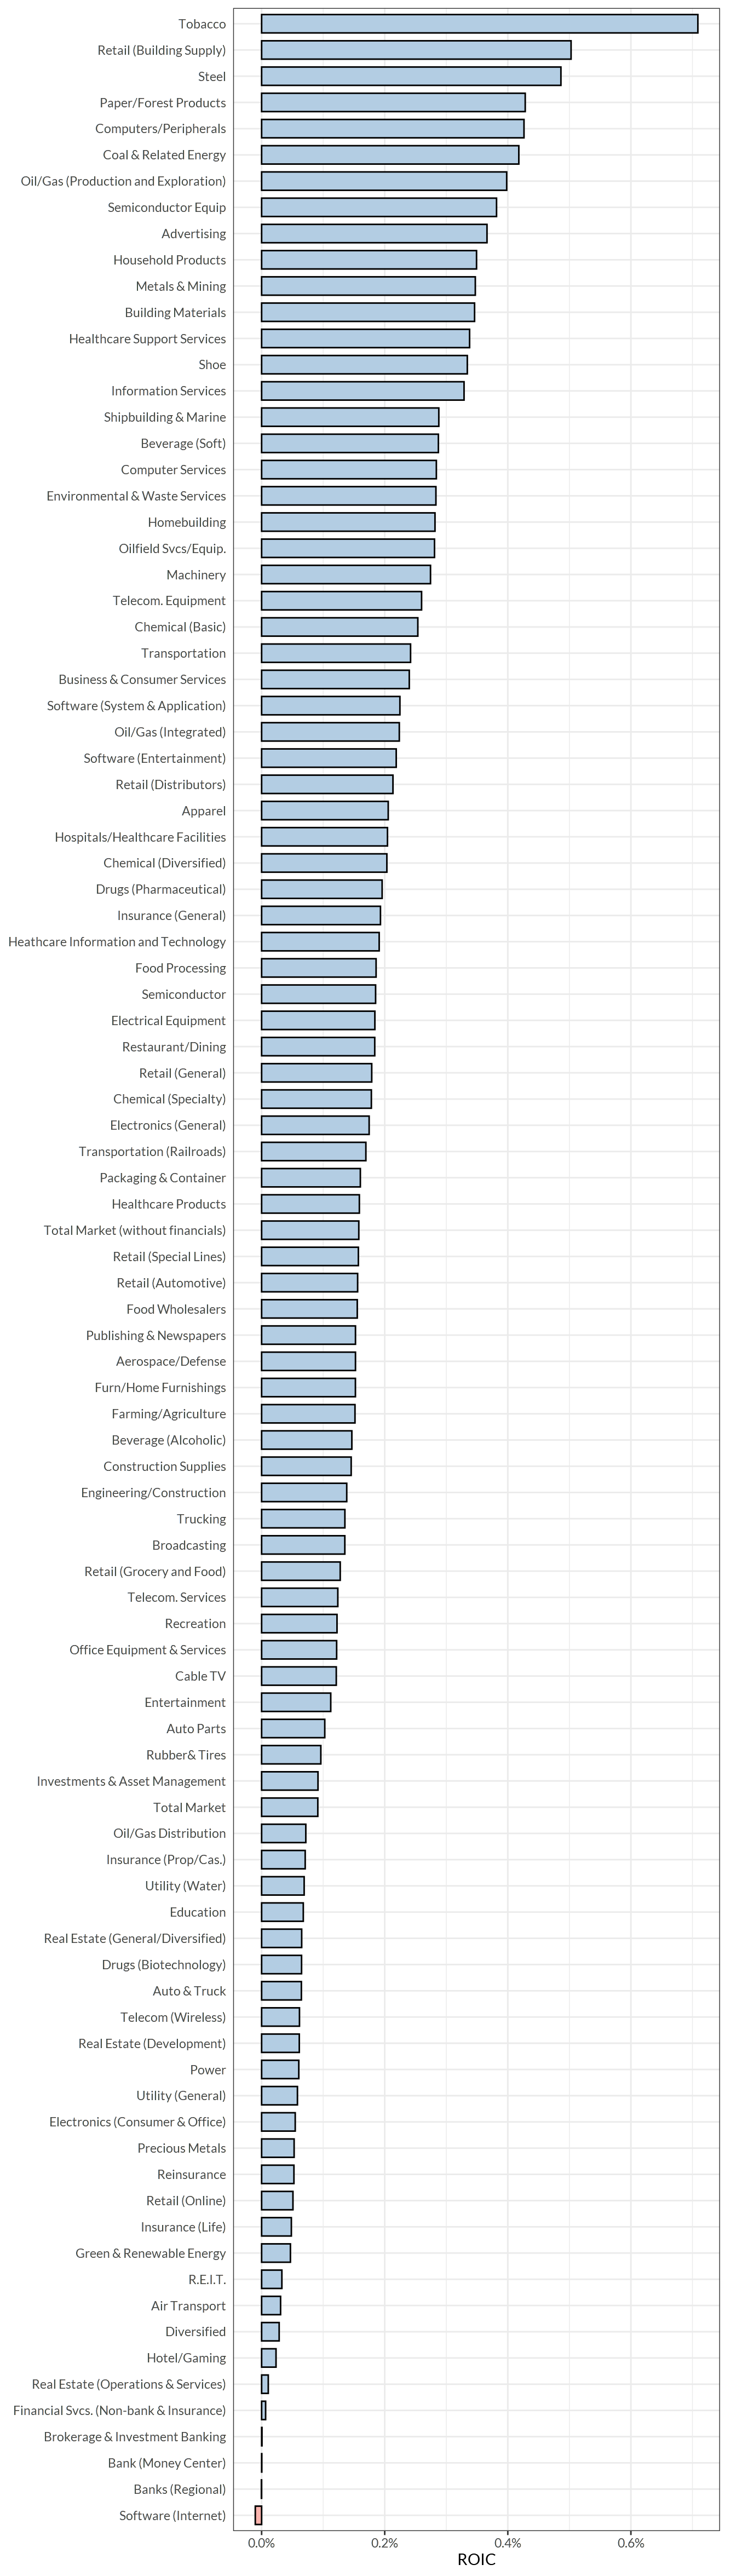
Figure 9.4: Return on invested capital by industry sector
Data are from here and here. All data are based on U.S. companies.↩︎