Chapter 11 Market evaluation
11.1 Market capitalization12
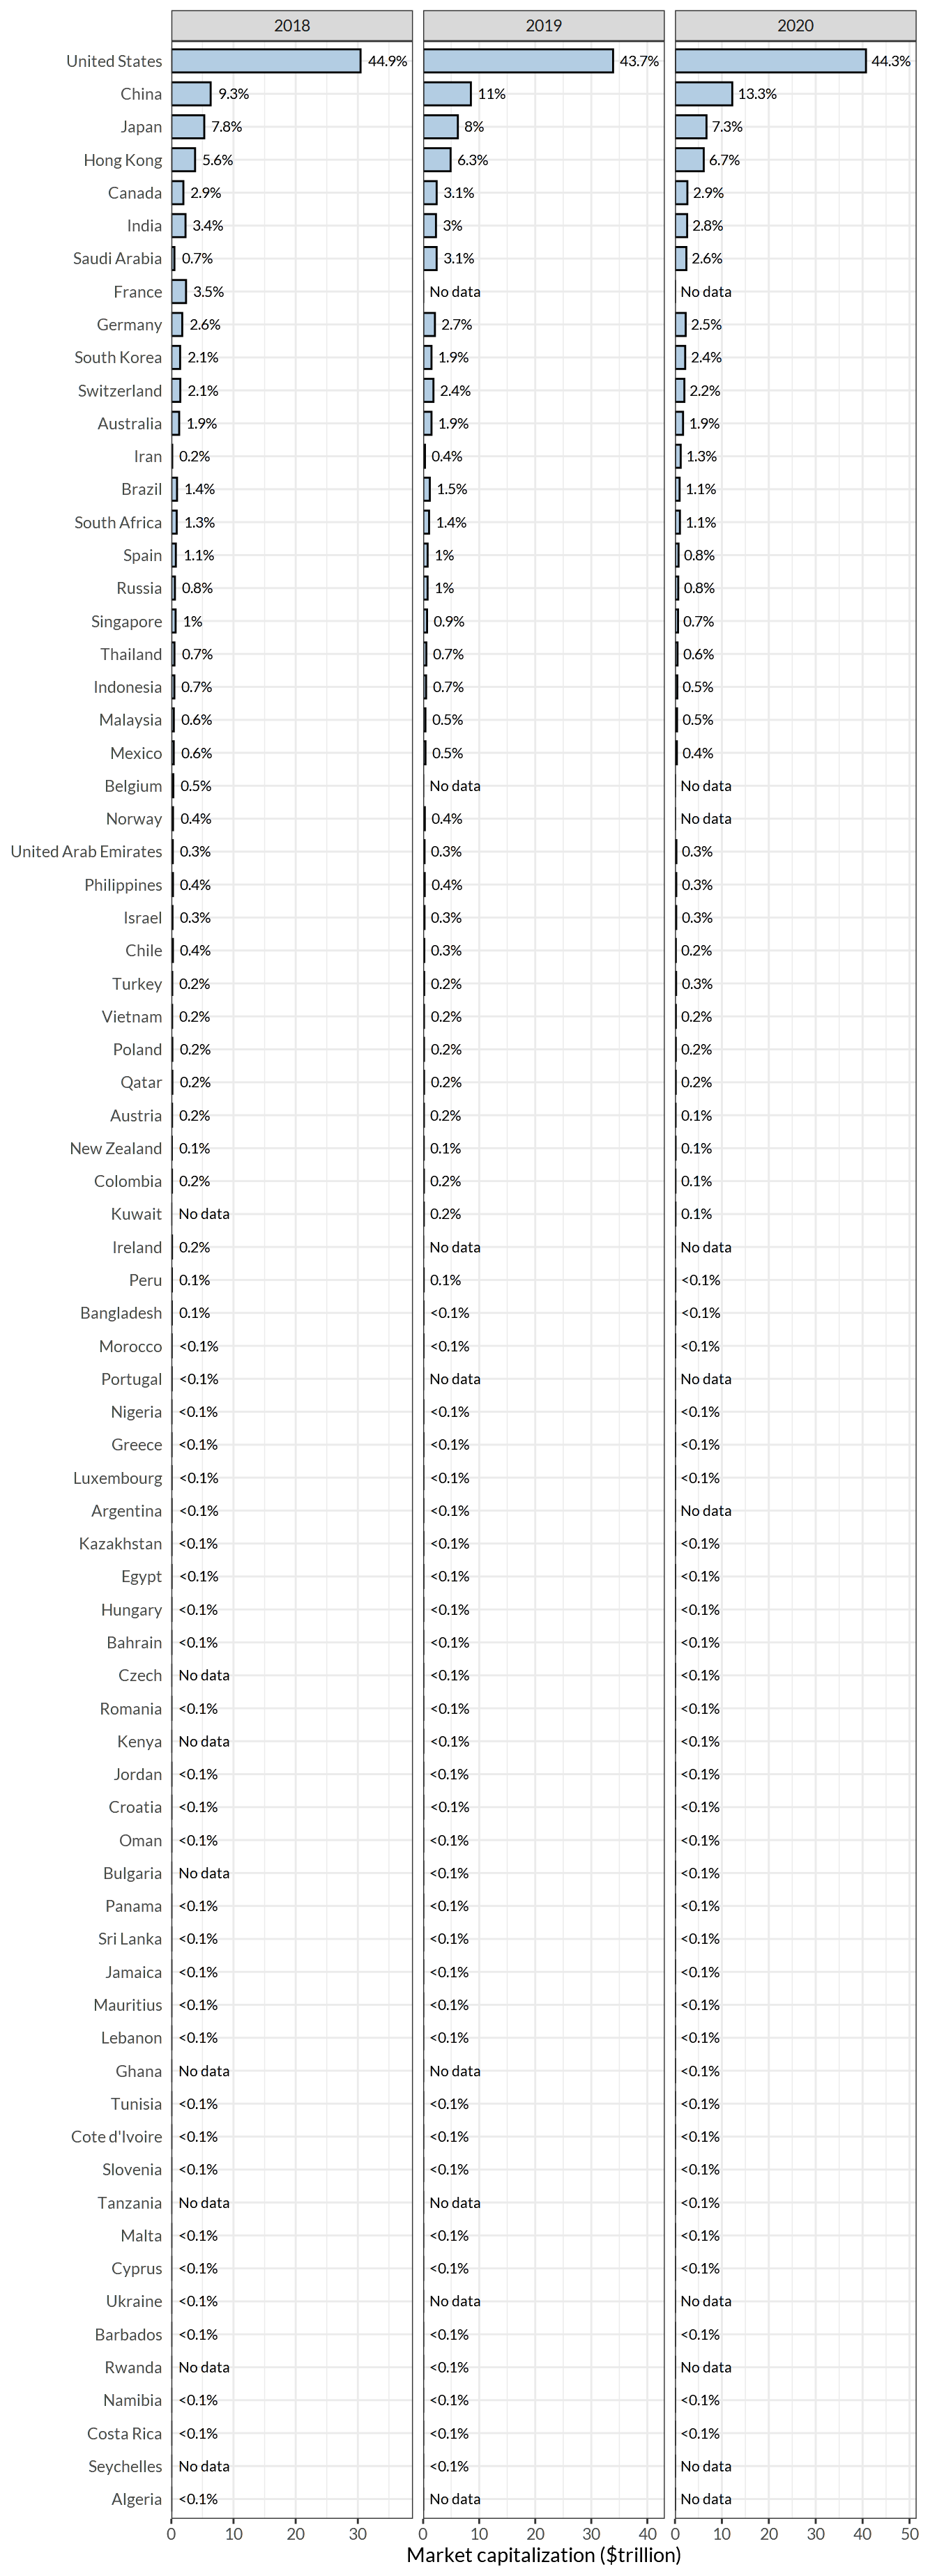
Figure 11.1: Market capitalization of listed domestic companies across 75 major markets (approximate proportions of the global market capitalization are shown on the right side of each bar)
11.2 GDP and market capitalization13
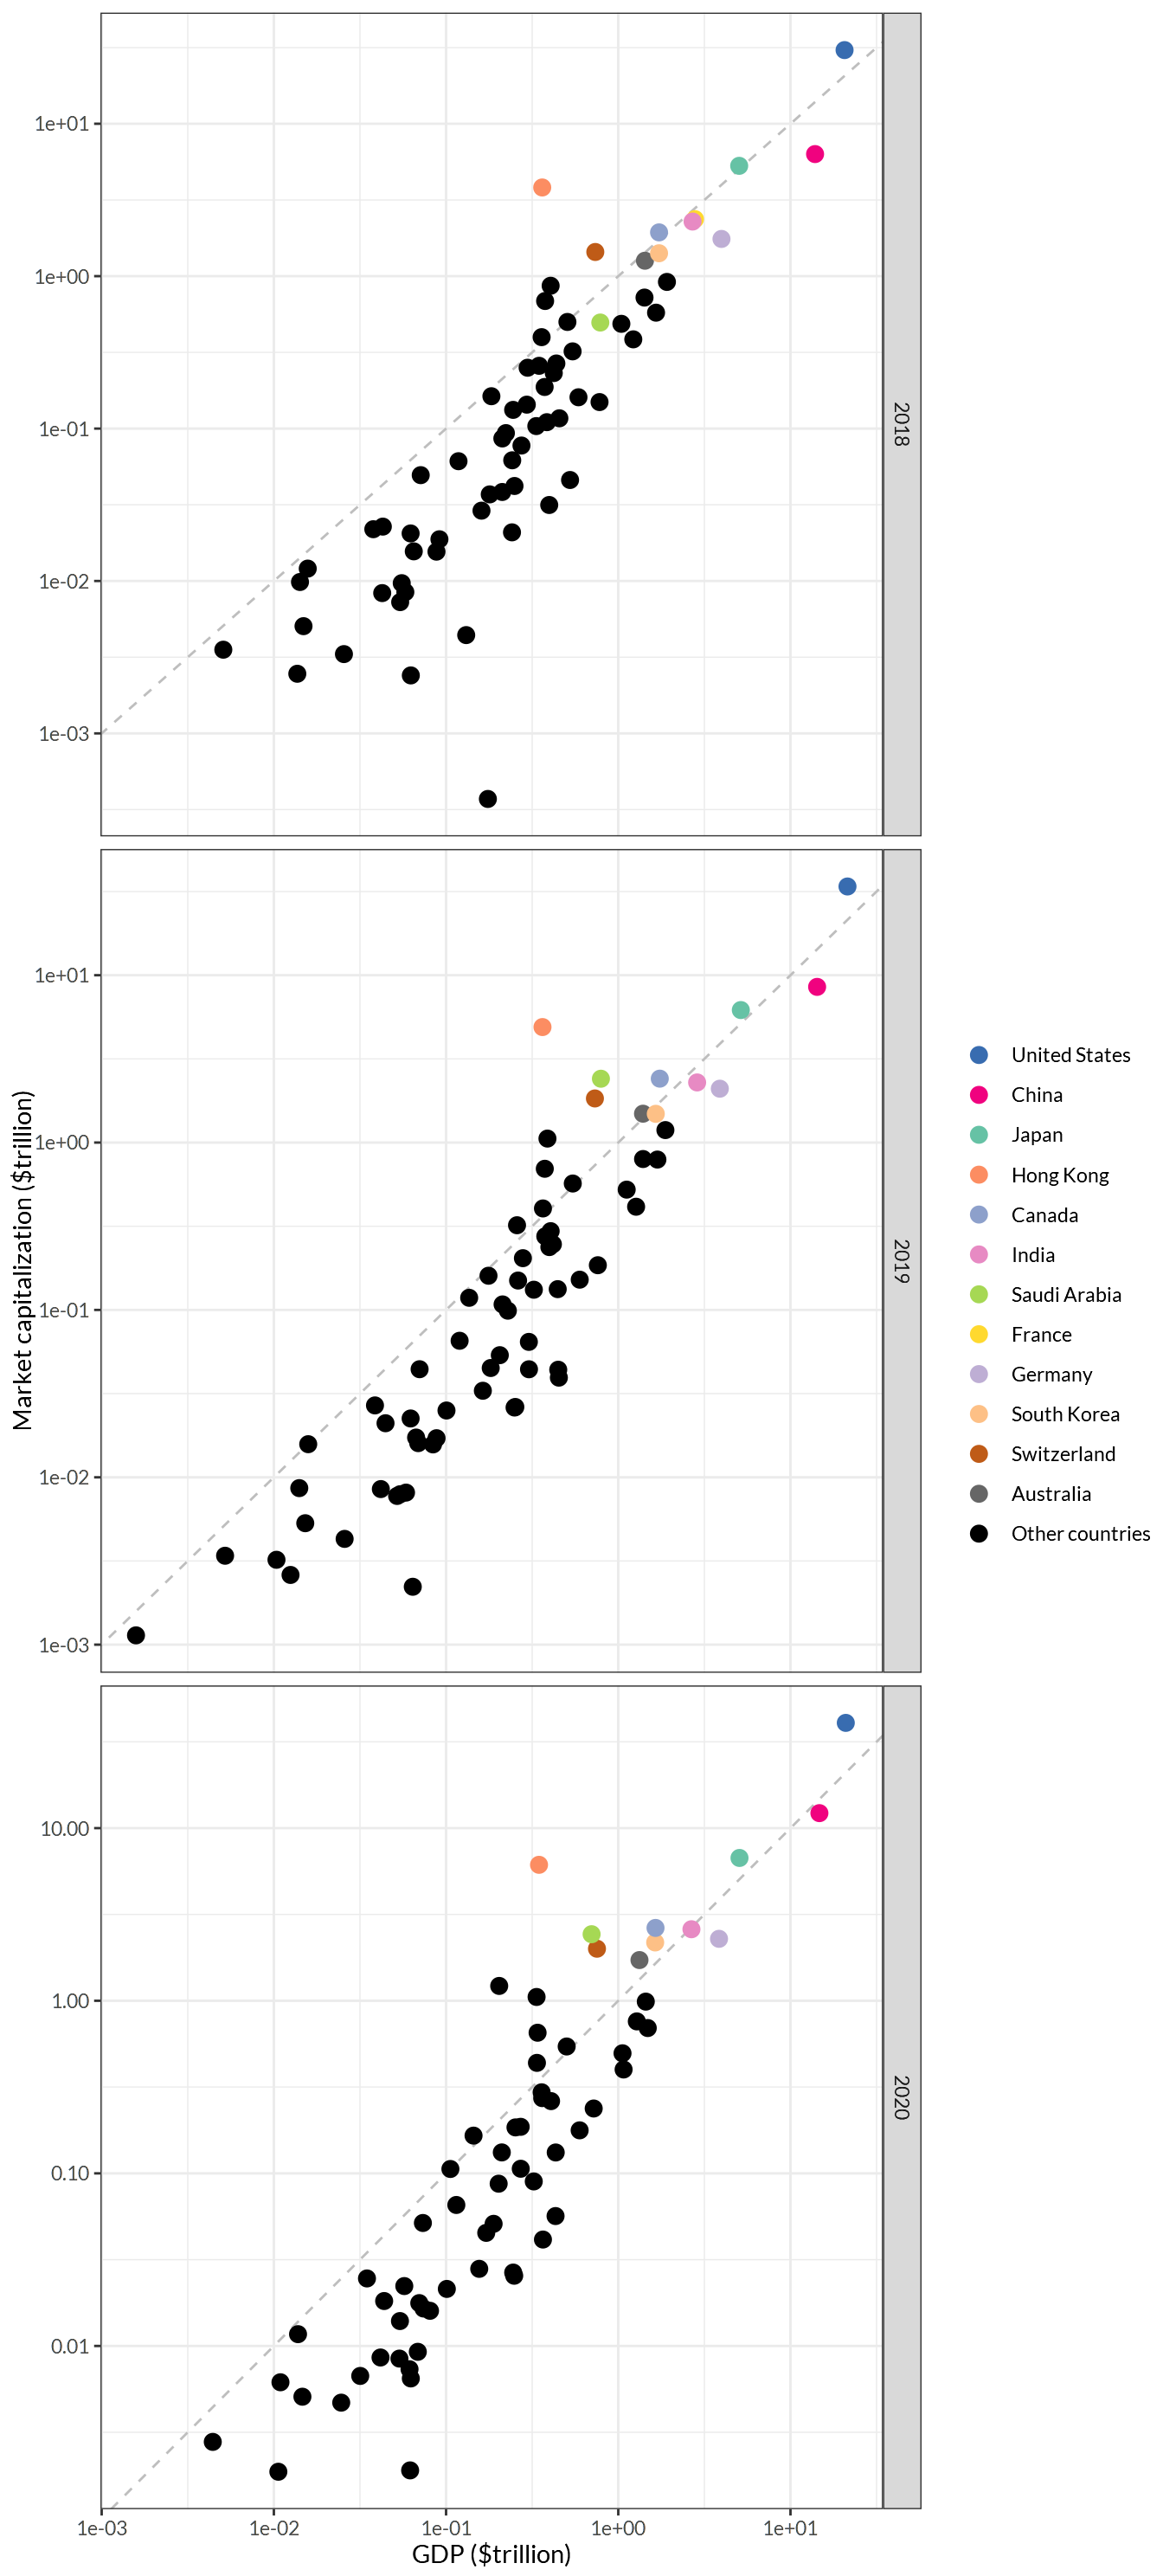
Figure 11.2: Market capitalization relative to GDP across 75 major countries
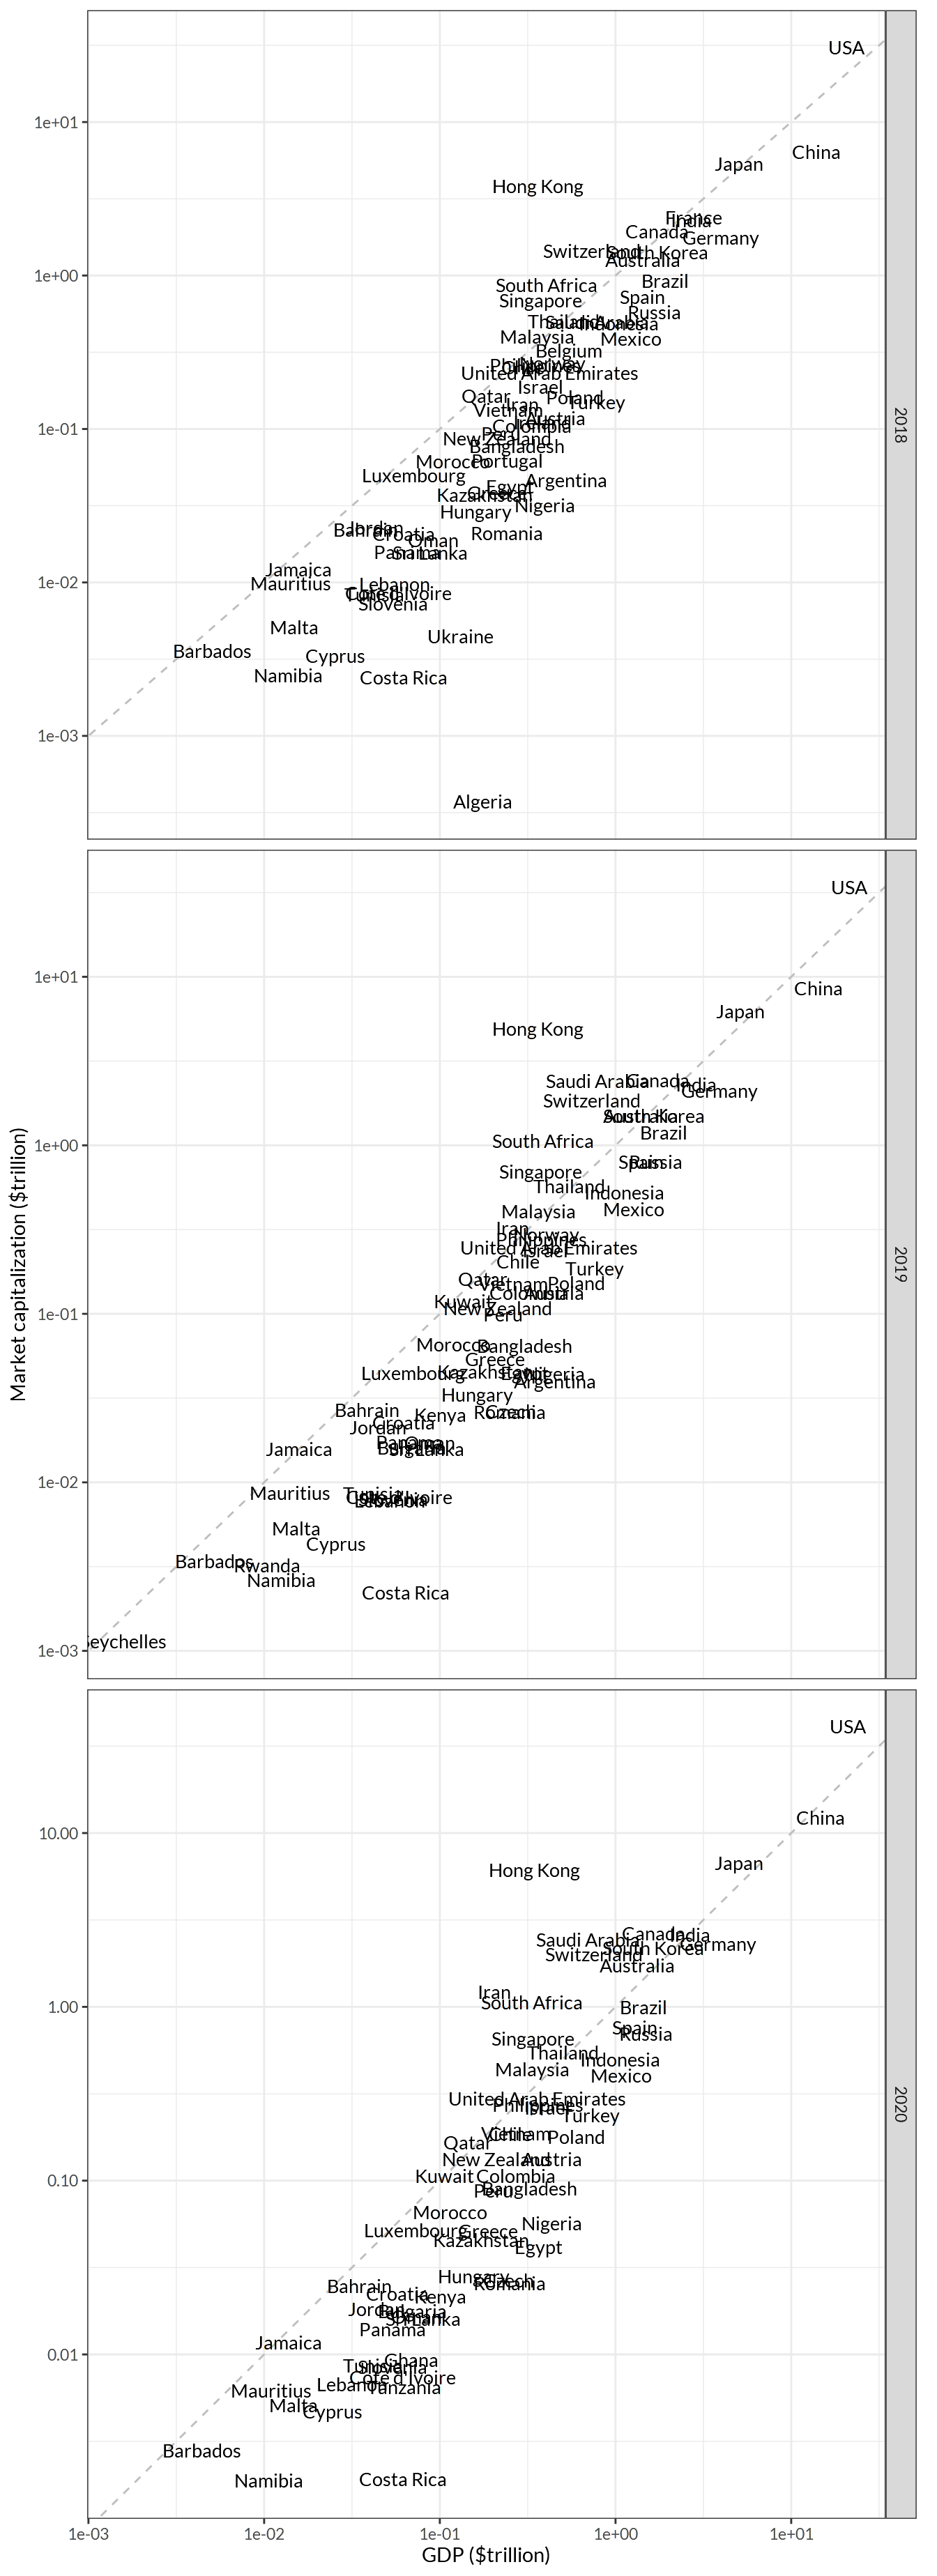
Figure 11.3: Same data as in Figure 11.2
11.3 GDP and Buffett indicator14
Figure 11.4: GDP and Buffett indicator across 26 major countries
11.4 Market valuation15
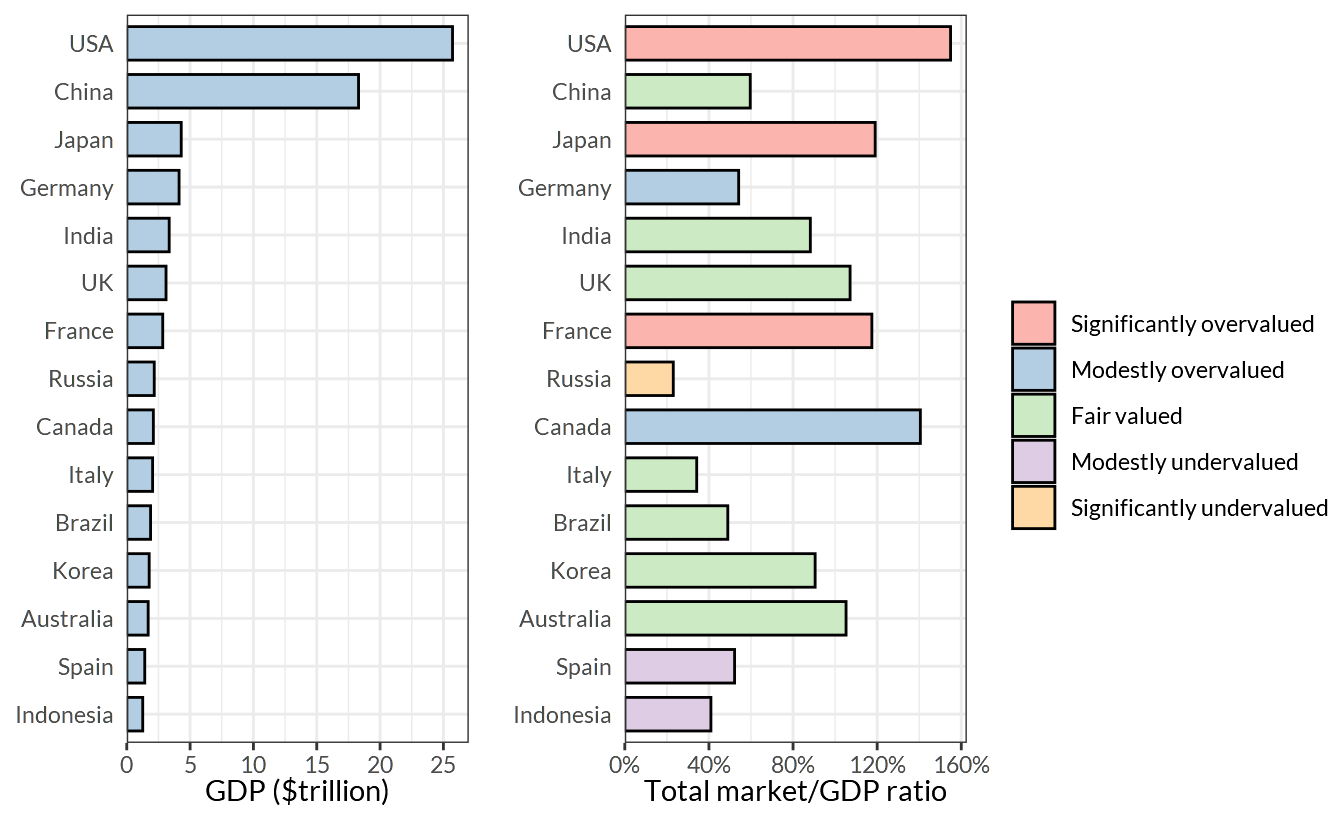
Figure 11.5: Market valuation for 15 major countries
11.5 Projected annual return16
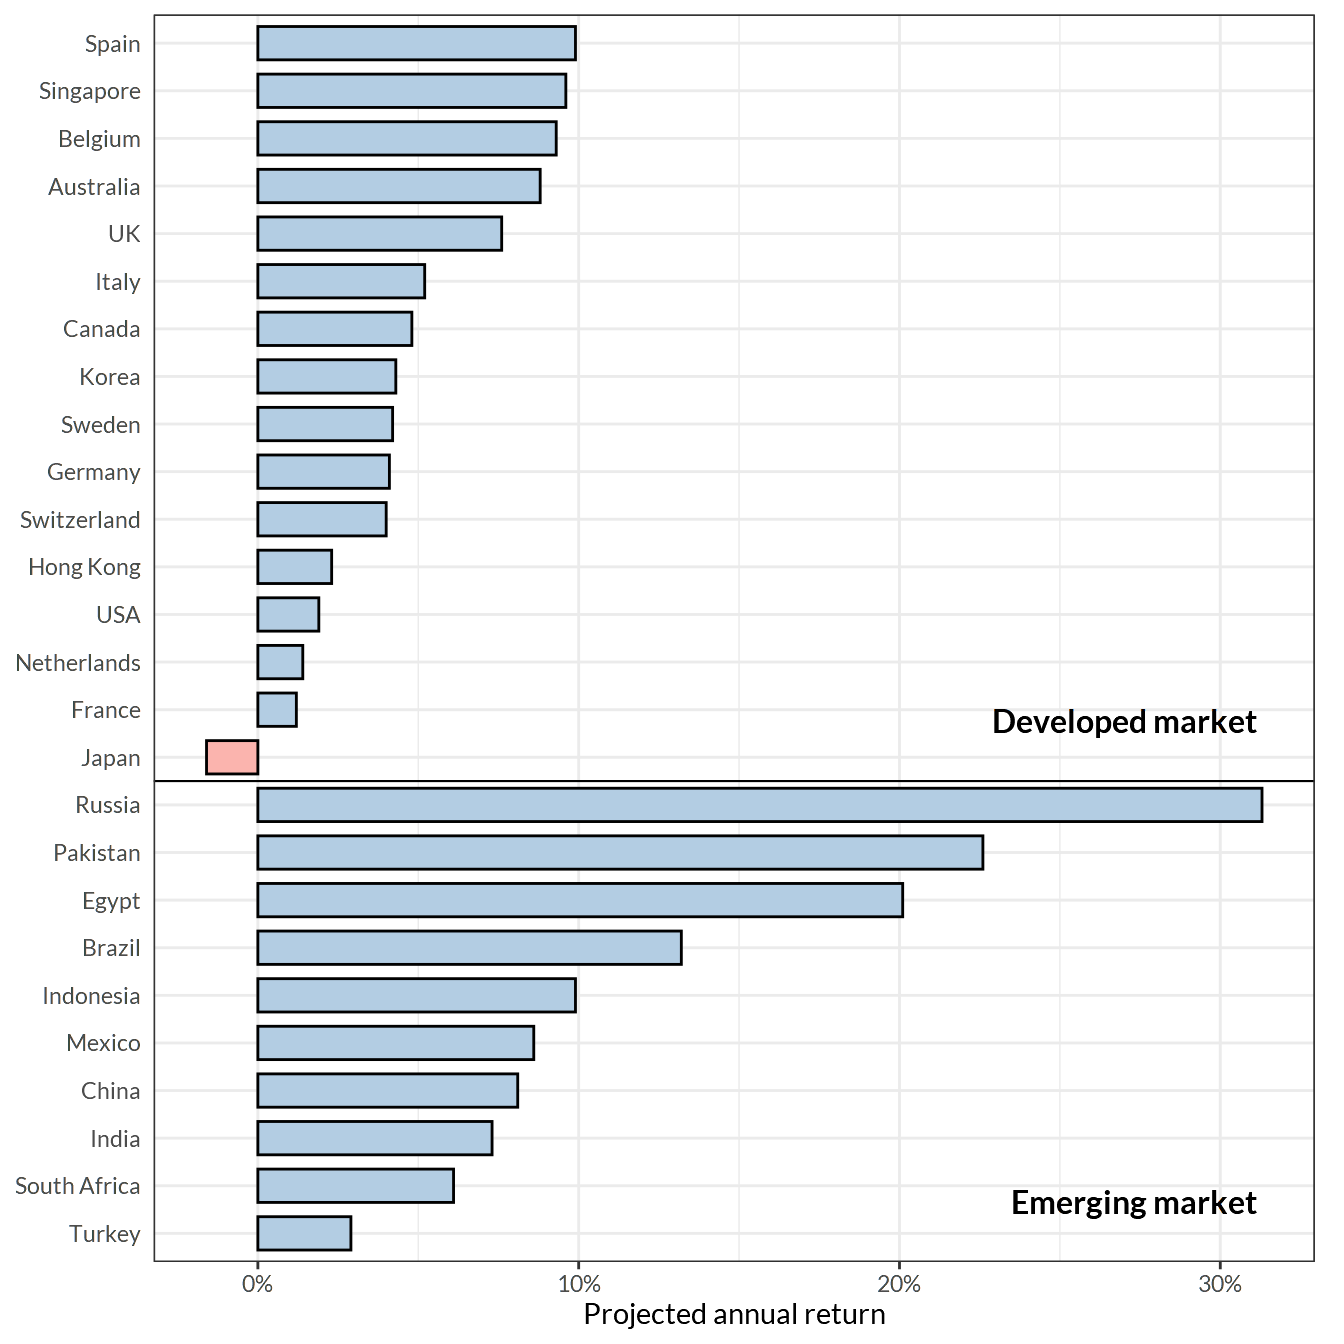
Figure 11.6: Projected future annual returns of the world’s 18 largest stock markets, calculated using (1) future business growth estimates, (2) dividends, and (3) change in market valuation
11.6 U.S. stock market valuation
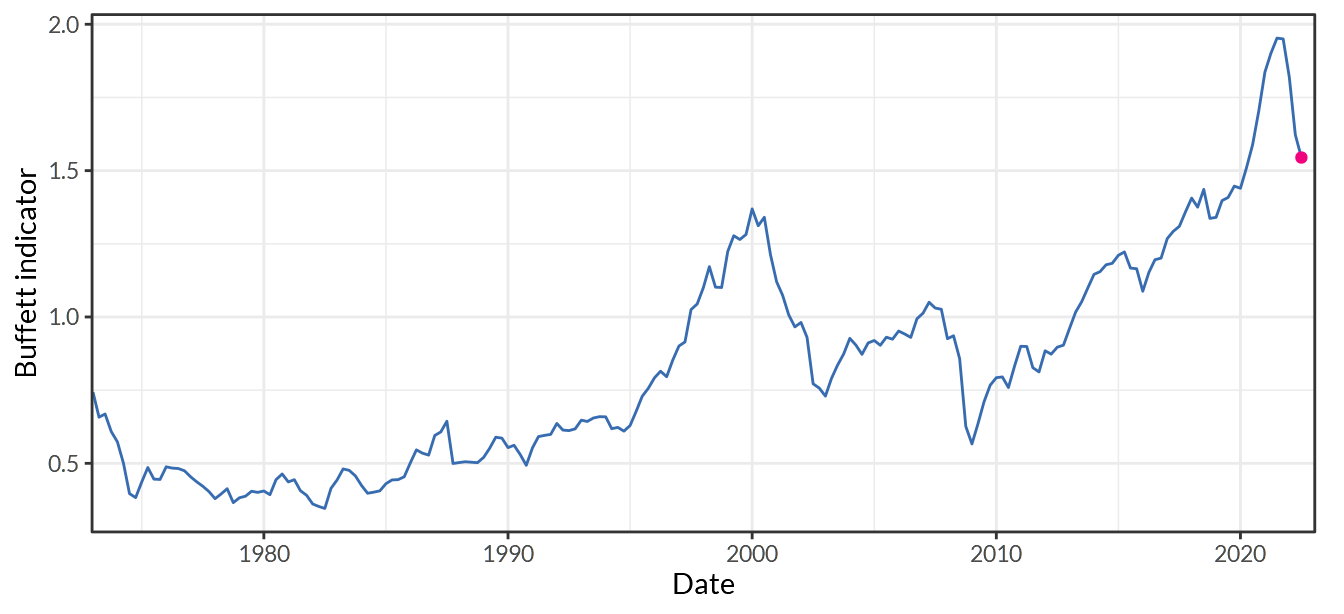
Figure 11.7: Wilshire 5000 Full Cap Price Index/GDP

Figure 11.8: Cyclically adjusted P/E (CAPE) ratio for S&P 500

Data are from World Bank and Wikipedia. Most recent 3 years for which top 3 countries' data are available are shown.↩︎
Data are from World Bank and Wikipedia. Most recent 3 years for which top 3 countries' data are available are shown.↩︎
Source data and details can be found at Gurufocus.com.↩︎
Source data and details can be found at Gurufocus.com.↩︎
Source data and details can be found at Gurufocus.com.↩︎